XCN vs TRX: A Comparative Analysis of Two Emerging Cryptocurrencies in the Digital Asset Market
Introduction: XCN vs TRX Investment Comparison
In the cryptocurrency market, the comparison between Onyxcoin (XCN) vs TRON (TRX) has always been an unavoidable topic for investors. The two not only differ significantly in market cap ranking, application scenarios, and price performance, but also represent different cryptocurrency positioning.
Onyxcoin (XCN): Since its launch, it has gained market recognition as the backbone of web3 blockchain infrastructure.
TRON (TRX): Since its inception in 2017, it has been hailed as a decentralized platform for content entertainment, and has become one of the cryptocurrencies with the highest global trading volume and market capitalization.
This article will comprehensively analyze the investment value comparison between XCN vs TRX, focusing on historical price trends, supply mechanisms, institutional adoption, technological ecosystems, and future predictions, and attempt to answer the question that investors care about most:
"Which is the better buy right now?"
I. Price History Comparison and Current Market Status
XCN and TRX Historical Price Trends
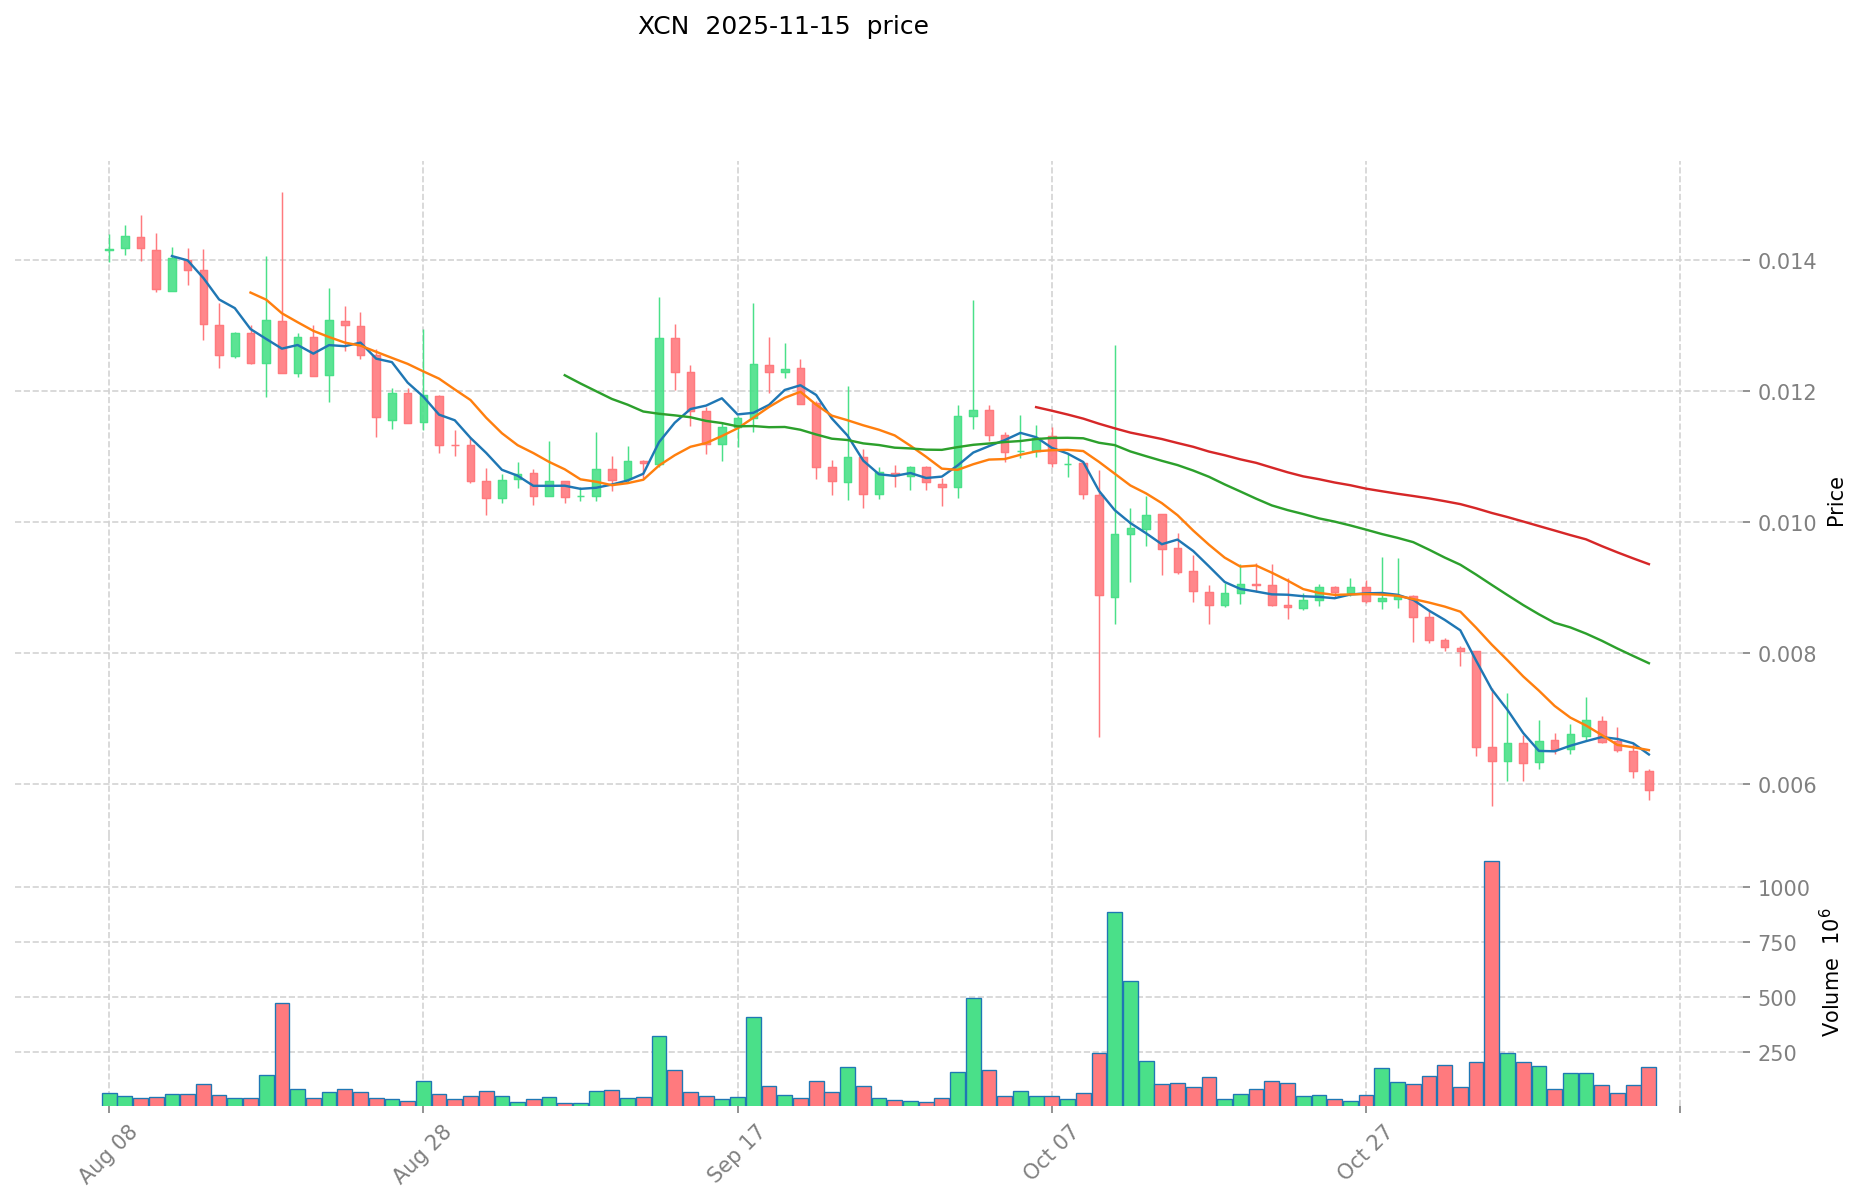
- 2023: XCN reached its all-time low of $0.0007055 on October 12, 2023.
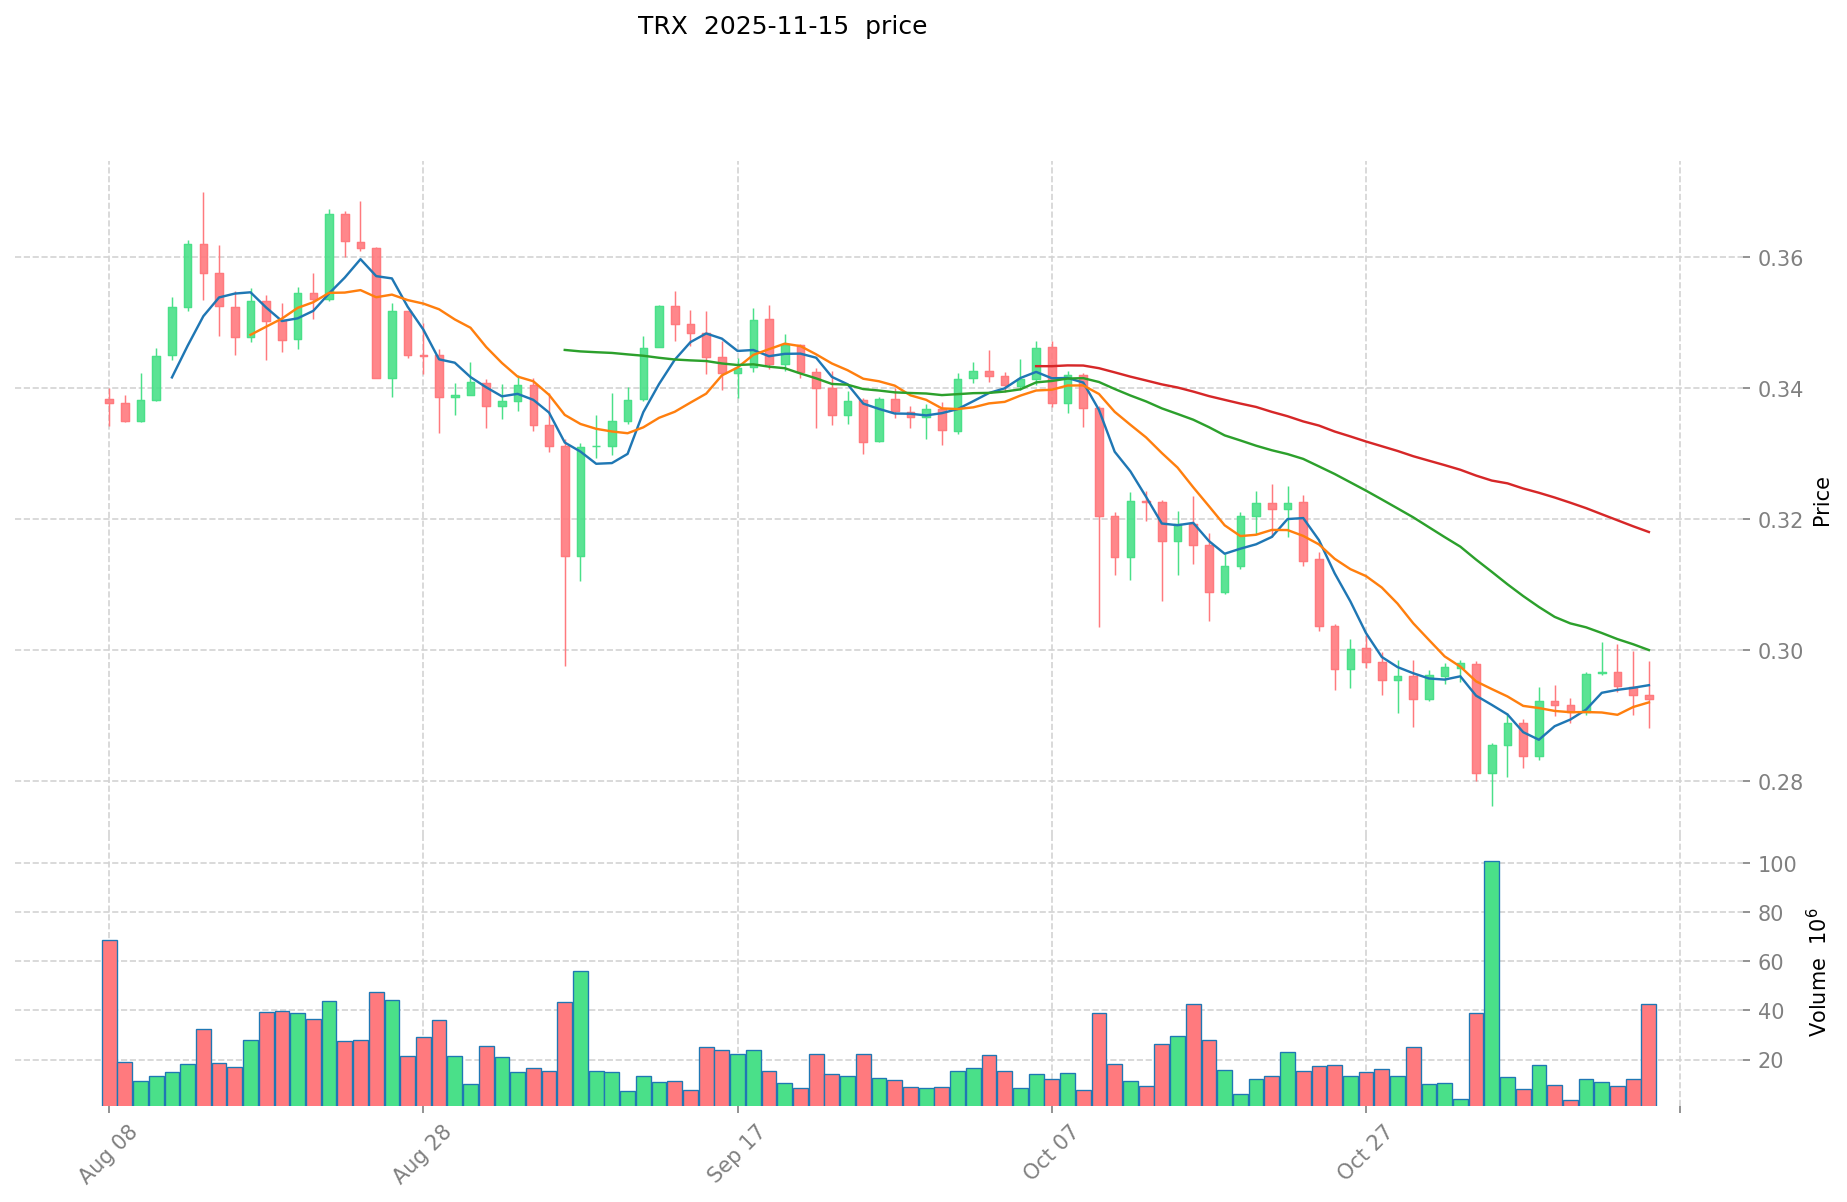
- 2024: TRX achieved its all-time high of $0.431288 on December 4, 2024.
- Comparative analysis: XCN has shown significant volatility, ranging from a high of $0.184139 to a low of $0.0007055, while TRX has demonstrated stronger performance, reaching new highs in recent years.
Current Market Situation (2025-11-16)
- XCN current price: $0.006069
- TRX current price: $0.29408
- 24-hour trading volume: XCN $906,924.22 vs TRX $3,411,167.32
- Market Sentiment Index (Fear & Greed Index): 10 (Extreme Fear)
Click to view real-time prices:
- Check XCN current price Market Price
- Check TRX current price Market Price
II. Key Factors Affecting the Investment Value of XCN vs TRX
Supply Mechanisms Comparison (Tokenomics)
- XCN: Fixed maximum supply of 10 billion tokens with a deflationary mechanism through token burning
- TRX: Total supply capped at 100 billion tokens with an inflationary model that issues rewards to validators and voters
- 📌 Historical Pattern: Deflationary models like XCN's tend to support price appreciation over time, while TRX's inflation rate (around 2%) requires strong network growth to maintain price stability.
Institutional Adoption and Market Applications
- Institutional Holdings: TRX has gained more institutional recognition with partnerships across various industries, while XCN has limited institutional backing
- Enterprise Adoption: TRX has established broader real-world applications in entertainment, gaming, and cross-border payments; XCN's adoption remains primarily focused within its own ecosystem
- Regulatory Attitudes: Both tokens face varying regulatory scrutiny across jurisdictions, with TRX having more established relationships with certain governments, particularly in Asia
Technical Development and Ecosystem Building
- XCN Technical Upgrades: Focusing on interoperability solutions and cross-chain functionality to connect with major blockchain networks
- TRX Technical Development: TRON network has implemented multiple upgrades enhancing its smart contract capabilities and transaction throughput (2,000+ TPS)
- Ecosystem Comparison: TRX has a more mature ecosystem with extensive DeFi applications, stablecoin adoption (USDT), and NFT marketplaces; XCN's ecosystem is still developing with fewer operational DApps and limited DeFi infrastructure
Macroeconomic Factors and Market Cycles
- Performance During Inflation: TRX has demonstrated more stability during inflationary periods due to its larger market cap and liquidity
- Monetary Policy Impact: Both tokens show correlation with broader crypto market movements in response to interest rate changes, though TRX historically demonstrates more resilience during market downturns
- Geopolitical Factors: TRX benefits from strong adoption in Asian markets, while XCN lacks significant geographical advantage in cross-border transaction demand
III. 2025-2030 Price Prediction: XCN vs TRX
Short-term Prediction (2025)
- XCN: Conservative $0.004548 - $0.006064 | Optimistic $0.006064 - $0.0087928
- TRX: Conservative $0.2734386 - $0.29402 | Optimistic $0.29402 - $0.3175416
Mid-term Prediction (2027)
- XCN may enter a growth phase, with estimated price range $0.0055861568 - $0.0103867603
- TRX may enter a volatile phase, with estimated price range $0.19025681376 - $0.38051362752
- Key drivers: Institutional capital inflow, ETF, ecosystem development
Long-term Prediction (2030)
- XCN: Base scenario $0.010586914916655 - $0.013445381944151 | Optimistic scenario $0.013445381944151+
- TRX: Base scenario $0.46863177257988 - $0.684202387966624 | Optimistic scenario $0.684202387966624+
Disclaimer: This analysis is for informational purposes only and should not be considered as financial advice. Cryptocurrency markets are highly volatile and unpredictable. Always conduct your own research before making any investment decisions.
XCN:
| 年份 | 预测最高价 | 预测平均价格 | 预测最低价 | 涨跌幅 |
|---|---|---|---|---|
| 2025 | 0.0087928 | 0.006064 | 0.004548 | 0 |
| 2026 | 0.01002834 | 0.0074284 | 0.00631414 | 22 |
| 2027 | 0.0103867603 | 0.00872837 | 0.0055861568 | 44 |
| 2028 | 0.010704472968 | 0.00955756515 | 0.0086973842865 | 58 |
| 2029 | 0.01104281077431 | 0.010131019059 | 0.00800350505661 | 67 |
| 2030 | 0.013445381944151 | 0.010586914916655 | 0.00550519575666 | 75 |
TRX:
| 年份 | 预测最高价 | 预测平均价格 | 预测最低价 | 涨跌幅 |
|---|---|---|---|---|
| 2025 | 0.3175416 | 0.29402 | 0.2734386 | 0 |
| 2026 | 0.318012032 | 0.3057808 | 0.29049176 | 3 |
| 2027 | 0.38051362752 | 0.311896416 | 0.19025681376 | 6 |
| 2028 | 0.4189080763296 | 0.34620502176 | 0.294274268496 | 17 |
| 2029 | 0.55470699611496 | 0.3825565490448 | 0.22953392942688 | 30 |
| 2030 | 0.684202387966624 | 0.46863177257988 | 0.281179063547928 | 59 |
IV. Investment Strategy Comparison: XCN vs TRX
Long-term vs Short-term Investment Strategies
- XCN: Suitable for investors focused on web3 infrastructure potential and cross-chain interoperability
- TRX: Suitable for investors seeking established ecosystems and entertainment industry applications
Risk Management and Asset Allocation
- Conservative investors: XCN: 20% vs TRX: 80%
- Aggressive investors: XCN: 40% vs TRX: 60%
- Hedging tools: Stablecoin allocation, options, cross-currency portfolios
V. Potential Risk Comparison
Market Risks
- XCN: Higher volatility, lower liquidity, and market sentiment sensitivity
- TRX: Exposure to broader crypto market trends and competition in the DeFi space
Technical Risks
- XCN: Scalability, network stability
- TRX: Hash power concentration, security vulnerabilities
Regulatory Risks
- Global regulatory policies may impact both differently, with TRX potentially facing more scrutiny due to its wider adoption
VI. Conclusion: Which Is the Better Buy?
📌 Investment Value Summary:
- XCN advantages: Deflationary model, focus on interoperability, potential for growth in web3 infrastructure
- TRX advantages: Established ecosystem, high transaction throughput, strong adoption in Asia
✅ Investment Advice:
- New investors: Consider a smaller allocation to XCN for higher risk/reward, larger allocation to TRX for stability
- Experienced investors: Balanced portfolio with both, adjusting based on risk tolerance and market conditions
- Institutional investors: TRX for its established market position, XCN for potential long-term growth in web3 infrastructure
⚠️ Risk Warning: The cryptocurrency market is highly volatile. This article does not constitute investment advice. None
VII. FAQ
Q1: What are the main differences between XCN and TRX? A: XCN is focused on web3 infrastructure with a deflationary model, while TRX is an established platform for content entertainment with a larger ecosystem. XCN has a fixed supply of 10 billion tokens, whereas TRX has a cap of 100 billion tokens with an inflationary model.
Q2: Which cryptocurrency has shown better price performance historically? A: TRX has demonstrated stronger performance, reaching new highs in recent years. It achieved its all-time high of $0.431288 on December 4, 2024. In contrast, XCN has shown significant volatility, with its all-time low of $0.0007055 occurring on October 12, 2023.
Q3: How do the ecosystems of XCN and TRX compare? A: TRX has a more mature ecosystem with extensive DeFi applications, stablecoin adoption (USDT), and NFT marketplaces. XCN's ecosystem is still developing with fewer operational DApps and limited DeFi infrastructure.
Q4: What are the key factors affecting the investment value of XCN and TRX? A: Key factors include supply mechanisms, institutional adoption, technical development, ecosystem building, macroeconomic factors, and market cycles. TRX generally has more institutional recognition and broader real-world applications compared to XCN.
Q5: How do the long-term price predictions for XCN and TRX compare? A: By 2030, XCN's base scenario price range is predicted to be $0.010586914916655 - $0.013445381944151, while TRX's base scenario range is $0.46863177257988 - $0.684202387966624. TRX is expected to have a higher price range in the long term.
Q6: What are the recommended investment strategies for XCN and TRX? A: For conservative investors, a suggested allocation is 20% XCN and 80% TRX. For aggressive investors, the recommendation is 40% XCN and 60% TRX. New investors might consider a smaller allocation to XCN for higher risk/reward and a larger allocation to TRX for stability.
Q7: What are the potential risks associated with investing in XCN and TRX? A: XCN faces higher volatility, lower liquidity, and market sentiment sensitivity. TRX is exposed to broader crypto market trends and competition in the DeFi space. Both face regulatory risks, with TRX potentially facing more scrutiny due to its wider adoption. Technical risks include scalability and network stability for XCN, and hash power concentration and security vulnerabilities for TRX.
Share
Content
Introduction: XCN vs TRX Investment Comparison
I. Price History Comparison and Current Market Status
II. Key Factors Affecting the Investment Value of XCN vs TRX
III. 2025-2030 Price Prediction: XCN vs TRX
IV. Investment Strategy Comparison: XCN vs TRX
V. Potential Risk Comparison
VI. Conclusion: Which Is the Better Buy?
VII. FAQ

