VSN vs SNX: Comparing Two Leading Blockchain Protocols for Synthetic Asset Trading
Introduction: VSN vs SNX Investment Comparison
In the cryptocurrency market, the comparison between Vision (VSN) and Synthetix (SNX) has been an unavoidable topic for investors. The two not only differ significantly in market cap ranking, application scenarios, and price performance, but also represent different positioning in the crypto asset space.
Vision (VSN): Launched as a Web3 ecosystem token, it aims to serve ordinary users through wallet rewards, fee discounts, and cross-chain functions, while providing institutions with MiCAR-compliant securities token solutions.
Synthetix (SNX): Since its inception in 2018, it has been designed for engineers to build decentralized and trustless networks, supporting a variety of synthetic assets including fiat currencies pegged to the US dollar, precious metals, indices, and even other cryptocurrencies.
This article will comprehensively analyze the investment value comparison between VSN and SNX, focusing on historical price trends, supply mechanisms, institutional adoption, technological ecosystems, and future predictions, attempting to answer the question most important to investors:
"Which is the better buy right now?"
I. Price History Comparison and Current Market Status
Vision (VSN) and Synthetix (SNX) Historical Price Trends
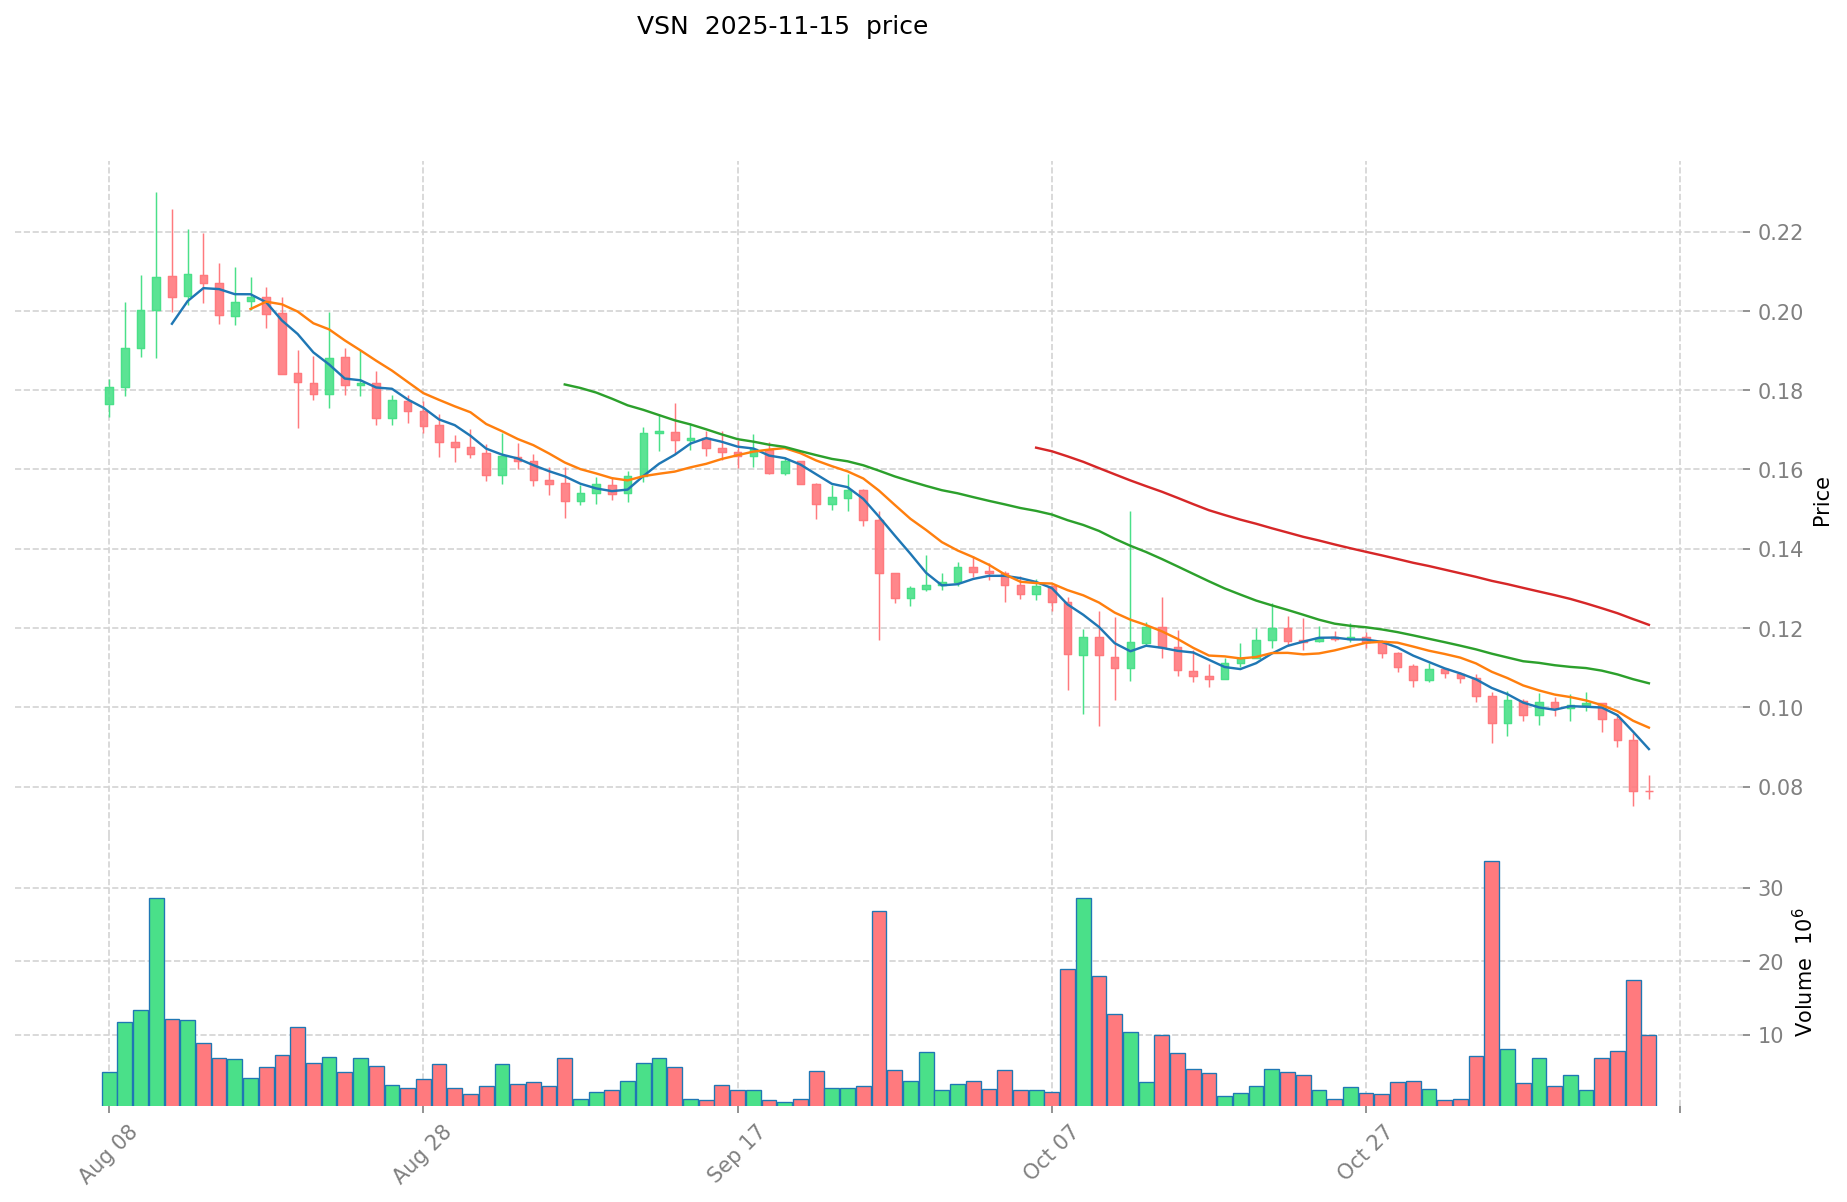
- 2025: VSN reached its all-time high of $0.23 on August 11, 2025.
- 2021: SNX hit its all-time high of $28.53 on February 14, 2021.
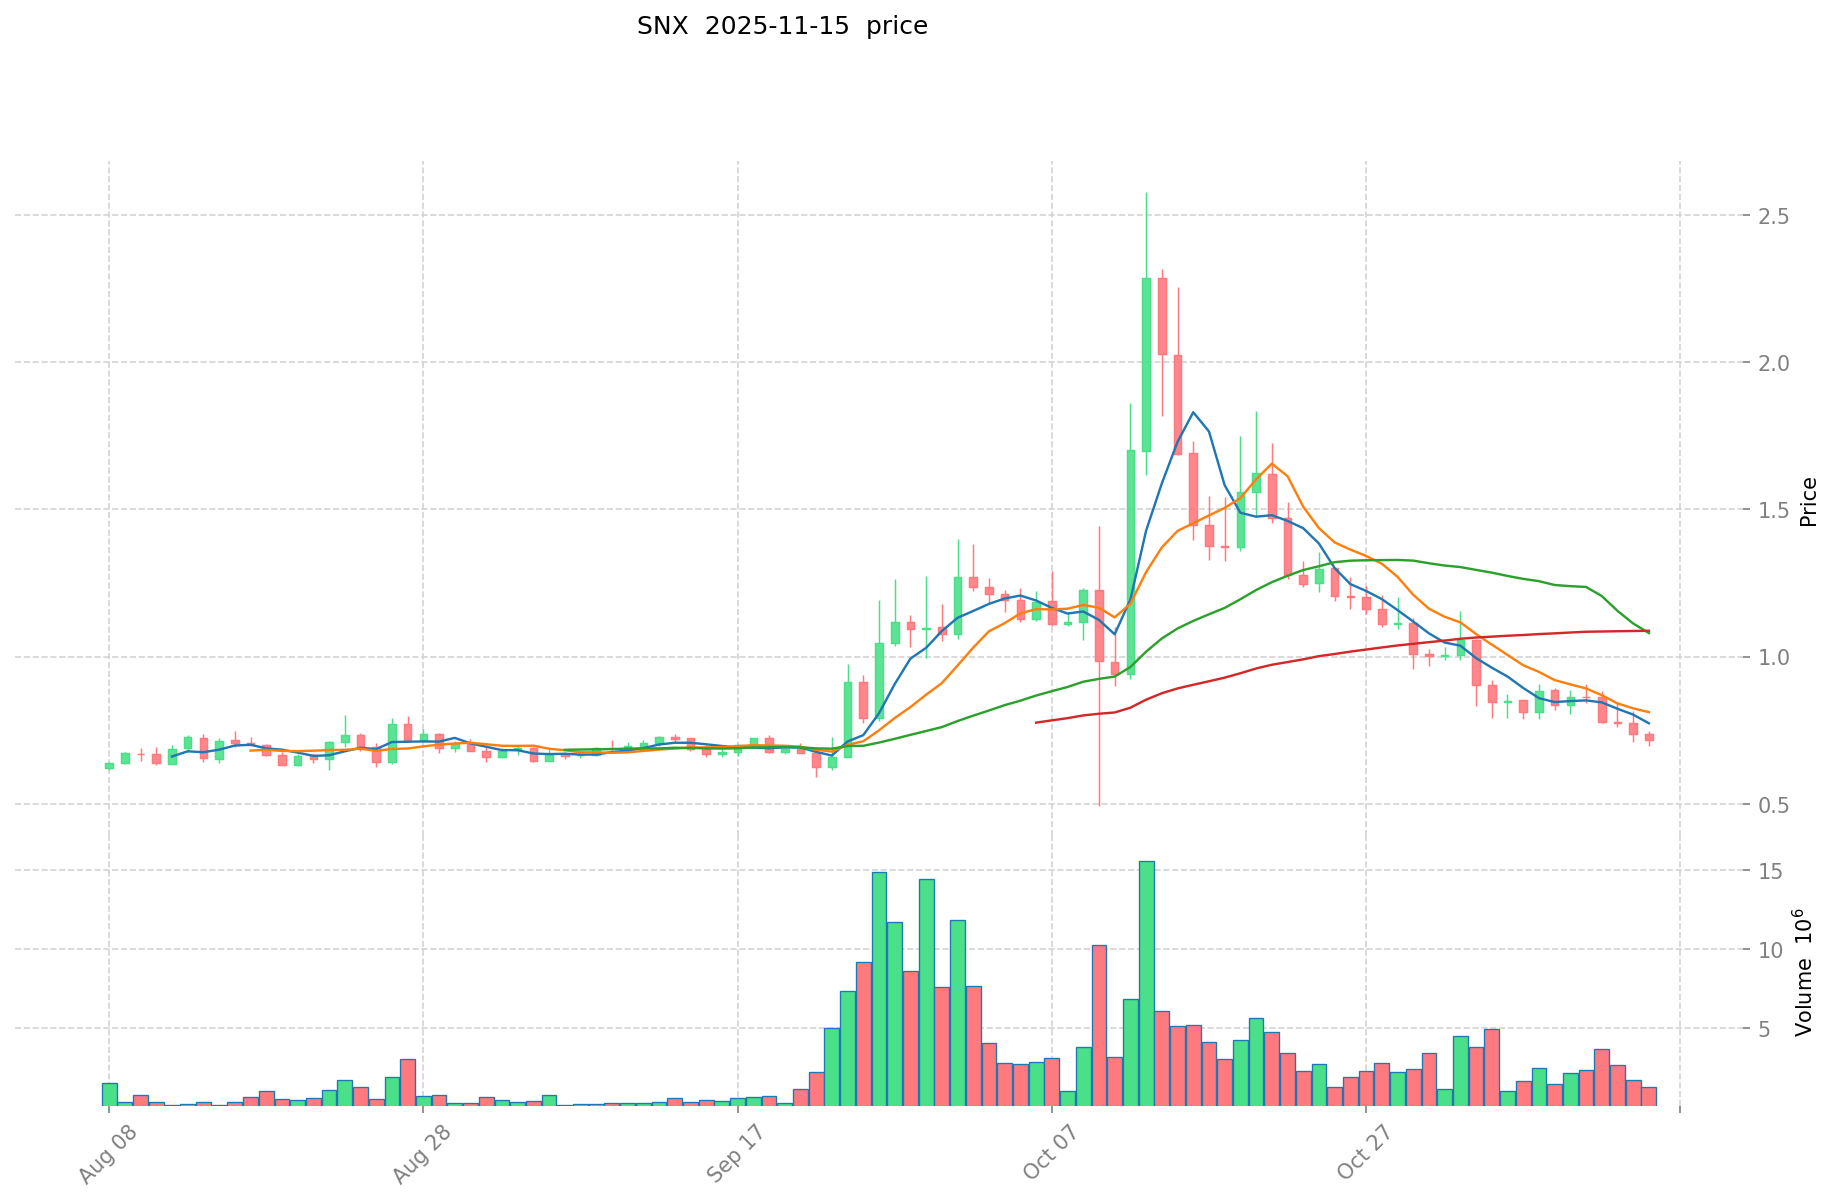
- Comparative analysis: In recent market cycles, VSN dropped from its high of $0.23 to a low of $0.07521, while SNX fell from $28.53 to its current price of $0.7436.
Current Market Situation (2025-11-16)
- VSN current price: $0.08354
- SNX current price: $0.7436
- 24-hour trading volume: VSN $1,130,090.04 vs SNX $1,270,115.79
- Market Sentiment Index (Fear & Greed Index): 10 (Extreme Fear)
Click to view real-time prices:
- Check VSN current price Market Price
- Check SNX current price Market Price
II. Core Factors Affecting Investment Value of VSN vs SNX
Supply Mechanisms (Tokenomics)
- VSN: VSN has a fixed supply cap of 100 million tokens, with 64% allocated to the community. Initial circulating supply was 8.4 million tokens, with a structured vesting schedule for team and investors.
- SNX: SNX operates with an inflationary model that started at 75 million tokens, with additional SNX minted as staking rewards. The protocol has implemented several supply adjustments through governance.
- 📌 Historical Pattern: Fixed supply tokens like VSN tend to create scarcity-driven value, while SNX's inflationary model incentivizes staking participation but may create sell pressure from continuous emissions.
Institutional Adoption and Market Applications
- Institutional Holdings: SNX has established presence among crypto funds and DeFi-focused institutions with significant TVL history, while VSN is newer with emerging institutional interest.
- Enterprise Adoption: SNX has been integrated with multiple protocols in the DeFi ecosystem as a collateralization mechanism, while VSN's adoption within enterprise solutions is still developing.
- Regulatory Stance: Both protocols face similar regulatory scrutiny in the synthetic assets space, with regulatory clarity around derivatives and synthetic assets potentially affecting both protocols similarly.
Technical Development and Ecosystem Building
- VSN Technical Upgrades: Vision Protocol's on-chain AI-powered DeFi derivative platform allows for permissionless derivative creation with its VLP portfolio technology, enabling derivatives for any on-chain data.
- SNX Technical Development: Synthetix focuses on decentralized derivatives trading with a robust oracle system and has undergone several major versions improving its trading infrastructure and cross-chain capabilities.
- Ecosystem Comparison: SNX has an established ecosystem with proven derivatives trading solutions, while VSN offers a more modern approach with AI capabilities and a broader scope for derivative creation.
Macroeconomic Factors and Market Cycles
- Inflation Performance: SNX has demonstrated resilience through multiple market cycles with its collateral-backed model, while VSN's performance against inflation remains to be proven.
- Monetary Policy Effects: Interest rate changes affect the derivatives market that both protocols operate in, with higher rates potentially increasing demand for synthetic assets that offer hedging opportunities.
- Geopolitical Factors: Growing demand for decentralized financial instruments during periods of economic uncertainty could benefit both protocols as alternatives to traditional financial systems.
III. 2025-2030 Price Prediction: VSN vs SNX
Short-term Prediction (2025)
- VSN: Conservative $0.070-$0.084 | Optimistic $0.084-$0.092
- SNX: Conservative $0.563-$0.741 | Optimistic $0.741-$0.829
Mid-term Prediction (2027)
- VSN may enter a growth phase, with expected price range of $0.062-$0.133
- SNX may enter a consolidation phase, with expected price range of $0.526-$0.952
- Key drivers: Institutional capital inflow, ETFs, ecosystem development
Long-term Prediction (2030)
- VSN: Base scenario $0.100-$0.131 | Optimistic scenario $0.131-$0.194
- SNX: Base scenario $0.685-$1.123 | Optimistic scenario $1.123-$1.325
Disclaimer
VSN:
| 年份 | 预测最高价 | 预测平均价格 | 预测最低价 | 涨跌幅 |
|---|---|---|---|---|
| 2025 | 0.092026 | 0.08366 | 0.0702744 | 0 |
| 2026 | 0.12649392 | 0.087843 | 0.06324696 | 5 |
| 2027 | 0.1328888904 | 0.10716846 | 0.0621577068 | 28 |
| 2028 | 0.13203154272 | 0.1200286752 | 0.094822653408 | 43 |
| 2029 | 0.1361125176768 | 0.12603010896 | 0.100824087168 | 50 |
| 2030 | 0.193985543711232 | 0.1310713133184 | 0.099614198121984 | 56 |
SNX:
| 年份 | 预测最高价 | 预测平均价格 | 预测最低价 | 涨跌幅 |
|---|---|---|---|---|
| 2025 | 0.829472 | 0.7406 | 0.562856 | 0 |
| 2026 | 1.02839716 | 0.785036 | 0.6280288 | 5 |
| 2027 | 0.952052409 | 0.90671658 | 0.5258956164 | 21 |
| 2028 | 0.957266029335 | 0.9293844945 | 0.882915269775 | 24 |
| 2029 | 1.30178886144615 | 0.9433252619175 | 0.594294915008025 | 26 |
| 2030 | 1.324617332784553 | 1.122557061681825 | 0.684759807625913 | 50 |
IV. Investment Strategy Comparison: VSN vs SNX
Long-term vs Short-term Investment Strategies
- VSN: Suitable for investors focused on Web3 ecosystem potential and AI-powered DeFi derivatives
- SNX: Suitable for investors seeking established DeFi infrastructure and synthetic asset exposure
Risk Management and Asset Allocation
- Conservative investors: VSN: 30% vs SNX: 70%
- Aggressive investors: VSN: 60% vs SNX: 40%
- Hedging tools: Stablecoin allocation, options, cross-token portfolio
V. Potential Risk Comparison
Market Risks
- VSN: Higher volatility due to newer market presence and smaller market cap
- SNX: Exposure to broader DeFi market fluctuations and synthetic asset risks
Technical Risks
- VSN: Scalability, network stability of AI-powered platform
- SNX: Oracle reliability, smart contract vulnerabilities
Regulatory Risks
- Global regulatory policies may impact both tokens differently, with potential scrutiny on synthetic assets affecting SNX more directly
VI. Conclusion: Which Is the Better Buy?
📌 Investment Value Summary:
- VSN advantages: AI-powered derivatives platform, fixed supply tokenomics, potential for rapid growth
- SNX advantages: Established ecosystem, proven track record in DeFi, broader institutional adoption
✅ Investment Advice:
- Novice investors: Consider a balanced approach with a slight tilt towards SNX for its established presence
- Experienced investors: Explore a higher allocation to VSN for potential growth, while maintaining SNX exposure
- Institutional investors: Evaluate VSN for innovative technology exposure and SNX for established DeFi infrastructure integration
⚠️ Risk Warning: Cryptocurrency markets are highly volatile. This article does not constitute investment advice. None
VII. FAQ
Q1: What are the main differences between VSN and SNX? A: VSN is a Web3 ecosystem token with a fixed supply, focusing on AI-powered DeFi derivatives. SNX is an established DeFi protocol with an inflationary model, specializing in synthetic assets and decentralized derivatives trading.
Q2: Which token has performed better historically? A: SNX reached its all-time high of $28.53 in February 2021, while VSN's all-time high was $0.23 in August 2025. However, both have seen significant drops from their peaks, with SNX currently trading at $0.7436 and VSN at $0.08354.
Q3: How do the supply mechanisms differ between VSN and SNX? A: VSN has a fixed supply cap of 100 million tokens, with 64% allocated to the community. SNX operates with an inflationary model, starting at 75 million tokens and minting additional tokens as staking rewards.
Q4: What are the key factors affecting the investment value of VSN and SNX? A: Key factors include supply mechanisms, institutional adoption, technical development, ecosystem building, and macroeconomic factors such as inflation and monetary policy.
Q5: What are the long-term price predictions for VSN and SNX? A: By 2030, VSN is predicted to range from $0.100 to $0.194, while SNX is expected to range from $0.685 to $1.325 in optimistic scenarios.
Q6: How should investors allocate their assets between VSN and SNX? A: Conservative investors might consider 30% VSN and 70% SNX, while aggressive investors could opt for 60% VSN and 40% SNX. However, individual allocations should be based on personal risk tolerance and investment goals.
Q7: What are the main risks associated with investing in VSN and SNX? A: Risks include market volatility, technical vulnerabilities, regulatory uncertainties, and exposure to broader DeFi market fluctuations. VSN may face higher volatility due to its newer market presence, while SNX is more exposed to risks related to synthetic assets.
Share
Content
Introduction: VSN vs SNX Investment Comparison
I. Price History Comparison and Current Market Status
II. Core Factors Affecting Investment Value of VSN vs SNX
III. 2025-2030 Price Prediction: VSN vs SNX
IV. Investment Strategy Comparison: VSN vs SNX
V. Potential Risk Comparison
VI. Conclusion: Which Is the Better Buy?
VII. FAQ

