TRX vs CHZ: Battle of the Blockchain Titans in Sports and Entertainment
Introduction: TRX vs CHZ Investment Comparison
In the cryptocurrency market, the comparison between TRON vs Chiliz has always been a topic that investors can't avoid. The two not only have obvious differences in market cap ranking, application scenarios, and price performance, but also represent different crypto asset positioning.
TRON (TRX): Since its launch in 2017, it has gained market recognition for its decentralized application platform and blockchain infrastructure.
Chiliz (CHZ): Since its inception in 2019, it has been hailed as a pioneer in fan engagement and sports tokenization, becoming one of the leading cryptocurrencies in the sports and entertainment sector.
This article will provide a comprehensive analysis of the investment value comparison between TRON vs Chiliz, focusing on historical price trends, supply mechanisms, institutional adoption, technological ecosystems, and future predictions, attempting to answer the question investors care about most:
"Which is the better buy right now?"
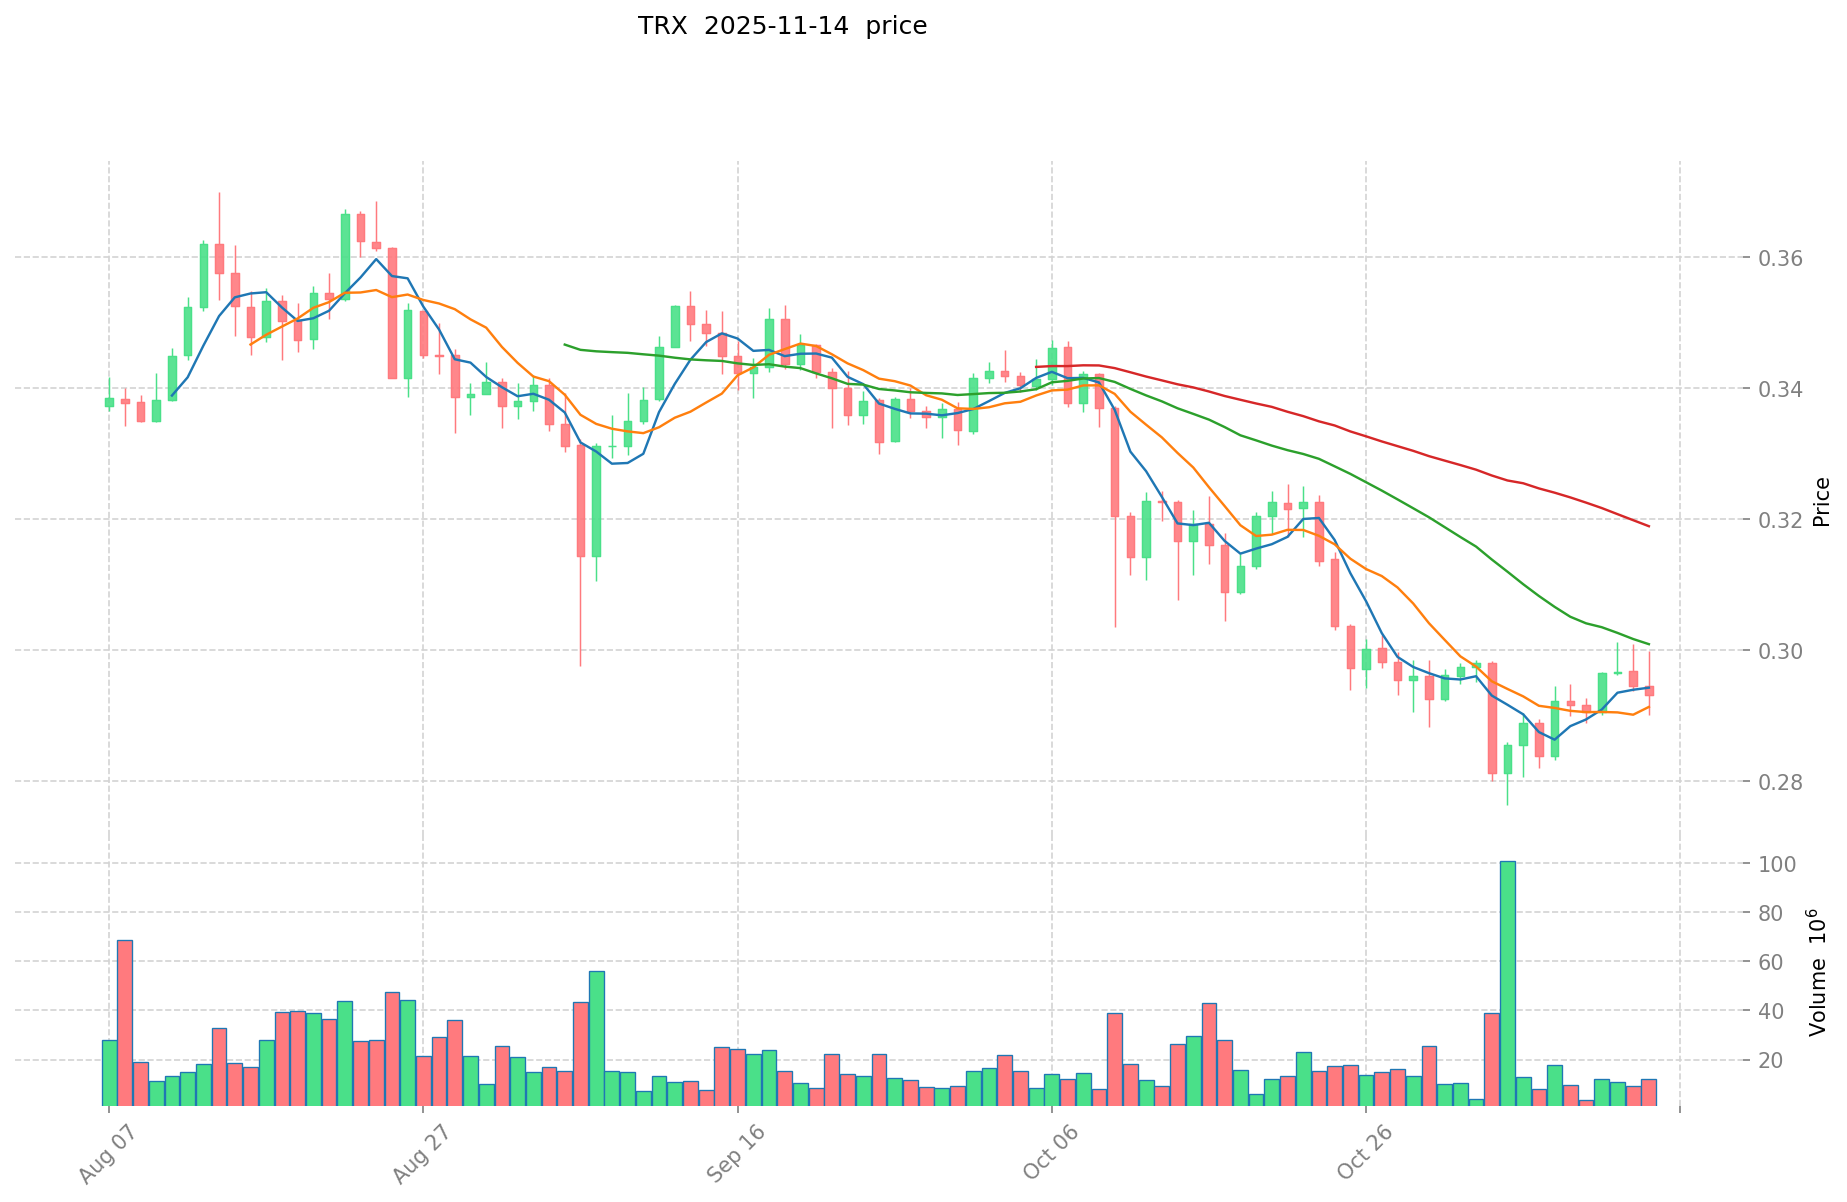
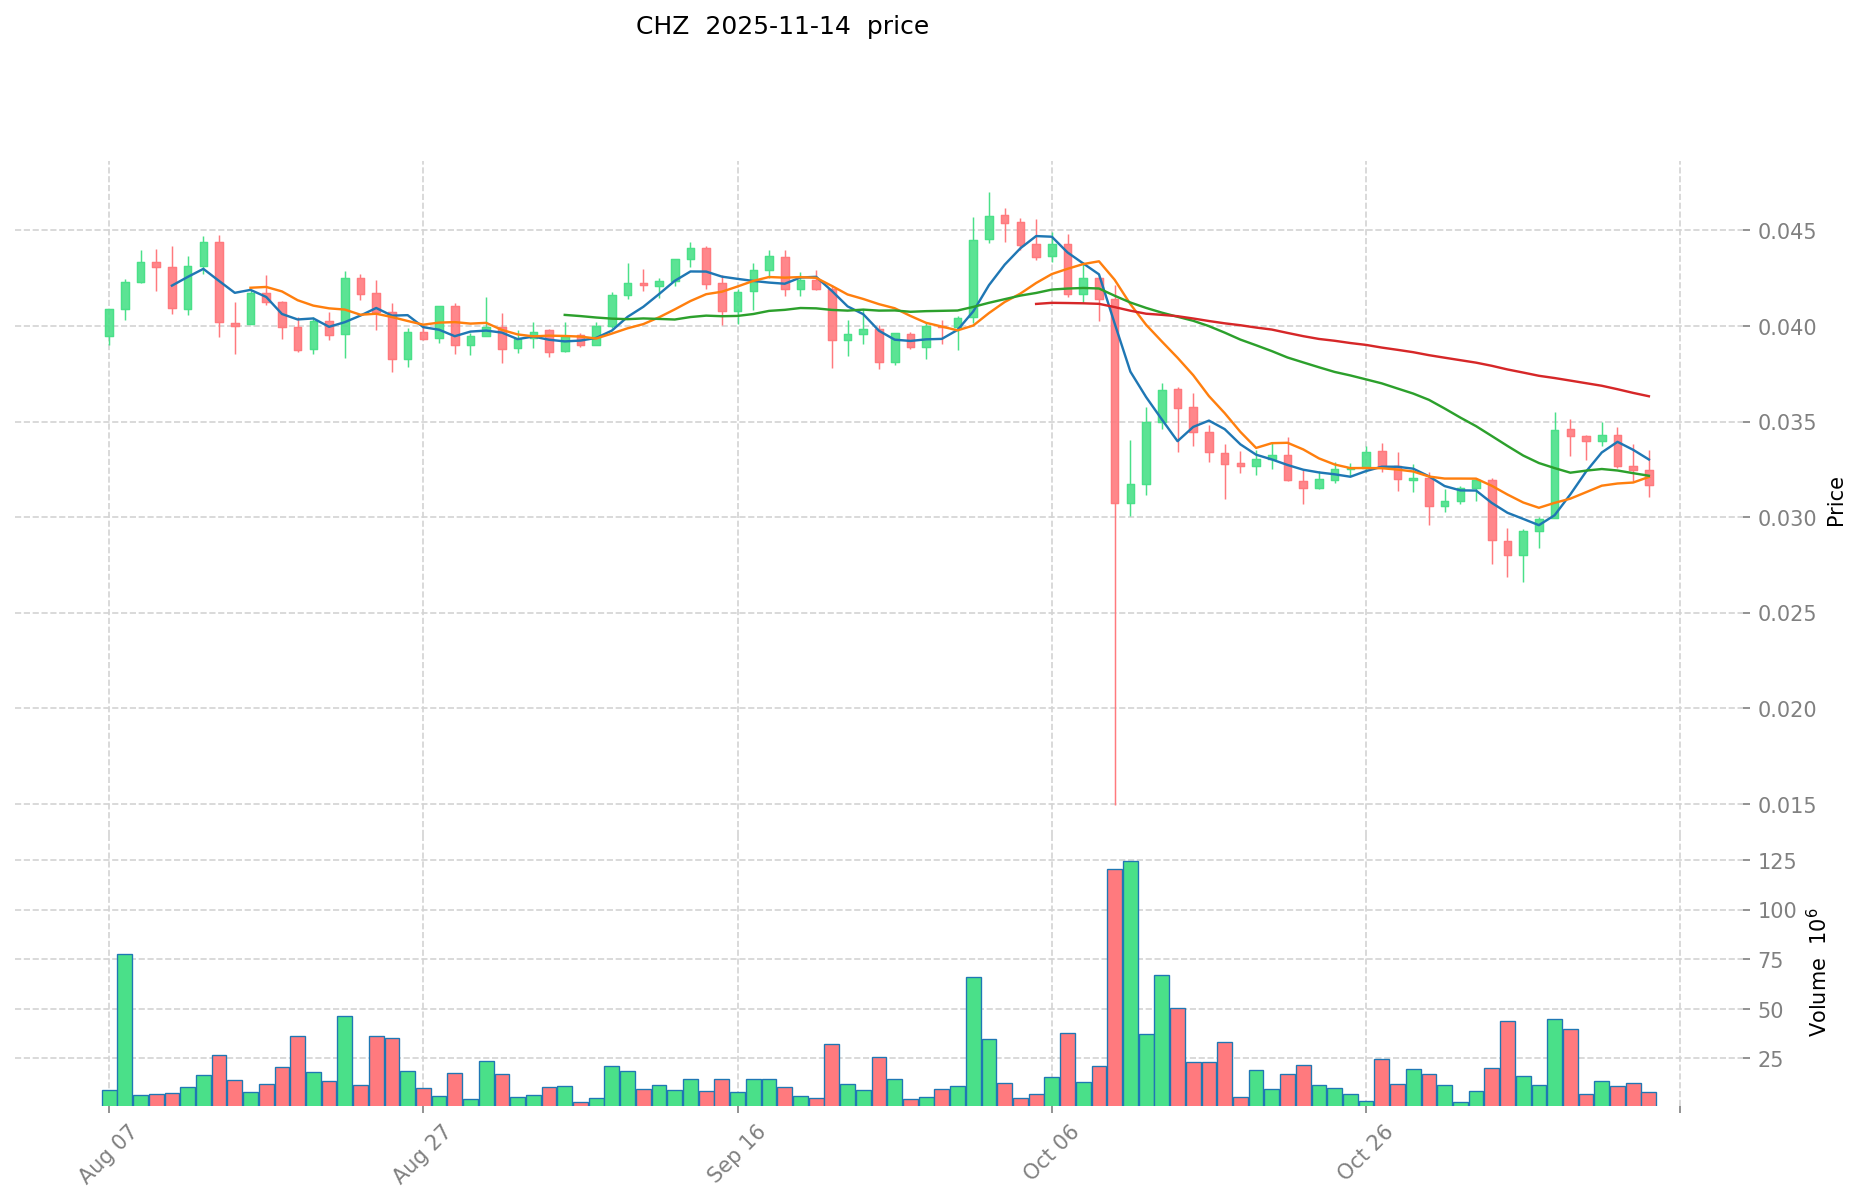
I. Price History Comparison and Current Market Status
TRX (TRON) and CHZ (Chiliz) Historical Price Trends
- 2024: TRX reached its all-time high of $0.431288 on December 4, 2024, due to significant market growth.
- 2021: CHZ hit its all-time high of $0.878633 on March 13, 2021, likely influenced by the growing interest in fan tokens and sports-related cryptocurrencies.
- Comparative Analysis: In the recent market cycle, TRX has shown more resilience, currently trading at $0.29357, which is about 32% below its all-time high. In contrast, CHZ is trading at $0.03127, approximately 96% below its all-time high.
Current Market Situation (2025-11-14)
- TRX current price: $0.29357
- CHZ current price: $0.03127
- 24-hour trading volume: TRX $5,195,793.06 vs CHZ $406,471.02
- Market Sentiment Index (Fear & Greed Index): 16 (Extreme Fear)
Click to view real-time prices:
- Check TRX current price Market Price
- Check CHZ current price Market Price
II. Core Factors Affecting Investment Value of TRX vs CHZ
Supply Mechanisms Comparison (Tokenomics)
- TRX: Deflationary model with token burning mechanism. TRON completed the upgrade to an ultra-deflationary economic model in 2021, implementing regular token burning to decrease circulating supply.
- CHZ: Fixed supply model with a maximum cap of 8.888 billion tokens. The supply is controlled through strategic token releases and occasional burns tied to specific platform events.
- 📌 Historical Pattern: Deflationary models like TRX's tend to create upward price pressure over time, while CHZ's fixed supply creates scarcity value during periods of high demand for fan tokens and sports-related activities.
Institutional Adoption and Market Applications
- Institutional Holdings: TRX has gained more institutional traction due to its broader infrastructure focus and established position in the DeFi space.
- Enterprise Adoption: TRX has stronger adoption in payment solutions and cross-border transfers through TRON's infrastructure, while CHZ specializes in sports and entertainment partnerships through fan token offerings.
- Regulatory Attitudes: Both face varying regulatory scrutiny, with TRX experiencing more challenges due to its broader financial services scope, while CHZ benefits from clearer positioning in the sports and entertainment sectors.
Technical Development and Ecosystem Building
- TRX Technical Upgrades: TRON has implemented significant upgrades focused on scalability and transaction speed, positioning itself as a high-throughput blockchain for Web3 applications.
- CHZ Technical Development: Chiliz is developing Chiliz Chain 2.0, a layer-1 blockchain specifically designed for the sports and entertainment industry, enhancing its utility within its niche market.
- Ecosystem Comparison: TRX has a more diversified ecosystem spanning DeFi, stablecoins, and NFTs with significant TVL, while CHZ has a more focused ecosystem around fan engagement and sports tokenization through the Socios.com platform.
Macroeconomic Factors and Market Cycles
- Inflation Performance: TRX tends to show more resilience during inflationary periods due to its deflationary mechanism and broader utility in financial services.
- Monetary Policy Impact: Both tokens show sensitivity to broader crypto market trends influenced by monetary policy, though CHZ displays higher correlation to sports seasons and events.
- Geopolitical Factors: TRX benefits from strong adoption in regions with high crypto adoption rates, while CHZ's value is more tied to global sports events and entertainment industry developments.
III. 2025-2030 Price Prediction: TRX vs CHZ
Short-term Prediction (2025)
- TRX: Conservative $0.2608 - $0.2930 | Optimistic $0.2930 - $0.4278
- CHZ: Conservative $0.0289 - $0.0311 | Optimistic $0.0311 - $0.0364
Mid-term Prediction (2027)
- TRX may enter a growth phase, expected price range $0.2636 - $0.4547
- CHZ may enter a steady growth phase, expected price range $0.0321 - $0.0363
- Key drivers: Institutional capital inflow, ETF developments, ecosystem growth
Long-term Prediction (2030)
- TRX: Base scenario $0.5512 - $0.5788 | Optimistic scenario $0.5788 - $0.6024
- CHZ: Base scenario $0.0484 - $0.0590 | Optimistic scenario $0.0590 - $0.0611
Disclaimer: This analysis is based on historical data and projections. Cryptocurrency markets are highly volatile and unpredictable. This information should not be considered as financial advice. Always conduct your own research before making investment decisions.
TRX:
| 年份 | 预测最高价 | 预测平均价格 | 预测最低价 | 涨跌幅 |
|---|---|---|---|---|
| 2025 | 0.4278384 | 0.29304 | 0.2608056 | 0 |
| 2026 | 0.403691904 | 0.3604392 | 0.183823992 | 22 |
| 2027 | 0.45465800688 | 0.382065552 | 0.26362523088 | 30 |
| 2028 | 0.6024409623936 | 0.41836177944 | 0.2426498320752 | 42 |
| 2029 | 0.592065590263488 | 0.5104013709168 | 0.403217083024272 | 73 |
| 2030 | 0.578795154619651 | 0.551233480590144 | 0.30869074913048 | 87 |
CHZ:
| 年份 | 预测最高价 | 预测平均价格 | 预测最低价 | 涨跌幅 |
|---|---|---|---|---|
| 2025 | 0.0364104 | 0.03112 | 0.0289416 | 0 |
| 2026 | 0.036804068 | 0.0337652 | 0.028362768 | 8 |
| 2027 | 0.03634317302 | 0.035284634 | 0.03210901694 | 12 |
| 2028 | 0.0494231868438 | 0.03581390351 | 0.0304418179835 | 14 |
| 2029 | 0.054125552374663 | 0.0426185451769 | 0.037078134303903 | 36 |
| 2030 | 0.059013899506453 | 0.048372048775781 | 0.033376713655289 | 54 |
IV. Investment Strategy Comparison: TRX vs CHZ
Long-term vs Short-term Investment Strategies
- TRX: Suitable for investors focused on DeFi ecosystems and blockchain infrastructure potential
- CHZ: Suitable for investors interested in sports and entertainment sector growth
Risk Management and Asset Allocation
- Conservative investors: TRX: 60% vs CHZ: 40%
- Aggressive investors: TRX: 70% vs CHZ: 30%
- Hedging tools: Stablecoin allocation, options, cross-currency portfolios
V. Potential Risk Comparison
Market Risk
- TRX: Higher volatility due to broader market exposure
- CHZ: Seasonal fluctuations tied to sports events and fan token demand
Technical Risk
- TRX: Scalability challenges, network stability during high transaction periods
- CHZ: Ecosystem dependency on Socios.com platform, potential vulnerabilities in fan token systems
Regulatory Risk
- Global regulatory policies may impact TRX more due to its broader financial services scope, while CHZ may face less scrutiny in its niche market
VI. Conclusion: Which Is the Better Buy?
📌 Investment Value Summary:
- TRX advantages: Established DeFi ecosystem, deflationary model, broader adoption in financial services
- CHZ advantages: Unique positioning in sports and entertainment, potential for growth with increasing fan token adoption
✅ Investment Advice:
- New investors: Consider a balanced approach, leaning towards TRX for its established ecosystem
- Experienced investors: Evaluate portfolio needs, potentially higher allocation to TRX for DeFi exposure, CHZ for niche market growth
- Institutional investors: Consider TRX for broader blockchain infrastructure play, CHZ for targeted sports and entertainment sector exposure
⚠️ Risk Warning: Cryptocurrency markets are highly volatile. This article does not constitute investment advice. None
VII. FAQ
Q1: What are the main differences between TRX and CHZ in terms of their use cases? A: TRX focuses on decentralized applications and blockchain infrastructure, while CHZ specializes in fan engagement and sports tokenization.
Q2: Which cryptocurrency has shown better price performance recently? A: TRX has shown more resilience, trading at about 32% below its all-time high, while CHZ is trading approximately 96% below its all-time high.
Q3: How do the supply mechanisms of TRX and CHZ differ? A: TRX uses a deflationary model with token burning, while CHZ has a fixed supply model with a maximum cap of 8.888 billion tokens.
Q4: Which cryptocurrency has gained more institutional adoption? A: TRX has gained more institutional traction due to its broader infrastructure focus and established position in the DeFi space.
Q5: What are the key technical developments for each cryptocurrency? A: TRX has implemented upgrades focused on scalability and transaction speed, while CHZ is developing Chiliz Chain 2.0, a layer-1 blockchain for the sports and entertainment industry.
Q6: How do TRX and CHZ compare in terms of long-term price predictions? A: By 2030, TRX is predicted to reach $0.5512 - $0.6024, while CHZ is expected to reach $0.0484 - $0.0611 in the optimistic scenario.
Q7: What are the main risk factors for each cryptocurrency? A: TRX faces higher volatility due to broader market exposure and potential regulatory challenges, while CHZ is subject to seasonal fluctuations tied to sports events and potential vulnerabilities in fan token systems.
Share
Content
Introduction: TRX vs CHZ Investment Comparison
I. Price History Comparison and Current Market Status
II. Core Factors Affecting Investment Value of TRX vs CHZ
III. 2025-2030 Price Prediction: TRX vs CHZ
IV. Investment Strategy Comparison: TRX vs CHZ
V. Potential Risk Comparison
VI. Conclusion: Which Is the Better Buy?
VII. FAQ

