SUI vs SHIB: The Battle of Emerging Cryptocurrencies in the Digital Asset Market
Introduction: SUI vs SHIB Investment Comparison
In the cryptocurrency market, the comparison between SUI and SHIB has always been an unavoidable topic for investors. The two not only have significant differences in market cap ranking, application scenarios, and price performance, but also represent different cryptocurrency asset positions.
SUI (SUI): Since its launch, it has gained market recognition for its horizontally scalable Layer 1 blockchain design supporting a wide range of application development with unparalleled speed and low cost.
SHIB (SHIB): Since its inception in 2020, it has been hailed as an experiment in decentralized community building and is one of the most popular meme tokens in the global cryptocurrency market.
This article will comprehensively analyze the investment value comparison between SUI and SHIB, focusing on historical price trends, supply mechanisms, institutional adoption, technological ecosystems, and future predictions, attempting to answer the question that investors are most concerned about:
"Which is the better buy right now?"
I. Price History Comparison and Current Market Status
SUI (Coin A) and SHIB (Coin B) Historical Price Trends
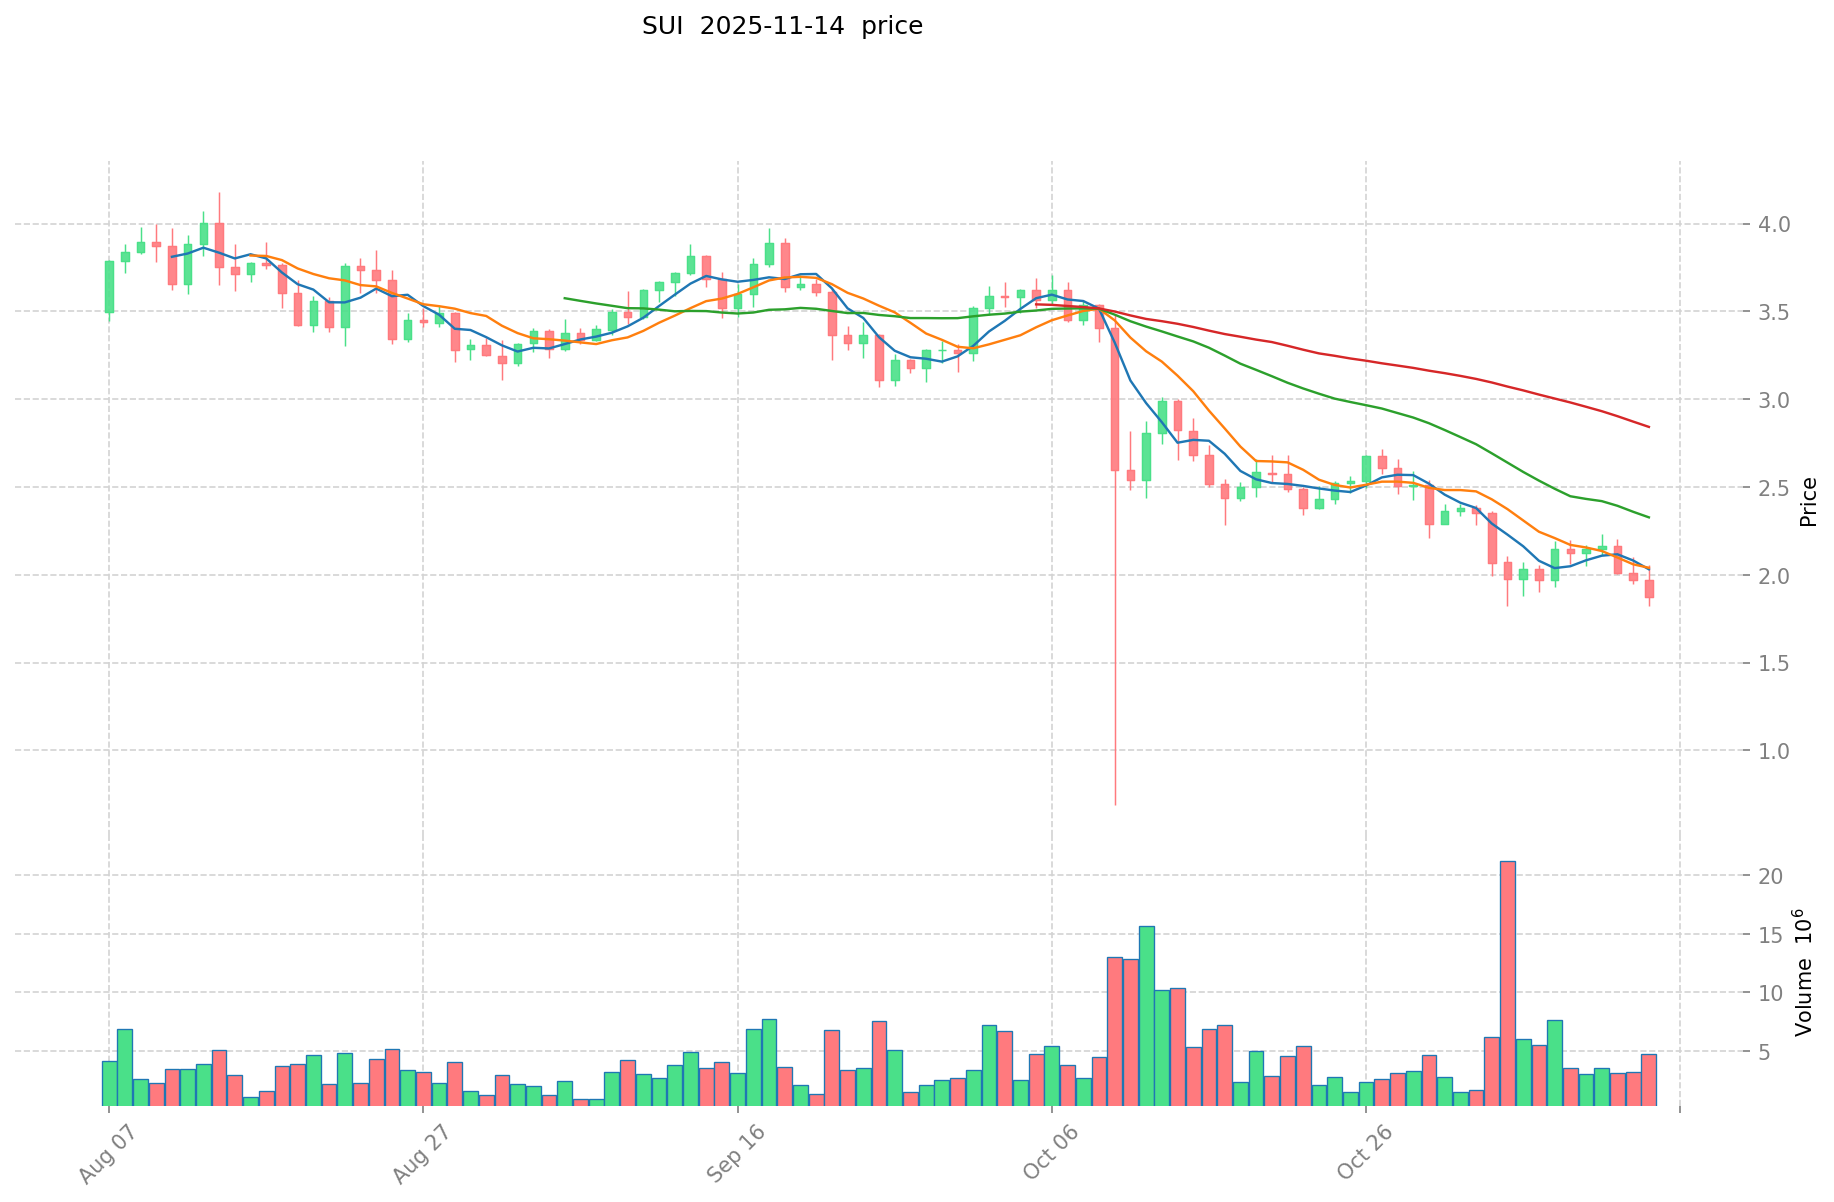
- 2025: SUI reached its all-time high of $5.3674 on January 6, 2025, showing significant growth.
- 2021: SHIB hit its all-time high of $0.00008616 on October 28, 2021, during the meme coin frenzy.
- Comparative analysis: In the current market cycle, SUI has fallen from its high of $5.3674 to $1.8, while SHIB has dropped from $0.00008616 to $0.000009195, showing a more substantial percentage decline for SHIB.
Current Market Situation (2025-11-14)
- SUI current price: $1.8
- SHIB current price: $0.000009195
- 24-hour trading volume: SUI $11,842,595.04 vs SHIB $4,978,463.64
- Market Sentiment Index (Fear & Greed Index): 16 (Extreme Fear)
Click to view real-time prices:
- View SUI current price Market Price
- View SHIB current price Market Price

II. Core Factors Affecting Investment Value of SUI vs SHIB
Supply Mechanisms Comparison (Tokenomics)
- SUI: Fixed total supply of 10 billion tokens with a controlled distribution schedule; approximately 11% in circulation with a deflationary mechanism through transaction fee burns
- SHIB: Initial supply of 1 quadrillion tokens; approximately 549 trillion tokens in circulation with periodic token burning initiatives to reduce supply
- 📌 Historical pattern: Deflationary mechanisms like SUI's fee burn system tend to support long-term price stability while SHIB relies more on community-driven burning events for supply reduction.
Institutional Adoption and Market Applications
- Institutional holdings: SUI has secured backing from major venture capital firms including FTX Ventures, Coinbase Ventures, and Binance Labs, indicating stronger institutional confidence compared to SHIB
- Enterprise adoption: SUI offers more robust enterprise applications through its Move programming language and infrastructure focus, while SHIB's utility remains primarily in trading and speculation
- Regulatory attitudes: Both face varying regulatory scrutiny, with SUI's utility-focused approach potentially providing more regulatory clarity than SHIB's meme coin classification
Technical Development and Ecosystem Building
- SUI technical upgrades: Horizontal scaling capability, parallel transaction processing, and object-centric data model enabling high throughput and low latency; recent implementation of 100x faster object deletion
- SHIB technical development: Development of Shibarium, a Layer-2 solution built on Ethereum to improve transaction speeds and reduce fees; plans for metaverse integration
- Ecosystem comparison: SUI features a robust ecosystem focused on gaming, DeFi and NFTs with over 2 million active addresses, while SHIB has expanded beyond meme status with Shibaswap DEX but maintains limited smart contract functionality
Macroeconomic Factors and Market Cycles
- Performance during inflation: SUI's utility-focused model may provide stronger fundamental backing during inflationary periods, while SHIB historically performs better during risk-on market sentiment
- Monetary policy effects: Both cryptocurrencies show sensitivity to Federal Reserve decisions and interest rate changes, with SHIB displaying higher volatility during policy shifts
- Geopolitical factors: SUI's focus on infrastructure may provide more resilience during geopolitical uncertainty, while SHIB's trading volume tends to be more affected by general market sentiment and retail investor behavior
III. 2025-2030 Price Prediction: SUI vs SHIB
Short-term Prediction (2025)
- SUI: Conservative $1.13 - $1.79 | Optimistic $1.79 - $1.90
- SHIB: Conservative $0.00000889 - $0.00000917 | Optimistic $0.00000917 - $0.0000124
Mid-term Prediction (2027)
- SUI may enter a growth phase, with an estimated price range of $1.38 - $2.22
- SHIB may enter a steady growth phase, with an estimated price range of $0.00000978 - $0.0000122
- Key drivers: Institutional capital inflow, ETF, ecosystem development
Long-term Prediction (2030)
- SUI: Base scenario $2.32 - $2.70 | Optimistic scenario $2.70 - $3.51
- SHIB: Base scenario $0.0000144 - $0.0000159 | Optimistic scenario $0.0000159 - $0.0000196
Disclaimer: This analysis is based on historical data and market projections. Cryptocurrency markets are highly volatile and subject to rapid changes. These predictions should not be considered as financial advice. Always conduct your own research before making investment decisions.
SUI:
| 年份 | 预测最高价 | 预测平均价格 | 预测最低价 | 涨跌幅 |
|---|---|---|---|---|
| 2025 | 1.897718 | 1.7903 | 1.127889 | 0 |
| 2026 | 1.99152972 | 1.844009 | 1.60428783 | 2 |
| 2027 | 2.2246124576 | 1.91776936 | 1.3807939392 | 6 |
| 2028 | 2.858243454144 | 2.0711909088 | 1.946919454272 | 15 |
| 2029 | 2.93301344595168 | 2.464717181472 | 1.87318505791872 | 36 |
| 2030 | 3.508524907825392 | 2.69886531371184 | 2.321024169792182 | 49 |
SHIB:
| 年份 | 预测最高价 | 预测平均价格 | 预测最低价 | 涨跌幅 |
|---|---|---|---|---|
| 2025 | 0.00001237815 | 0.000009169 | 0.00000889393 | 0 |
| 2026 | 0.000011204518 | 0.000010773575 | 0.000005602259 | 17 |
| 2027 | 0.000012197841615 | 0.0000109890465 | 0.000009780251385 | 19 |
| 2028 | 0.000014028067309 | 0.000011593444057 | 0.00000614452535 | 26 |
| 2029 | 0.000019088025968 | 0.000012810755683 | 0.000006533485398 | 39 |
| 2030 | 0.000019617750715 | 0.000015949390826 | 0.000014354451743 | 73 |
IV. Investment Strategy Comparison: SUI vs SHIB
Long-term vs Short-term Investment Strategies
- SUI: Suitable for investors focused on ecosystem potential and utility-driven growth
- SHIB: Suitable for investors seeking high-risk, high-reward opportunities and community-driven projects
Risk Management and Asset Allocation
- Conservative investors: SUI: 70% vs SHIB: 30%
- Aggressive investors: SUI: 40% vs SHIB: 60%
- Hedging tools: Stablecoin allocation, options, cross-currency portfolios
V. Potential Risk Comparison
Market Risks
- SUI: Volatility due to early-stage development and market sentiment shifts
- SHIB: High susceptibility to market speculation and meme-driven price swings
Technical Risks
- SUI: Scalability challenges, network stability during high traffic
- SHIB: Limited smart contract functionality, dependency on Ethereum network
Regulatory Risks
- Global regulatory policies may have differing impacts, with SUI potentially facing less scrutiny due to its utility focus compared to SHIB's meme coin status
VI. Conclusion: Which Is the Better Buy?
📌 Investment Value Summary:
- SUI advantages: Strong institutional backing, robust technical infrastructure, and growing ecosystem
- SHIB advantages: Massive community support, brand recognition, and potential for rapid price movements
✅ Investment Advice:
- New investors: Consider a higher allocation to SUI for its stronger fundamentals and long-term potential
- Experienced investors: Balanced approach with a slight tilt towards SUI, while capitalizing on SHIB's volatility for short-term trades
- Institutional investors: Focus on SUI for its infrastructure play and potential for enterprise adoption
⚠️ Risk Warning: The cryptocurrency market is highly volatile. This article does not constitute investment advice. None
VII. FAQ
Q1: What are the main differences between SUI and SHIB? A: SUI is a Layer 1 blockchain focused on scalability and application development, while SHIB is a meme token with a large community. SUI has stronger institutional backing and technical infrastructure, whereas SHIB relies more on community-driven initiatives and brand recognition.
Q2: Which coin has performed better historically? A: SUI reached its all-time high of $5.3674 in January 2025, while SHIB hit its peak of $0.00008616 in October 2021. SUI has shown more stability in recent market cycles, with SHIB experiencing a larger percentage decline from its all-time high.
Q3: How do the supply mechanisms of SUI and SHIB differ? A: SUI has a fixed total supply of 10 billion tokens with a controlled distribution and deflationary mechanism through transaction fee burns. SHIB started with 1 quadrillion tokens and relies on periodic community-driven burning events to reduce supply.
Q4: Which coin is more suitable for long-term investment? A: SUI is generally considered more suitable for long-term investment due to its focus on ecosystem development, utility-driven growth, and stronger institutional backing. However, individual investment decisions should be based on personal risk tolerance and investment goals.
Q5: What are the main risks associated with investing in SUI and SHIB? A: For SUI, risks include volatility due to early-stage development and potential scalability challenges. SHIB faces risks from high market speculation, limited smart contract functionality, and regulatory scrutiny due to its meme coin status.
Q6: How do institutional investors view SUI compared to SHIB? A: Institutional investors generally show more confidence in SUI due to its robust technical infrastructure and potential for enterprise adoption. SHIB, while popular among retail investors, has less institutional backing.
Q7: What are the price predictions for SUI and SHIB by 2030? A: By 2030, SUI is predicted to reach between $2.32 and $3.51 in optimistic scenarios. SHIB is projected to be between $0.0000144 and $0.0000196. However, these predictions are speculative and subject to market volatility.
Share
Content
Introduction: SUI vs SHIB Investment Comparison
I. Price History Comparison and Current Market Status
II. Core Factors Affecting Investment Value of SUI vs SHIB
III. 2025-2030 Price Prediction: SUI vs SHIB
IV. Investment Strategy Comparison: SUI vs SHIB
V. Potential Risk Comparison
VI. Conclusion: Which Is the Better Buy?
VII. FAQ

