SPX vs XTZ: Comparing the Performance of S&P 500 Index and Tezos in Volatile Markets
Introduction: SPX vs XTZ Investment Comparison
In the cryptocurrency market, the comparison between SPX and XTZ has always been a topic that investors can't avoid. The two not only have significant differences in market cap ranking, application scenarios, and price performance, but also represent different positioning in crypto assets.
SPX6900 (SPX): Launched in 2023, it has gained market recognition as a valueless meme cryptocurrency token making a parody of traditional finance.
Tezos (XTZ): Since its introduction in 2017, it has been hailed as a decentralized blockchain that simplifies formal verification, representing one of the most traded and highest market cap cryptocurrencies globally.
This article will comprehensively analyze the investment value comparison between SPX and XTZ, focusing on historical price trends, supply mechanisms, institutional adoption, technical ecosystems, and future predictions, attempting to answer the question that investors care about most:
"Which is the better buy right now?"
I. Price History Comparison and Current Market Status
SPX and XTZ Historical Price Trends
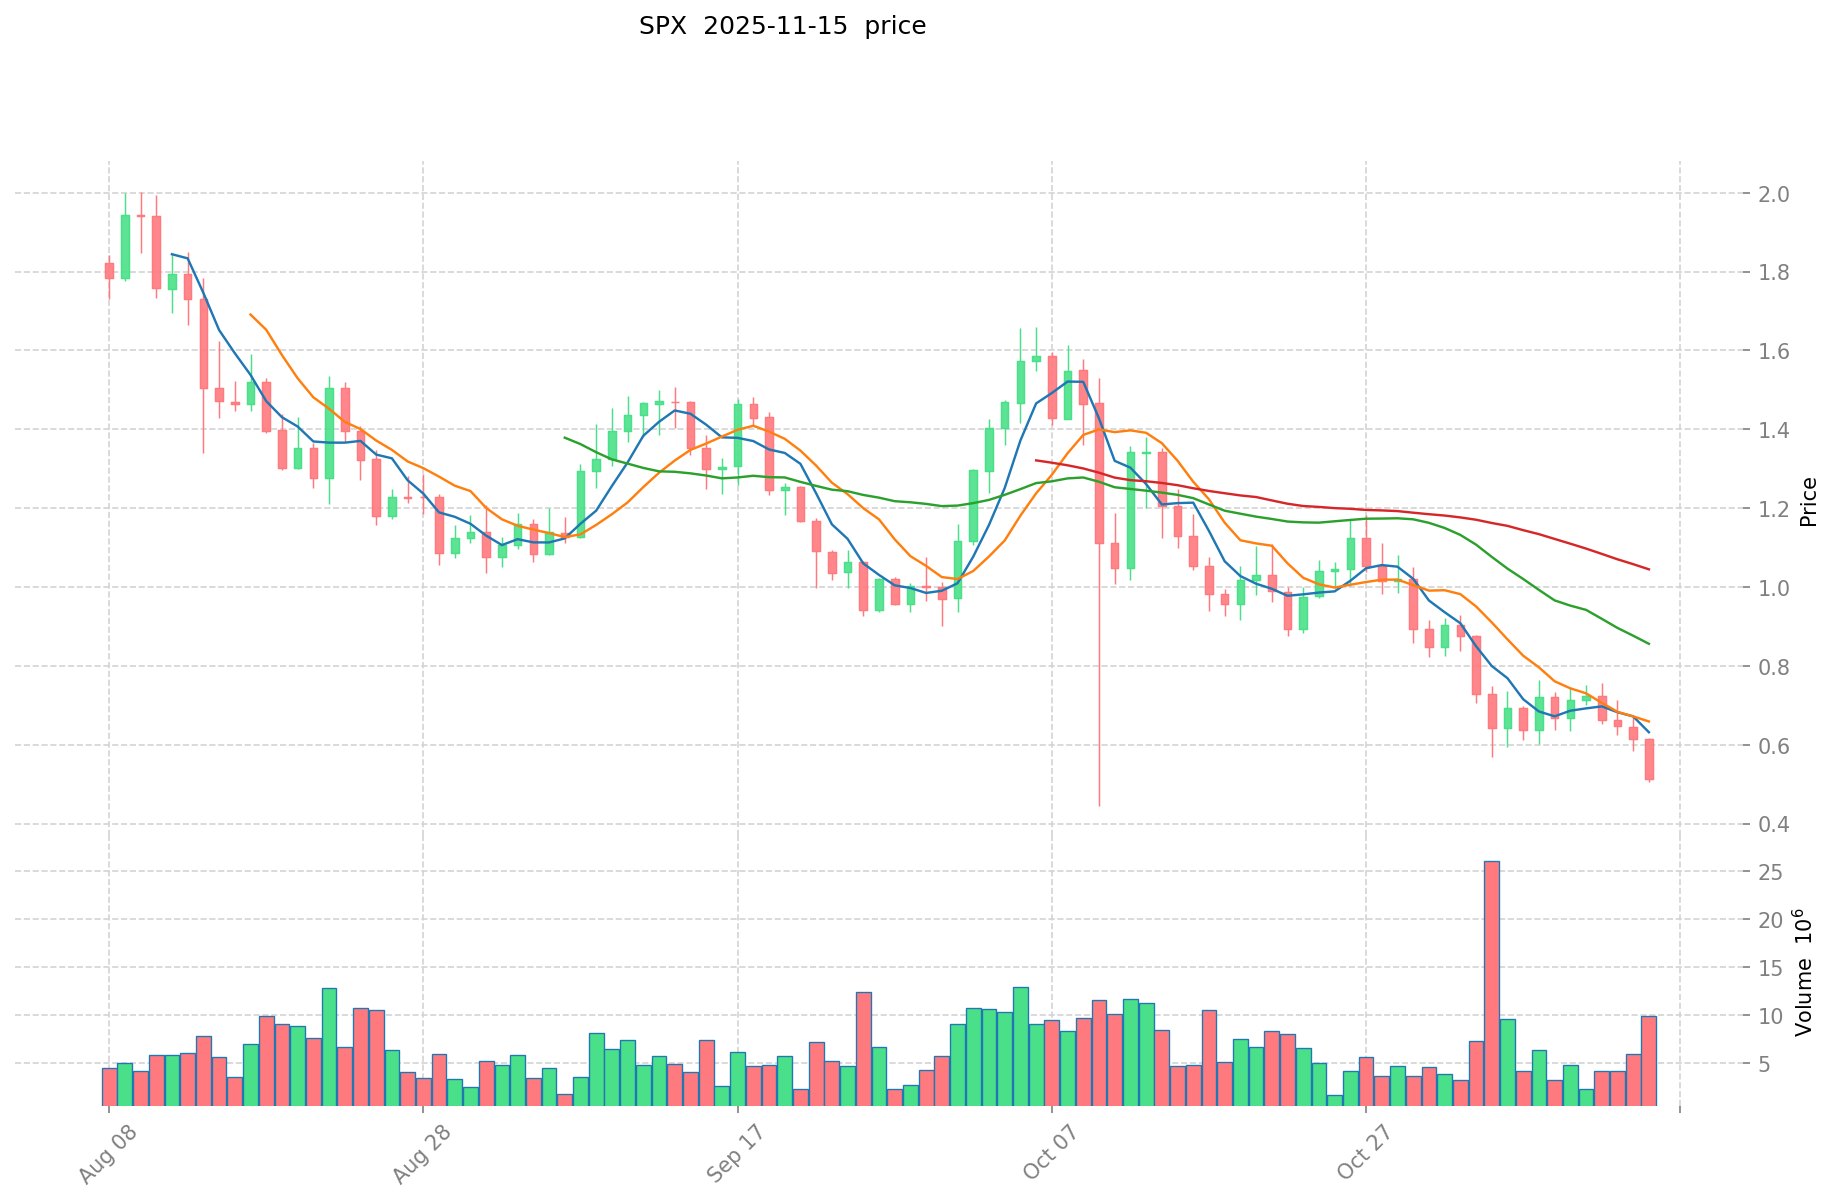
- 2025: SPX reached its all-time high of $2.2811 on July 28, 2025.
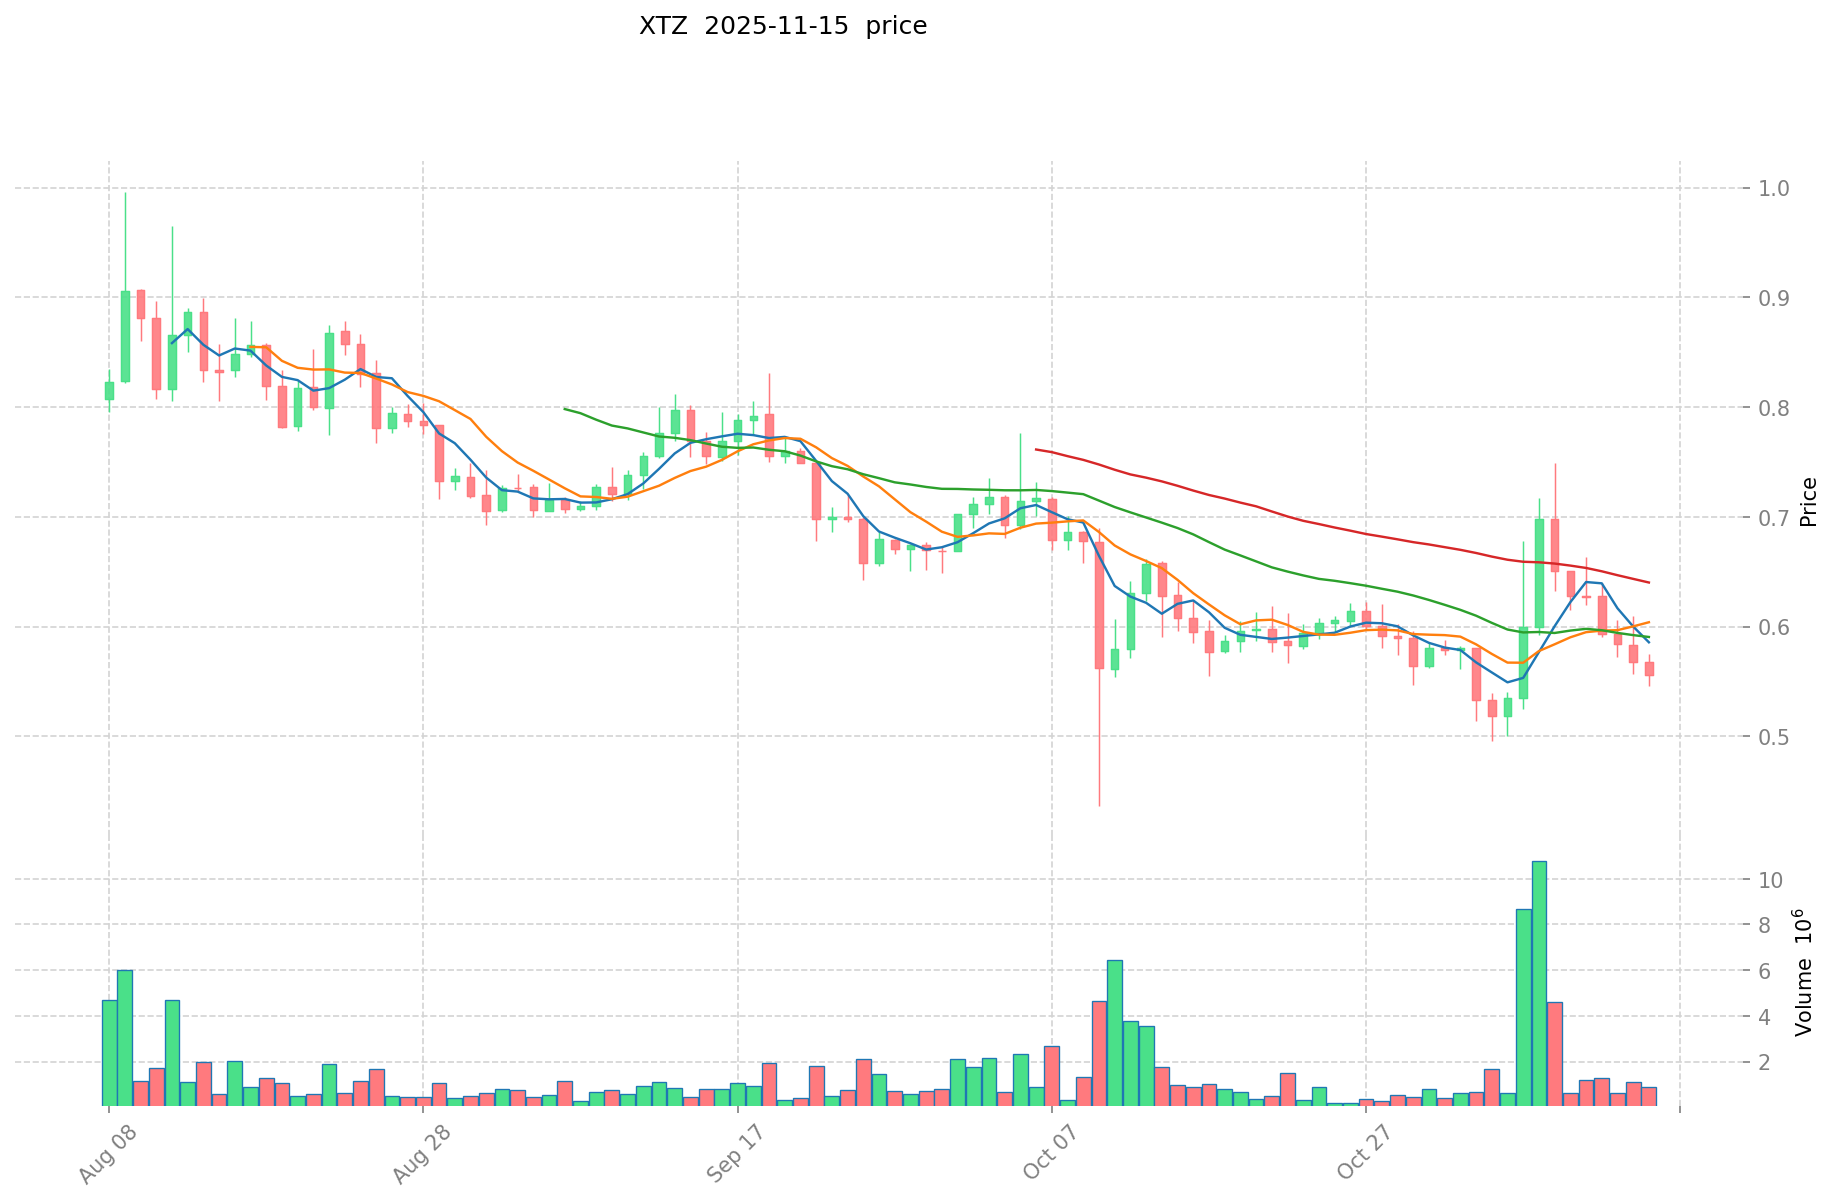
- 2025: XTZ experienced a significant drop, with its price declining by 18.47% over the past year.
- Comparative analysis: In the current market cycle, SPX has fallen from its high of $2.2811 to a current price of $0.5175, while XTZ has shown relatively more stability, currently trading at $0.577.
Current Market Situation (2025-11-15)
- SPX current price: $0.5175
- XTZ current price: $0.577
- 24-hour trading volume: SPX $5,109,471.13 vs XTZ $422,261.09
- Market Sentiment Index (Fear & Greed Index): 10 (Extreme Fear)
Click to view real-time prices:
- View SPX current price Market Price
- View XTZ current price Market Price
II. Core Factors Impacting SPX vs XTZ Investment Value
Supply Mechanism Comparison (Tokenomics)
- SPX: Fixed maximum supply of 21 million coins, creating scarcity in the market
- XTZ: Inflationary model with no maximum cap, new coins are created through baking (Tezos' staking mechanism)
- 📌 Historical Pattern: Fixed supply assets like SPX tend to experience more pronounced price cycles during bull markets, while XTZ's inflationary model provides consistent rewards for stakers but may create sell pressure.
Institutional Adoption and Market Applications
- Institutional Holdings: SPX has significantly higher institutional adoption with major corporations like MicroStrategy and financial institutions adding it to their balance sheets
- Enterprise Adoption: SPX is increasingly used for treasury management and as a settlement layer, while XTZ has gained traction in the digital art market and enterprise blockchain solutions
- Regulatory Landscape: SPX faces varying regulatory approaches across jurisdictions but has achieved legal tender status in countries like El Salvador; XTZ generally faces fewer regulatory hurdles due to its proof-of-stake consensus mechanism
Technical Development and Ecosystem Building
- SPX Technical Upgrades: Layer 2 scaling solutions and Lightning Network development for improving transaction throughput and reducing fees
- XTZ Technical Development: Regular protocol upgrades through on-chain governance, including smart contract optimization and privacy features
- Ecosystem Comparison: SPX ecosystem primarily focused on store of value and payment applications, while XTZ has more diverse applications in DeFi, NFTs, and enterprise blockchain solutions with formal verification features
Macroeconomic Factors and Market Cycles
- Performance in Inflationary Environments: SPX has demonstrated stronger anti-inflation characteristics, often positioned as "digital gold"
- Monetary Policy Impact: Both assets show sensitivity to interest rate changes and USD strength, though SPX tends to have higher correlation with traditional risk assets
- Geopolitical Factors: SPX has seen increased adoption in countries experiencing currency crises or capital controls, while XTZ adoption is more evenly distributed geographically
III. 2025-2030 Price Prediction: SPX vs XTZ
Short-term Prediction (2025)
- SPX: Conservative $0.276766 - $0.5222 | Optimistic $0.5222 - $0.720636
- XTZ: Conservative $0.322336 - $0.5756 | Optimistic $0.5756 - $0.771304
Mid-term Prediction (2027)
- SPX may enter a growth phase, with estimated prices $0.5832629348 - $0.8902434268
- XTZ may enter a growth phase, with estimated prices $0.6041201166 - $0.9257944644
- Key drivers: Institutional capital inflow, ETFs, ecosystem development
Long-term Prediction (2030)
- SPX: Base scenario $0.82595133583457 - $1.04550802004376 | Optimistic scenario $1.04550802004376 - $1.181424062649448
- XTZ: Base scenario $0.926086032774846 - $1.304346525034995 | Optimistic scenario $1.304346525034995 - $1.552172364791644
Disclaimer: The above predictions are based on historical data and market analysis. Cryptocurrency markets are highly volatile and subject to rapid changes. These predictions should not be considered as financial advice. Always conduct your own research before making investment decisions.
SPX:
| 年份 | 预测最高价 | 预测平均价格 | 预测最低价 | 涨跌幅 |
|---|---|---|---|---|
| 2025 | 0.720636 | 0.5222 | 0.276766 | 0 |
| 2026 | 0.91348446 | 0.621418 | 0.51577694 | 20 |
| 2027 | 0.8902434268 | 0.76745123 | 0.5832629348 | 48 |
| 2028 | 1.143809313192 | 0.8288473284 | 0.66307786272 | 60 |
| 2029 | 1.10468771929152 | 0.986328320796 | 0.739746240597 | 90 |
| 2030 | 1.181424062649448 | 1.04550802004376 | 0.82595133583457 | 102 |
XTZ:
| 年份 | 预测最高价 | 预测平均价格 | 预测最低价 | 涨跌幅 |
|---|---|---|---|---|
| 2025 | 0.771304 | 0.5756 | 0.322336 | 0 |
| 2026 | 0.89569116 | 0.673452 | 0.61957584 | 16 |
| 2027 | 0.9257944644 | 0.78457158 | 0.6041201166 | 35 |
| 2028 | 1.257119042634 | 0.8551830222 | 0.64138726665 | 48 |
| 2029 | 1.55254201765299 | 1.056151032417 | 1.02446650144449 | 83 |
| 2030 | 1.552172364791644 | 1.304346525034995 | 0.926086032774846 | 126 |
IV. Investment Strategy Comparison: SPX vs XTZ
Long-term vs Short-term Investment Strategy
- SPX: Suitable for investors focused on scarcity and potential as a store of value
- XTZ: Suitable for investors interested in ecosystem development and staking rewards
Risk Management and Asset Allocation
- Conservative investors: SPX: 30% vs XTZ: 70%
- Aggressive investors: SPX: 60% vs XTZ: 40%
- Hedging tools: Stablecoin allocation, options, cross-currency portfolio
V. Potential Risk Comparison
Market Risk
- SPX: Higher volatility and susceptibility to market sentiment
- XTZ: Relatively lower liquidity and trading volume
Technical Risk
- SPX: Scalability issues, network congestion during high demand
- XTZ: Potential vulnerabilities in smart contract implementations
Regulatory Risk
- Global regulatory policies may have differing impacts on both assets, with SPX potentially facing more scrutiny due to its higher profile
VI. Conclusion: Which Is the Better Buy?
📌 Investment Value Summary:
- SPX advantages: Fixed supply, higher institutional adoption, strong brand recognition
- XTZ advantages: Diverse ecosystem applications, on-chain governance, staking rewards
✅ Investment Advice:
- New investors: Consider a balanced approach with a slight bias towards XTZ for lower volatility
- Experienced investors: Allocate based on risk tolerance, potentially higher allocation to SPX for growth potential
- Institutional investors: Evaluate SPX for treasury diversification, XTZ for blockchain solution implementations
⚠️ Risk Warning: Cryptocurrency markets are highly volatile. This article does not constitute investment advice. None
VII. FAQ
Q1: What are the main differences between SPX and XTZ in terms of supply mechanism? A: SPX has a fixed maximum supply of 21 million coins, creating scarcity in the market. XTZ, on the other hand, has an inflationary model with no maximum cap, where new coins are created through baking (Tezos' staking mechanism).
Q2: How do SPX and XTZ compare in terms of institutional adoption? A: SPX has significantly higher institutional adoption, with major corporations like MicroStrategy and financial institutions adding it to their balance sheets. XTZ has gained traction in specific areas such as the digital art market and enterprise blockchain solutions.
Q3: What are the key technical developments for SPX and XTZ? A: SPX is focusing on Layer 2 scaling solutions and Lightning Network development to improve transaction throughput and reduce fees. XTZ regularly undergoes protocol upgrades through on-chain governance, including smart contract optimization and privacy features.
Q4: How do SPX and XTZ perform in inflationary environments? A: SPX has demonstrated stronger anti-inflation characteristics and is often positioned as "digital gold." XTZ's performance in inflationary environments is less pronounced.
Q5: What are the long-term price predictions for SPX and XTZ by 2030? A: For SPX, the base scenario predicts a range of $0.82595133583457 - $1.04550802004376, with an optimistic scenario of $1.04550802004376 - $1.181424062649448. For XTZ, the base scenario predicts a range of $0.926086032774846 - $1.304346525034995, with an optimistic scenario of $1.304346525034995 - $1.552172364791644.
Q6: How should investors allocate their portfolio between SPX and XTZ? A: Conservative investors might consider allocating 30% to SPX and 70% to XTZ, while aggressive investors might opt for 60% SPX and 40% XTZ. However, individual allocations should be based on personal risk tolerance and investment goals.
Q7: What are the main risks associated with investing in SPX and XTZ? A: SPX faces higher volatility and susceptibility to market sentiment, as well as potential scalability issues. XTZ has relatively lower liquidity and trading volume, and potential vulnerabilities in smart contract implementations. Both assets are subject to regulatory risks, with SPX potentially facing more scrutiny due to its higher profile.
Share
Content
Introduction: SPX vs XTZ Investment Comparison
I. Price History Comparison and Current Market Status
II. Core Factors Impacting SPX vs XTZ Investment Value
III. 2025-2030 Price Prediction: SPX vs XTZ
IV. Investment Strategy Comparison: SPX vs XTZ
V. Potential Risk Comparison
VI. Conclusion: Which Is the Better Buy?
VII. FAQ

