SPK vs QNT: Comparing Two Innovative Blockchain Solutions for Enterprise Adoption
Introduction: SPK vs QNT Investment Comparison
In the cryptocurrency market, the comparison between Spark (SPK) and Quant (QNT) has been an unavoidable topic for investors. The two not only show significant differences in market cap ranking, application scenarios, and price performance but also represent distinct positioning in the crypto asset space.
Spark (SPK): Since its launch, it has gained market recognition as an onchain capital allocator, managing $3.95B across DeFi, CeFi, and RWA.
Quant (QNT): Introduced in 2018, it has been hailed as a technology provider enabling trusted digital interaction, recognized for solving interoperability through its global blockchain operating system, Overledger.
This article will comprehensively analyze the investment value comparison between SPK and QNT, focusing on historical price trends, supply mechanisms, institutional adoption, technological ecosystems, and future predictions, attempting to answer the question investors care about most:
"Which is the better buy right now?"
I. Price History Comparison and Current Market Status
SPK (Coin A) and QNT (Coin B) Historical Price Trends
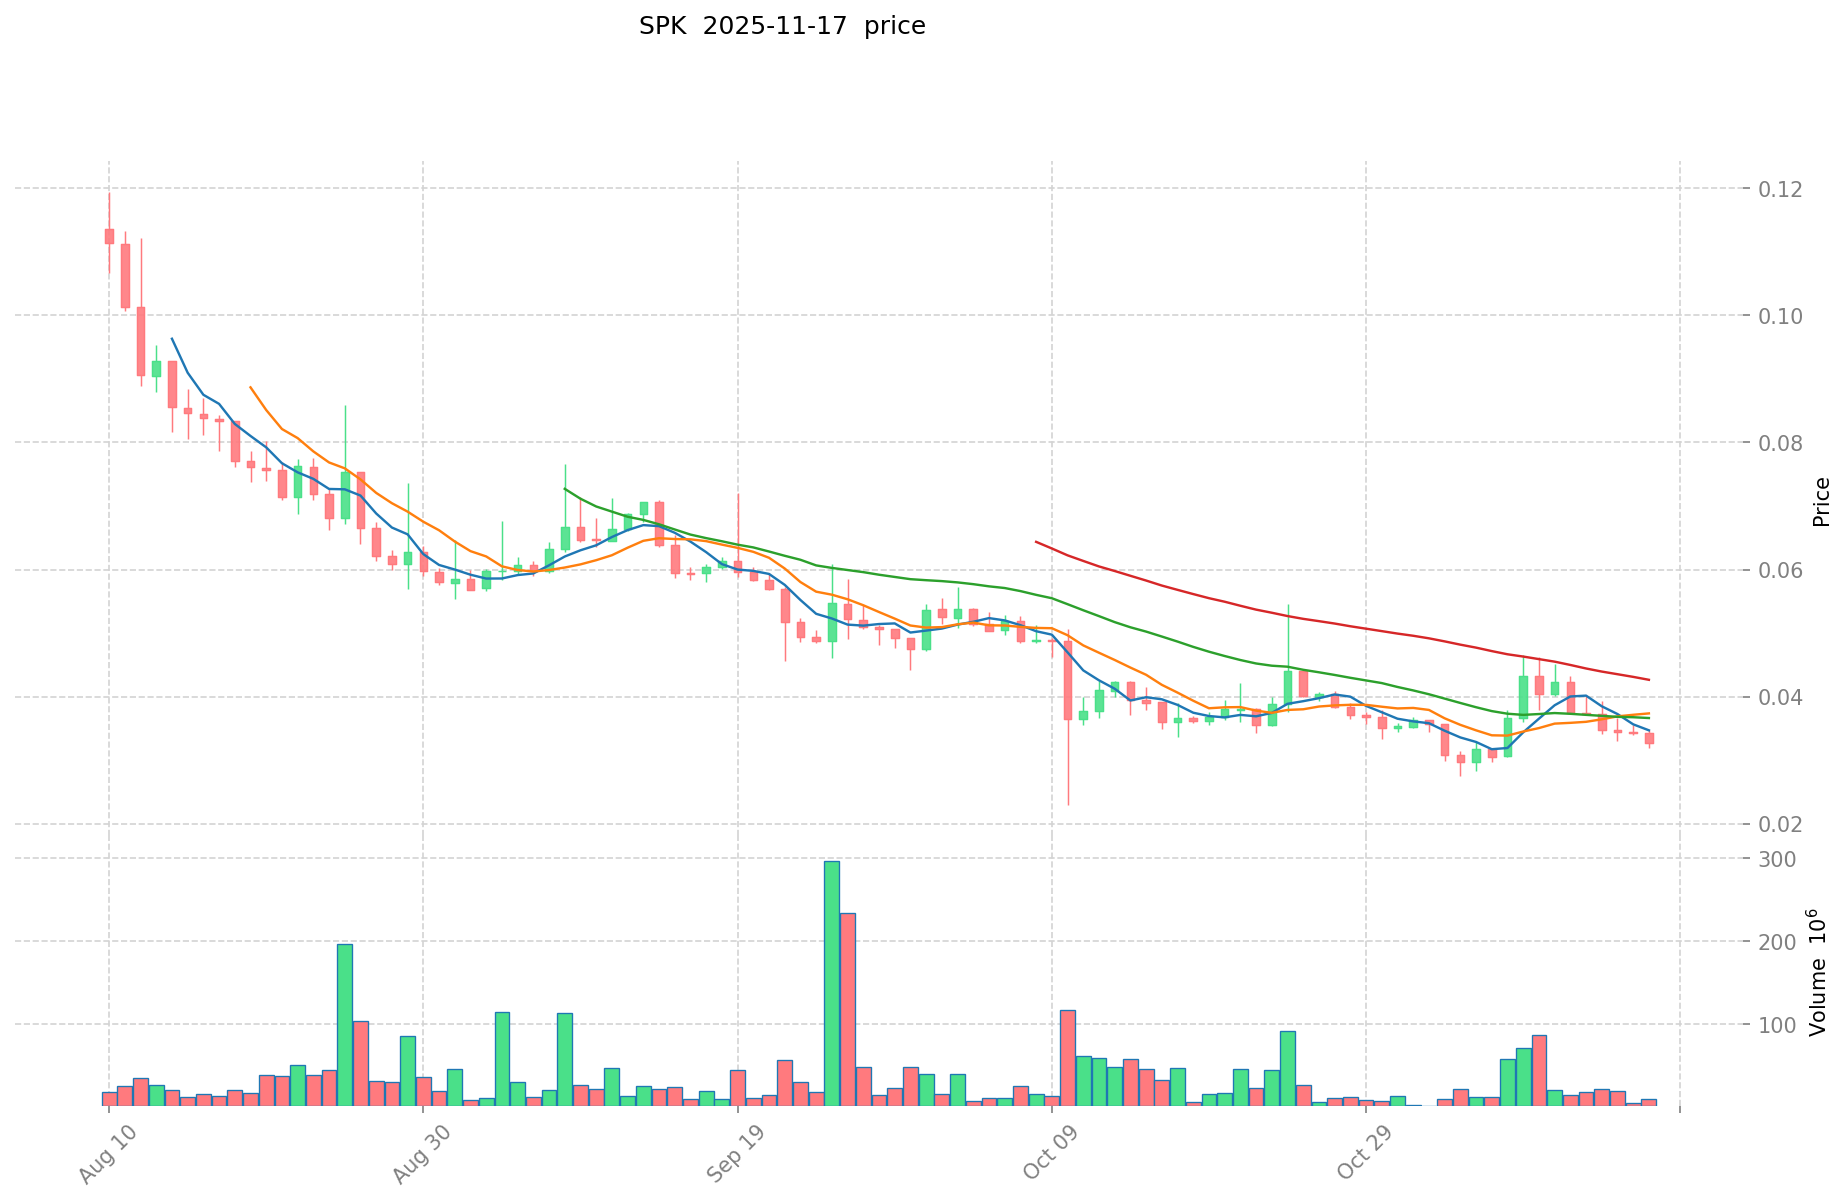
- 2025: SPK reached its all-time high of $0.19866 on July 23, 2025, and its all-time low of $0.02286 on October 10, 2025.
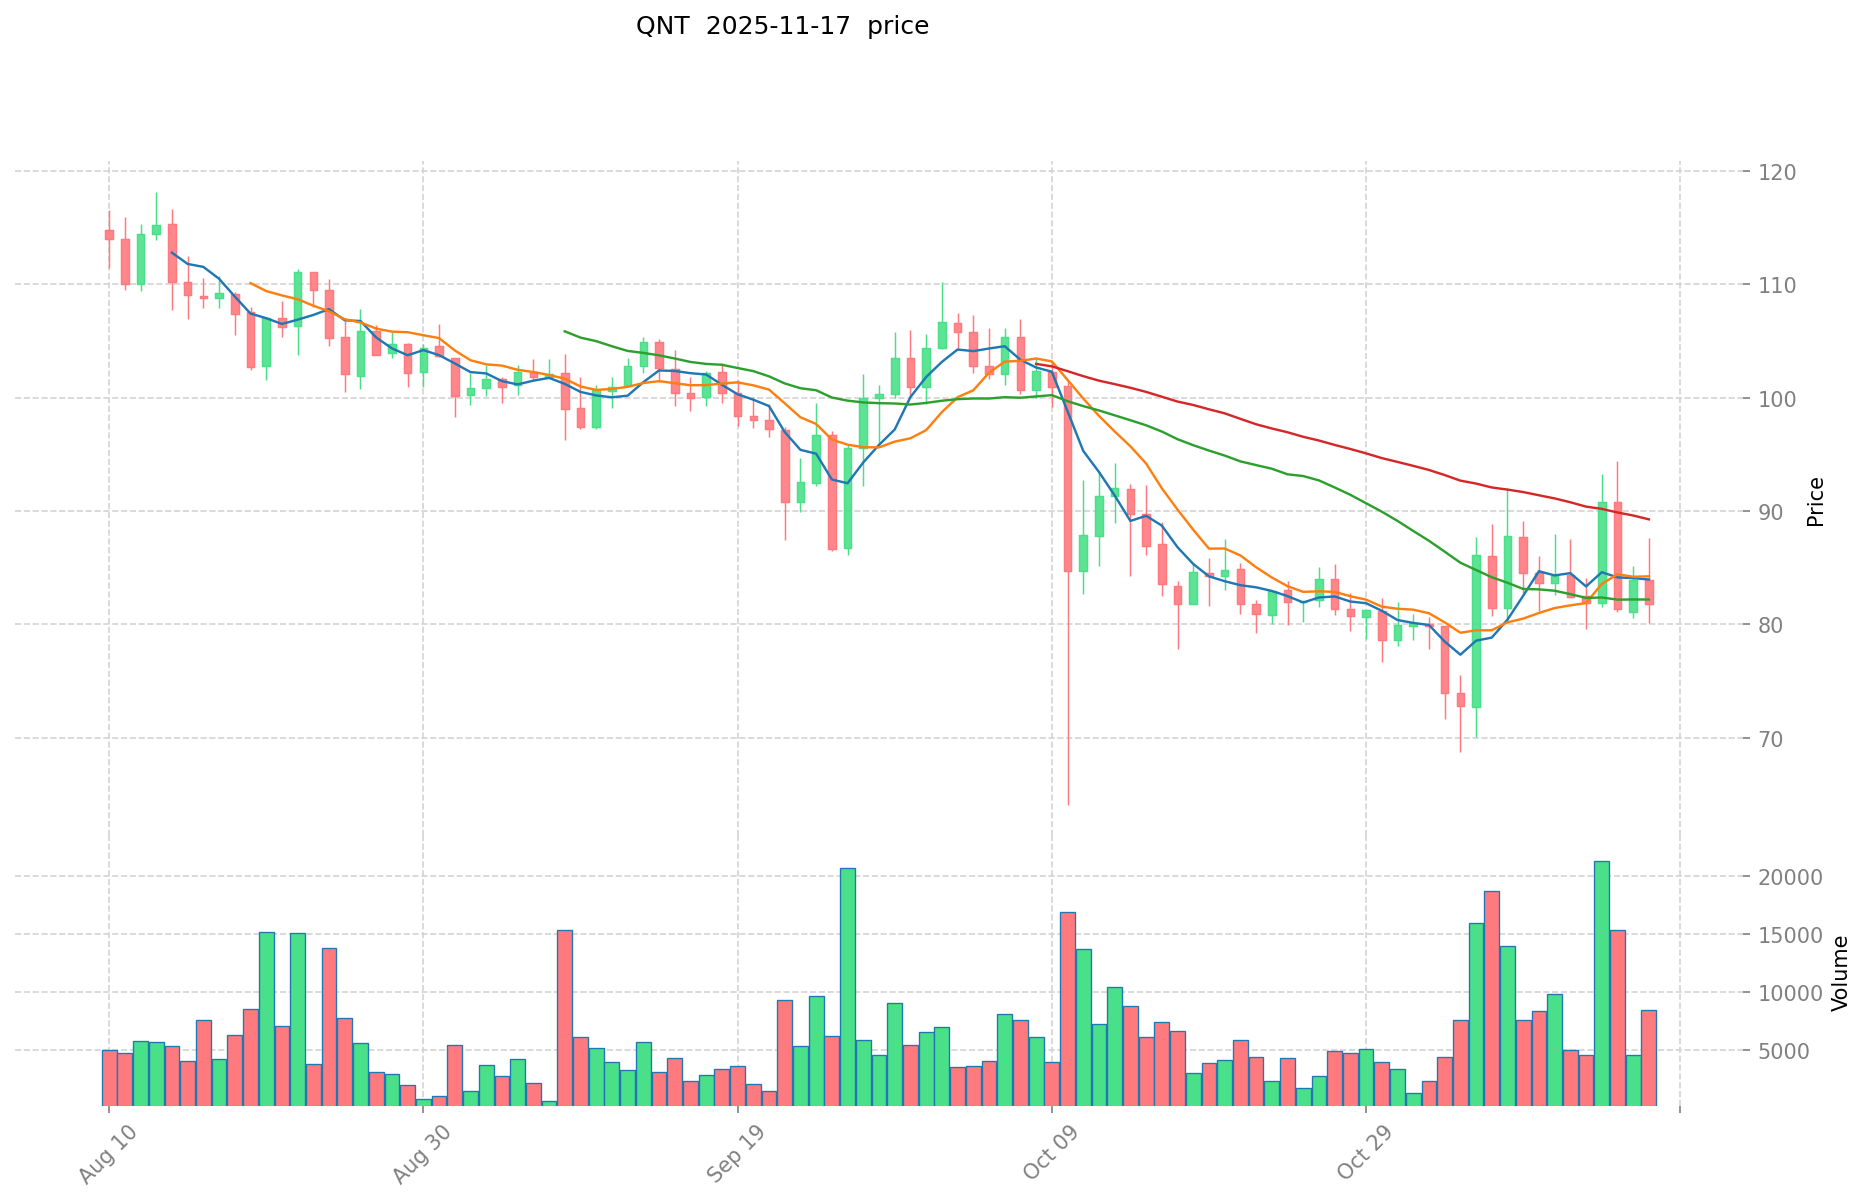
- 2021: QNT achieved its all-time high of $427.42 on September 11, 2021.
- Comparative analysis: In recent market cycles, SPK has experienced significant volatility, while QNT has shown a longer price history with its all-time high dating back to 2021.
Current Market Situation (2025-11-17)
- SPK current price: $0.0332
- QNT current price: $82.06
- 24-hour trading volume: SPK $355,440.17 vs QNT $584,291.93
- Market Sentiment Index (Fear & Greed Index): 10 (Extreme Fear)
Click to view real-time prices:
- View SPK current price Market Price
- View QNT current price Market Price
II. Core Factors Affecting Investment Value of SPK vs QNT
Supply Mechanisms Comparison (Tokenomics)
- SPK: Fixed supply of 10 billion tokens with a portion locked for ecosystem development
- QNT: Total fixed supply of 14.6 million tokens with deflationary mechanism through token burning
- 📌 Historical Pattern: Limited supply cryptocurrencies like QNT tend to experience more price volatility during market cycles, while fixed larger supplies like SPK typically show more stability but potentially less dramatic growth.
Institutional Adoption and Market Applications
- Institutional Holdings: QNT has gained more institutional interest due to its enterprise-focused Overledger network and partnerships with major financial institutions
- Enterprise Adoption: QNT has stronger positioning in interoperability solutions for financial institutions, while SPK focuses more on retail payment applications
- Regulatory Attitudes: QNT generally benefits from more favorable regulatory perception in Western markets due to its enterprise compliance focus, while SPK has stronger positioning in emerging markets
Technical Development and Ecosystem Building
- SPK Technical Upgrades: Focus on scalability improvements and payment processing speed optimization
- QNT Technical Development: Continued enhancement of the Overledger OS for enterprise blockchain interoperability and financial network integration
- Ecosystem Comparison: QNT has stronger enterprise integration capabilities and financial sector applications, while SPK has been developing more consumer-facing payment solutions
Macroeconomic Environment and Market Cycles
- Inflation Performance: QNT's limited supply model potentially provides better inflation resistance during economic uncertainty
- Macroeconomic Monetary Policy: Both tokens show sensitivity to Federal Reserve decisions, with QNT demonstrating more correlation to traditional markets due to institutional adoption
- Geopolitical Factors: QNT's focus on institutional cross-border settlement provides potential advantages during periods of increased global settlement demand
III. 2025-2030 Price Prediction: SPK vs QNT
Short-term Prediction (2025)
- SPK: Conservative $0.0172744 - $0.03322 | Optimistic $0.03322 - $0.0352132
- QNT: Conservative $72.0456 - $81.87 | Optimistic $81.87 - $94.1505
Mid-term Prediction (2027)
- SPK may enter a growth phase, with estimated prices $0.0275785796 - $0.04412572736
- QNT may enter a bullish market, with estimated prices $76.6349251875 - $140.02430775
- Key drivers: Institutional capital inflow, ETF, ecosystem development
Long-term Prediction (2030)
- SPK: Base scenario $0.057382262645004 - $0.084351926088155 | Optimistic scenario $0.084351926088155+
- QNT: Base scenario $149.0814205749375 - $159.517120015183125 | Optimistic scenario $159.517120015183125+
Disclaimer: This information is for educational purposes only and should not be considered as financial advice. Cryptocurrency markets are highly volatile and unpredictable. Always conduct your own research before making any investment decisions.
SPK:
| 年份 | 预测最高价 | 预测平均价格 | 预测最低价 | 涨跌幅 |
|---|---|---|---|---|
| 2025 | 0.0352132 | 0.03322 | 0.0172744 | 0 |
| 2026 | 0.050640568 | 0.0342166 | 0.018134798 | 3 |
| 2027 | 0.04412572736 | 0.042428584 | 0.0275785796 | 27 |
| 2028 | 0.0644829619632 | 0.04327715568 | 0.0285629227488 | 30 |
| 2029 | 0.060884466468408 | 0.0538800588216 | 0.043642847645496 | 62 |
| 2030 | 0.084351926088155 | 0.057382262645004 | 0.040741406477952 | 72 |
QNT:
| 年份 | 预测最高价 | 预测平均价格 | 预测最低价 | 涨跌幅 |
|---|---|---|---|---|
| 2025 | 94.1505 | 81.87 | 72.0456 | 0 |
| 2026 | 101.2117875 | 88.01025 | 56.32656 | 7 |
| 2027 | 140.02430775 | 94.61101875 | 76.6349251875 | 15 |
| 2028 | 141.9543725325 | 117.31766325 | 77.429657745 | 43 |
| 2029 | 168.526823258625 | 129.63601789125 | 106.301534670825 | 58 |
| 2030 | 159.517120015183125 | 149.0814205749375 | 99.884551785208125 | 81 |
IV. Investment Strategy Comparison: SPK vs QNT
Long-term vs Short-term Investment Strategies
- SPK: Suitable for investors focused on payment scenarios and ecosystem potential
- QNT: Suitable for investors seeking stability and inflation-resistant properties
Risk Management and Asset Allocation
- Conservative investors: SPK: 30% vs QNT: 70%
- Aggressive investors: SPK: 60% vs QNT: 40%
- Hedging tools: Stablecoin allocation, options, cross-currency portfolios
V. Potential Risk Comparison
Market Risk
- SPK: Higher volatility due to larger supply and focus on retail payments
- QNT: Potential overvaluation risk due to institutional hype
Technical Risk
- SPK: Scalability, network stability
- QNT: Hash power concentration, security vulnerabilities
Regulatory Risk
- Global regulatory policies may have different impacts on both tokens
VI. Conclusion: Which Is the Better Buy?
📌 Investment Value Summary:
- SPK advantages: Focus on retail payment applications, potential for growth in emerging markets
- QNT advantages: Strong institutional adoption, enterprise-focused interoperability solutions
✅ Investment Advice:
- Novice investors: Consider a balanced approach with a slight preference for QNT due to its institutional backing
- Experienced investors: Diversify between both tokens based on risk tolerance and market outlook
- Institutional investors: QNT may be more attractive due to its enterprise focus and regulatory compliance
⚠️ Risk Warning: The cryptocurrency market is highly volatile. This article does not constitute investment advice. None
VII. FAQ
Q1: What are the main differences between SPK and QNT? A: SPK focuses on retail payment applications and has a larger fixed supply of 10 billion tokens. QNT is enterprise-focused, has a smaller fixed supply of 14.6 million tokens, and offers interoperability solutions through its Overledger network.
Q2: Which token has shown better price performance historically? A: QNT has shown a longer price history with its all-time high of $427.42 in September 2021. SPK, being newer, reached its all-time high of $0.19866 in July 2025 but has experienced significant volatility.
Q3: How do institutional adoption rates compare between SPK and QNT? A: QNT has gained more institutional interest due to its enterprise-focused Overledger network and partnerships with major financial institutions. SPK has stronger positioning in emerging markets and retail payment applications.
Q4: What are the key factors affecting the investment value of SPK and QNT? A: Key factors include supply mechanisms, institutional adoption, technical development, ecosystem building, and macroeconomic environment. QNT's limited supply and institutional focus may provide better inflation resistance, while SPK's larger supply might offer more stability.
Q5: How do the 2030 price predictions compare for SPK and QNT? A: For SPK, the base scenario predicts $0.057382262645004 - $0.084351926088155, with an optimistic scenario above $0.084351926088155. For QNT, the base scenario predicts $149.0814205749375 - $159.517120015183125, with an optimistic scenario above $159.517120015183125.
Q6: What investment strategies are recommended for SPK and QNT? A: For conservative investors, a 30% SPK to 70% QNT allocation is suggested. For aggressive investors, a 60% SPK to 40% QNT allocation is recommended. Diversification and risk management through stablecoins, options, and cross-currency portfolios are advised.
Q7: Which token might be considered a better buy overall? A: The better buy depends on the investor's profile. QNT may be more attractive for institutional investors and those seeking stability due to its enterprise focus and regulatory compliance. SPK might appeal to investors interested in retail payment solutions and emerging markets. A balanced approach is recommended for novice investors, while experienced investors should diversify based on risk tolerance and market outlook.
Share
Content
Introduction: SPK vs QNT Investment Comparison
I. Price History Comparison and Current Market Status
II. Core Factors Affecting Investment Value of SPK vs QNT
III. 2025-2030 Price Prediction: SPK vs QNT
IV. Investment Strategy Comparison: SPK vs QNT
V. Potential Risk Comparison
VI. Conclusion: Which Is the Better Buy?
VII. FAQ

