SOLO vs GMX: The Battle of Decentralized Perpetual Exchanges in the DeFi Arena
Introduction: SOLO vs GMX Investment Comparison
In the cryptocurrency market, the comparison between Sologenic (SOLO) vs GMX (GMX) has always been a topic that investors cannot ignore. The two not only have significant differences in market cap ranking, application scenarios, and price performance, but also represent different positioning in the crypto asset space.
Sologenic (SOLO): Since its launch, it has gained market recognition for enabling trading and transfers between cryptocurrencies and non-blockchain assets, such as stocks and funds from over 30 global stock exchanges.
GMX (GMX): Established as a decentralized perpetual exchange, it serves as a utility and governance token while also accruing 30% of the platform's generated fees.
This article will provide a comprehensive analysis of the investment value comparison between SOLO and GMX, focusing on historical price trends, supply mechanisms, institutional adoption, technological ecosystems, and future predictions, attempting to answer the question most concerning to investors:
"Which is the better buy right now?"
I. Price History Comparison and Current Market Status
SOLO (Coin A) and GMX (Coin B) Historical Price Trends
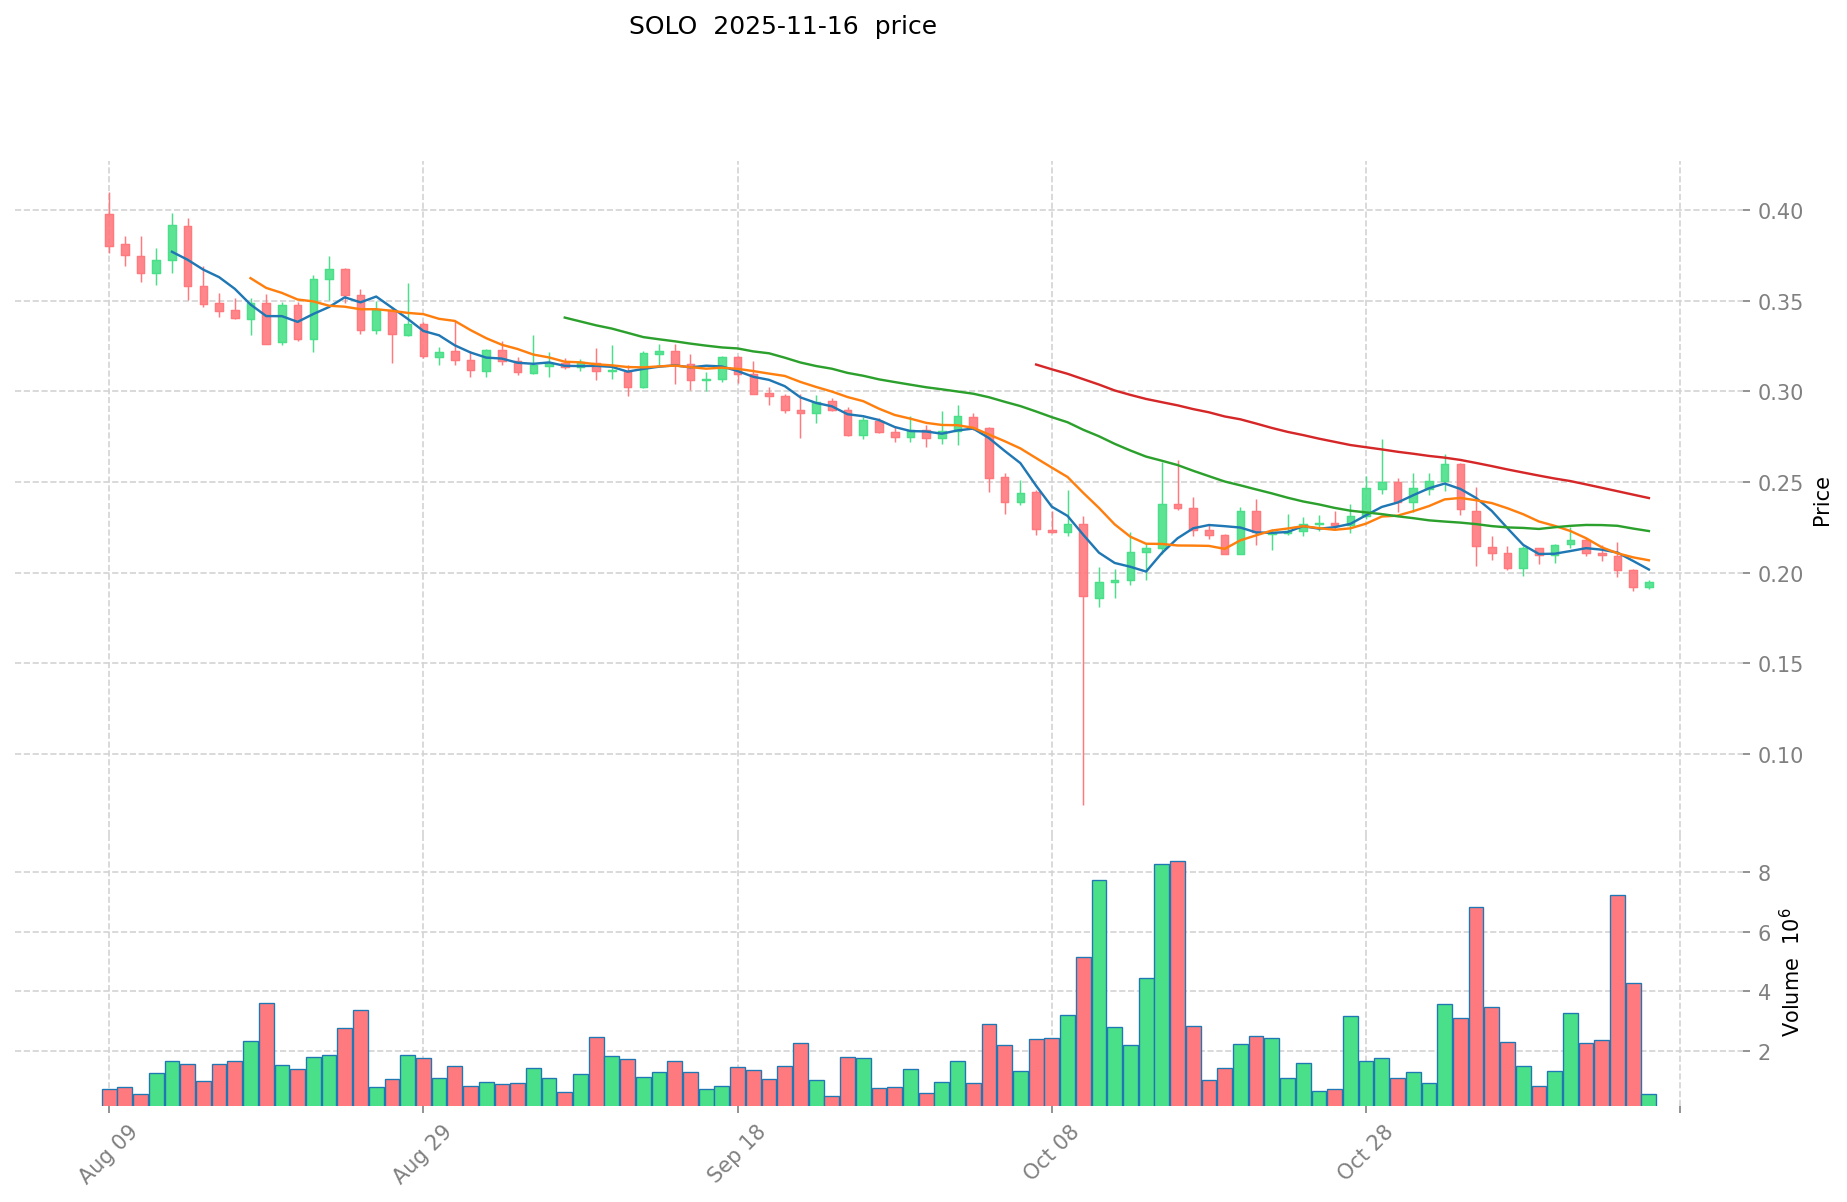
- 2021: SOLO reached its all-time high of $6.55 on December 3, 2021, and its all-time low of $0.061723 on October 29, 2021.
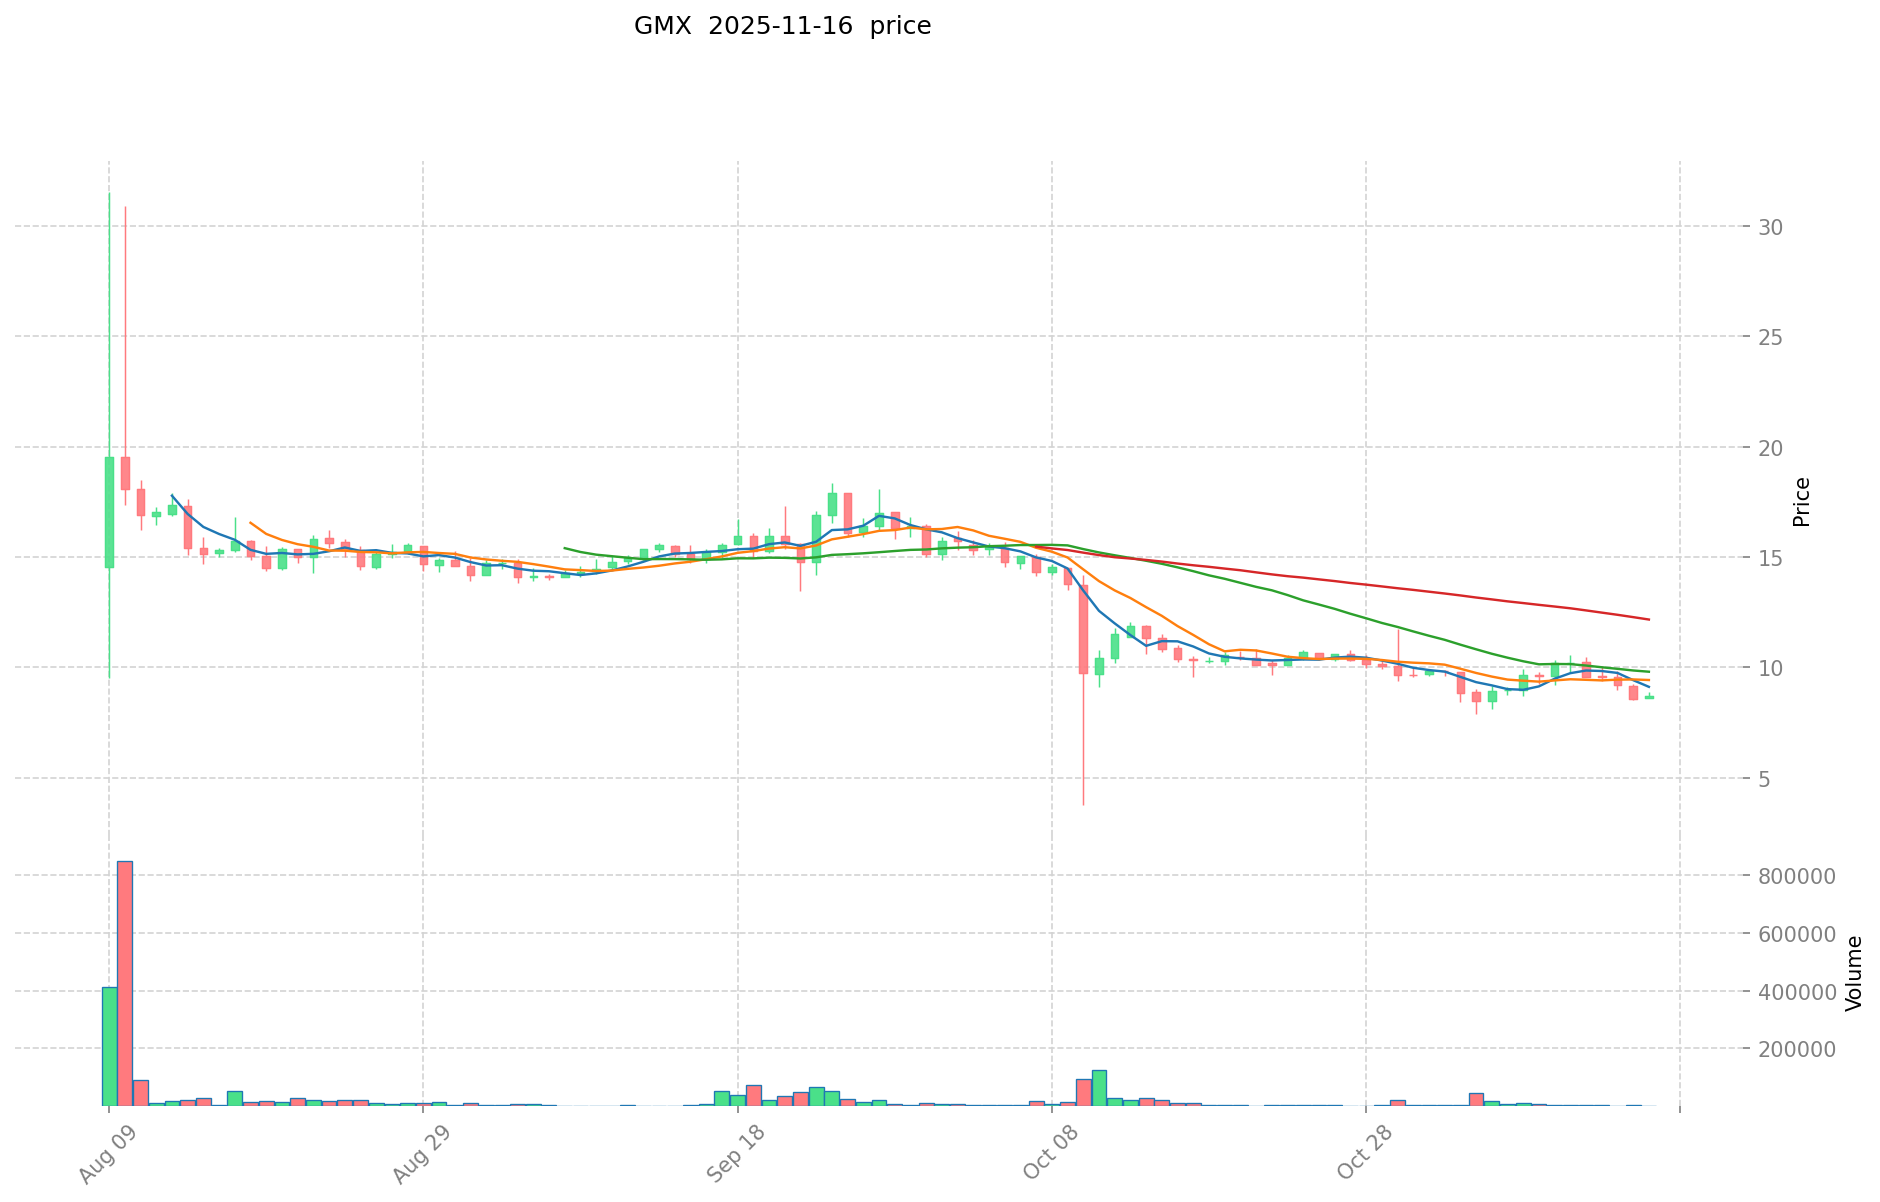
- 2023: GMX hit its all-time high of $91.07 on April 18, 2023.
- Comparative analysis: GMX has shown a wider price range, with its all-time high being significantly higher than SOLO's. However, GMX has also experienced a substantial decline, reaching its all-time low of $6.92 on October 11, 2025.
Current Market Situation (2025-11-17)
- SOLO current price: $0.18706
- GMX current price: $8.378
- 24-hour trading volume: SOLO $598,997.51 vs GMX $12,282.99
- Market Sentiment Index (Fear & Greed Index): 10 (Extreme Fear)
Click to view real-time prices:
- View SOLO current price Market Price
- View GMX current price Market Price
II. Core Factors Affecting Investment Value of SOLO vs GMX
Supply Mechanisms Comparison (Tokenomics)
-
SOLO: Fixed maximum supply of 10 billion tokens with deflationary mechanisms including token burns from transaction fees and buybacks
-
GMX: Capped maximum supply with emissions that decrease over time; features revenue sharing mechanism where 30% of platform fees go to stakers
-
📌 Historical Pattern: Deflationary mechanisms like SOLO's burns tend to create upward price pressure during high volume periods, while GMX's revenue sharing provides more consistent returns regardless of market cycles.
Institutional Adoption and Market Applications
- Institutional Holdings: GMX has gained more institutional traction with recognized backing from venture firms and integration with institutional trading platforms
- Enterprise Adoption: GMX shows stronger adoption in derivatives trading infrastructure, while SOLO is positioning for broader payment and settlement applications
- Regulatory Attitudes: Both face varying regulatory frameworks across jurisdictions; GMX's derivatives focus attracts more regulatory scrutiny in certain markets
Technical Development and Ecosystem Building
- SOLO Technical Upgrades: Focus on cross-chain interoperability and enhanced security features
- GMX Technical Development: Expansion to multiple chains including Arbitrum and Avalanche with optimized trading systems and lower fees
- Ecosystem Comparison: GMX has a more established DeFi ecosystem with derivatives trading and yield generation, while SOLO is developing broader payment and smart contract applications
Macroeconomic Factors and Market Cycles
- Performance During Inflation: GMX tends to perform well during market volatility due to increased trading volume and fees
- Monetary Policy Impact: Interest rate changes affect GMX's trading volumes more directly, while SOLO positions as a longer-term store of value
- Geopolitical Factors: Cross-border transaction restrictions potentially benefit both projects, with SOLO's payment focus possibly providing advantages in restricted markets
III. 2025-2030 Price Prediction: SOLO vs GMX
Short-term Prediction (2025)
- SOLO: Conservative $0.15-$0.19 | Optimistic $0.19-$0.27
- GMX: Conservative $6.39-$8.30 | Optimistic $8.30-$10.79
Mid-term Prediction (2027)
- SOLO may enter a growth phase, with an estimated price range of $0.23-$0.29
- GMX may enter a bullish market, with an estimated price range of $6.87-$15.28
- Key drivers: Institutional capital inflow, ETF, ecosystem development
Long-term Prediction (2030)
- SOLO: Base scenario $0.30-$0.35 | Optimistic scenario $0.35-$0.40
- GMX: Base scenario $15.06-$16.37 | Optimistic scenario $16.37-$17.51
Disclaimer: This analysis is based on historical data and market projections. Cryptocurrency markets are highly volatile and unpredictable. This information should not be construed as financial advice. Always conduct your own research before making investment decisions.
SOLO:
| 年份 | 预测最高价 | 预测平均价格 | 预测最低价 | 涨跌幅 |
|---|---|---|---|---|
| 2025 | 0.2688972 | 0.18804 | 0.1466712 | 0 |
| 2026 | 0.27416232 | 0.2284686 | 0.17135145 | 22 |
| 2027 | 0.2864996244 | 0.25131546 | 0.2286970686 | 34 |
| 2028 | 0.319999975218 | 0.2689075422 | 0.17478990243 | 43 |
| 2029 | 0.40045711184424 | 0.294453758709 | 0.26795292042519 | 57 |
| 2030 | 0.403048304920879 | 0.34745543527662 | 0.298811674337893 | 85 |
GMX:
| 年份 | 预测最高价 | 预测平均价格 | 预测最低价 | 涨跌幅 |
|---|---|---|---|---|
| 2025 | 10.7913 | 8.301 | 6.39177 | 0 |
| 2026 | 12.600918 | 9.54615 | 6.0140745 | 13 |
| 2027 | 15.28147692 | 11.073534 | 6.86559108 | 32 |
| 2028 | 18.448507644 | 13.17750546 | 12.6504052416 | 57 |
| 2029 | 16.91991701064 | 15.813006552 | 8.22276340704 | 88 |
| 2030 | 17.5121141060124 | 16.36646178132 | 15.0571448388144 | 95 |
IV. Investment Strategy Comparison: SOLO vs GMX
Long-term vs Short-term Investment Strategies
- SOLO: Suitable for investors focused on payment solutions and ecosystem potential
- GMX: Suitable for investors seeking exposure to decentralized derivatives trading and fee-sharing mechanisms
Risk Management and Asset Allocation
- Conservative investors: SOLO 30% vs GMX 70%
- Aggressive investors: SOLO 40% vs GMX 60%
- Hedging tools: Stablecoin allocation, options, cross-currency portfolios
V. Potential Risk Comparison
Market Risks
- SOLO: High volatility due to lower market cap and trading volume
- GMX: Exposure to derivatives market fluctuations and liquidity risks
Technical Risks
- SOLO: Scalability, network stability
- GMX: Smart contract vulnerabilities, oracle dependence
Regulatory Risks
- Global regulatory policies may impact both differently, with GMX potentially facing more scrutiny due to its derivatives focus
VI. Conclusion: Which Is the Better Buy?
📌 Investment Value Summary:
- SOLO advantages: Cross-chain interoperability, broader payment applications
- GMX advantages: Established DeFi ecosystem, revenue sharing mechanism
✅ Investment Advice:
- New investors: Consider a balanced approach with a slight preference for GMX due to its more established ecosystem
- Experienced investors: Explore opportunities in both, with a focus on GMX for short-term trading and SOLO for long-term ecosystem growth
- Institutional investors: GMX may offer more immediate opportunities in the derivatives space, while SOLO could be considered for long-term blockchain payment solutions
⚠️ Risk Warning: The cryptocurrency market is highly volatile. This article does not constitute investment advice. None
VII. FAQ
Q1: What are the key differences between SOLO and GMX? A: SOLO focuses on enabling trading between cryptocurrencies and non-blockchain assets, while GMX is a decentralized perpetual exchange. SOLO has a fixed maximum supply with deflationary mechanisms, whereas GMX has a capped supply with emissions that decrease over time and features a revenue sharing mechanism.
Q2: Which coin has shown better price performance historically? A: GMX has shown a wider price range, with its all-time high of $91.07 being significantly higher than SOLO's all-time high of $6.55. However, GMX has also experienced more substantial declines.
Q3: How do the supply mechanisms of SOLO and GMX differ? A: SOLO has a fixed maximum supply of 10 billion tokens with deflationary mechanisms including token burns and buybacks. GMX has a capped maximum supply with decreasing emissions over time and a revenue sharing mechanism where 30% of platform fees go to stakers.
Q4: What are the main factors affecting the investment value of SOLO and GMX? A: Key factors include supply mechanisms, institutional adoption, market applications, technical development, ecosystem building, and macroeconomic factors such as inflation and monetary policy.
Q5: How do SOLO and GMX compare in terms of institutional adoption? A: GMX has gained more institutional traction with recognized backing from venture firms and integration with institutional trading platforms, while SOLO is positioning for broader payment and settlement applications.
Q6: What are the predicted price ranges for SOLO and GMX in 2030? A: For SOLO, the base scenario is $0.30-$0.35, with an optimistic scenario of $0.35-$0.40. For GMX, the base scenario is $15.06-$16.37, with an optimistic scenario of $16.37-$17.51.
Q7: How should investors allocate their assets between SOLO and GMX? A: For conservative investors, a suggested allocation is 30% SOLO and 70% GMX. For aggressive investors, the suggested allocation is 40% SOLO and 60% GMX. However, individual risk tolerance and investment goals should be considered.
Q8: What are the potential risks associated with investing in SOLO and GMX? A: Both face market risks such as volatility, technical risks including scalability and smart contract vulnerabilities, and regulatory risks. GMX may face more regulatory scrutiny due to its focus on derivatives trading.
Share
Content
Introduction: SOLO vs GMX Investment Comparison
I. Price History Comparison and Current Market Status
II. Core Factors Affecting Investment Value of SOLO vs GMX
III. 2025-2030 Price Prediction: SOLO vs GMX
IV. Investment Strategy Comparison: SOLO vs GMX
V. Potential Risk Comparison
VI. Conclusion: Which Is the Better Buy?
VII. FAQ

