NIM vs QNT: A Comprehensive Analysis of Two Leading Blockchain Network Infrastructure Solutions
Introduction: NIM vs QNT Investment Comparison
In the cryptocurrency market, Nimiq (NIM) vs Quant (QNT) comparison has always been a topic that investors can't ignore. The two not only have significant differences in market cap ranking, application scenarios, and price performance, but also represent different cryptocurrency asset positioning.
Nimiq (NIM): Since its launch in 2017, it has gained market recognition for its browser-centric blockchain payment protocol.
Quant (QNT): Introduced in 2018, it has been hailed as a solution for blockchain interoperability, becoming one of the leading platforms for enterprise innovation and blockchain adoption.
This article will comprehensively analyze the investment value comparison between NIM and QNT, focusing on historical price trends, supply mechanisms, institutional adoption, technological ecosystems, and future predictions, attempting to answer the question that concerns investors the most:
"Which is the better buy right now?"
I. Price History Comparison and Current Market Status
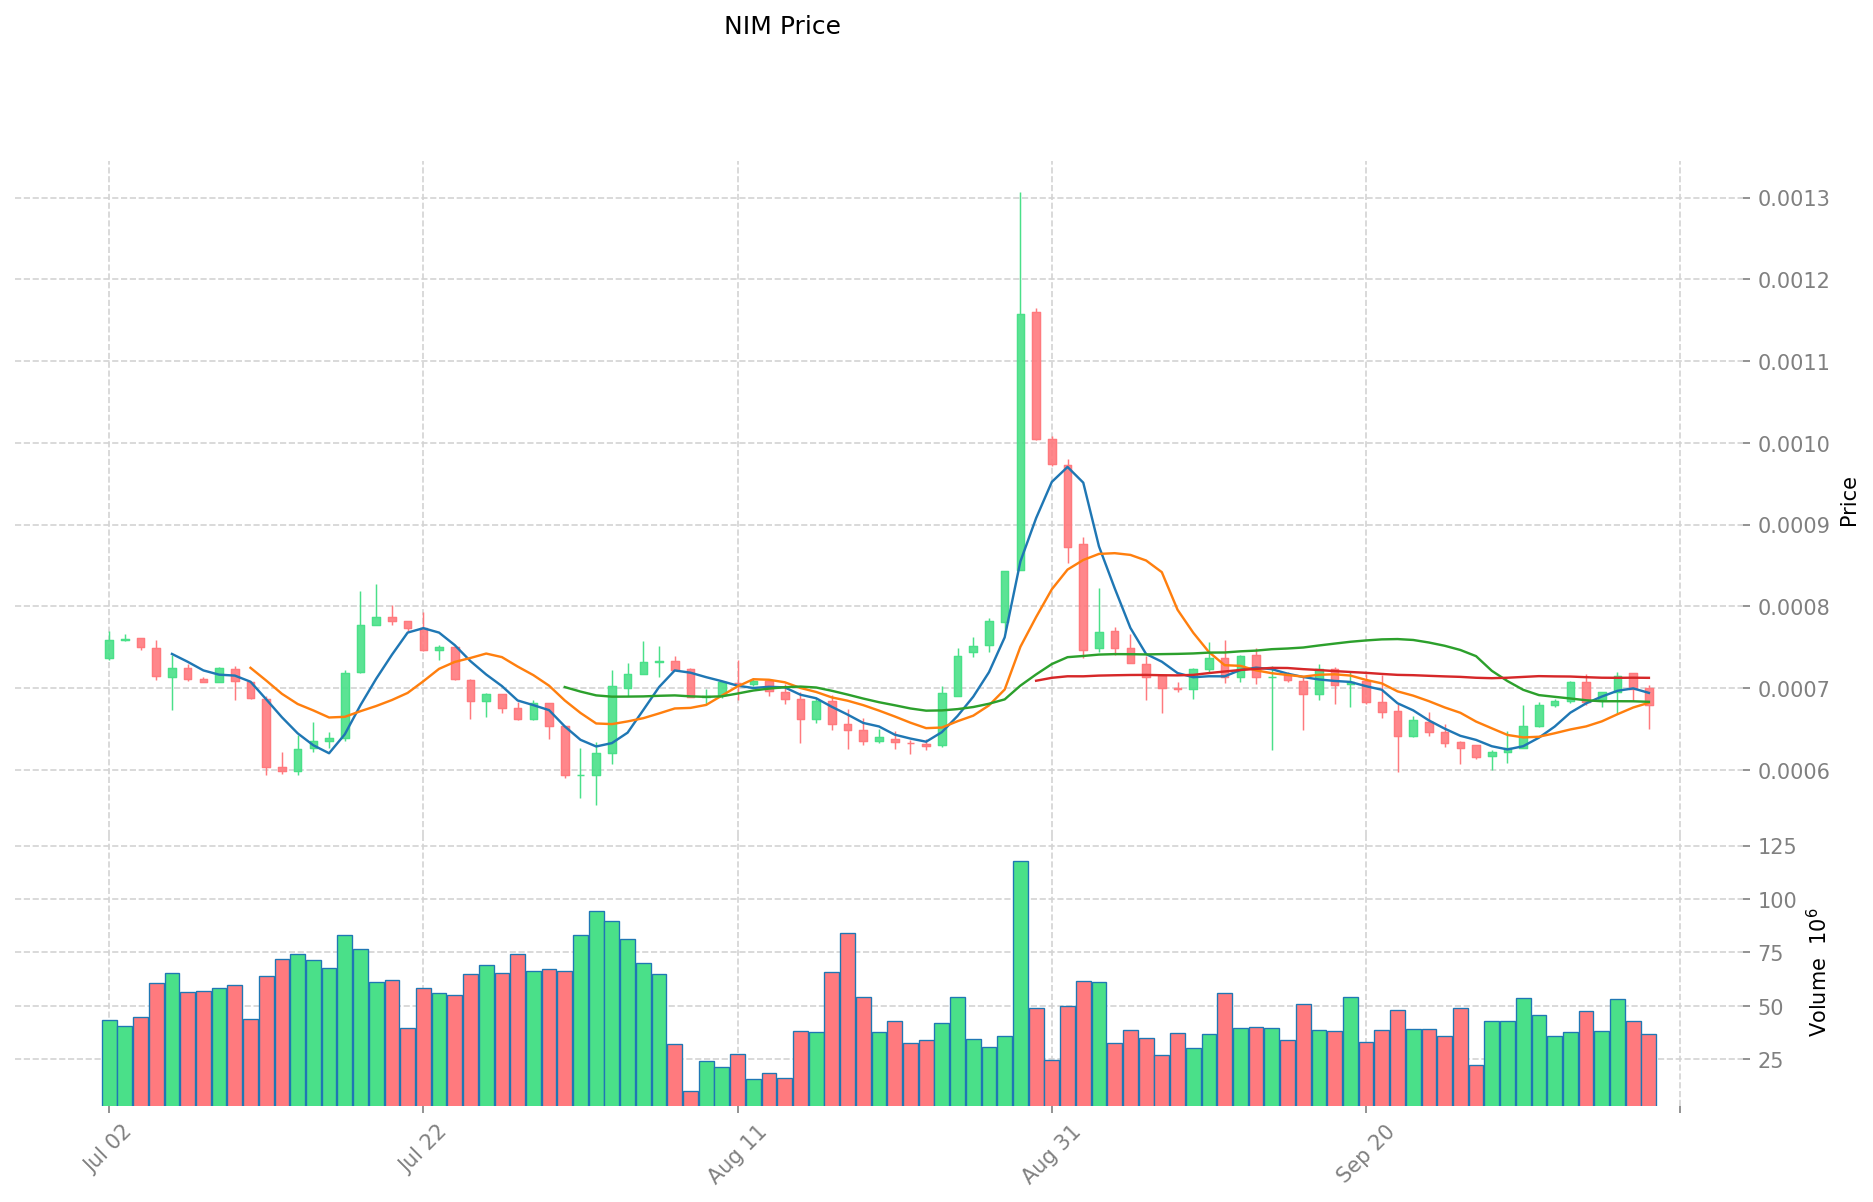
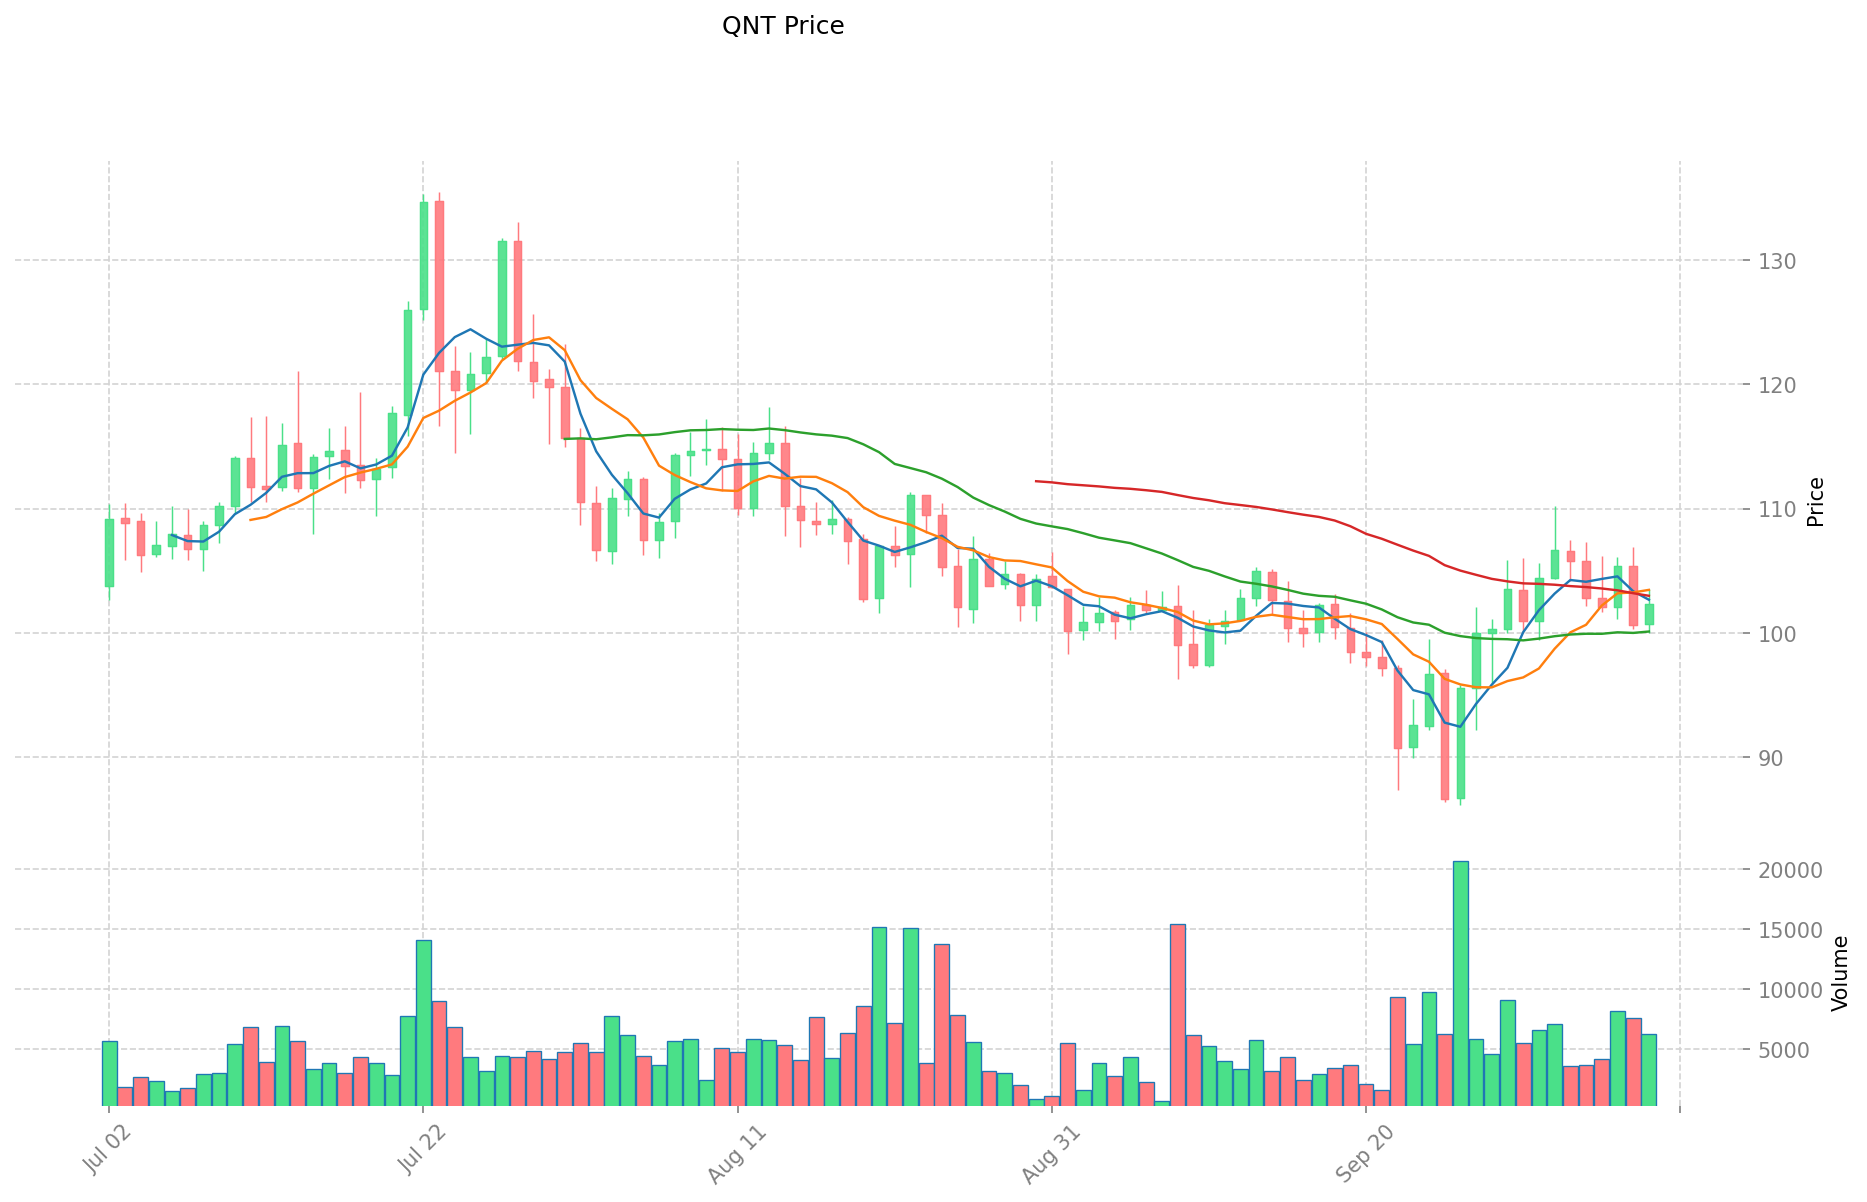
NIM and QNT Historical Price Trends
- 2021: QNT reached its all-time high of $427.42 on September 11, 2021.
- 2018: QNT hit its all-time low of $0.215773 on August 23, 2018.
- Comparative analysis: Over the years, NIM has fluctuated between a high of $0.01501821 and a low of $0.00028326, while QNT has shown a much wider price range.
Current Market Situation (2025-10-09)
- NIM current price: $0.0006811
- QNT current price: $102.2
- 24-hour trading volume: NIM $24,992.14 vs QNT $630,416.82
- Market Sentiment Index (Fear & Greed Index): 60 (Greed)
Click to view real-time prices:
- Check NIM current price Market Price
- Check QNT current price Market Price
II. Core Factors Influencing NIM vs QNT Investment Value
Supply Mechanism Comparison (Tokenomics)
- NIM: Limited information available on supply mechanism
- QNT: Limited information available on supply mechanism
- 📌 Historical Pattern: Insufficient data on how supply mechanisms drive price cycle changes.
Institutional Adoption and Market Applications
- Institutional Holdings: Limited information on institutional preference
- Enterprise Adoption: Limited information on applications in cross-border payments, settlements, and portfolio investments
- National Policies: Limited information on regulatory attitudes across different countries
Technical Development and Ecosystem Building
- NIM Technical Upgrades: Limited information available
- QNT Technical Development: Limited information available
- Ecosystem Comparison: Limited information on DeFi, NFT, payment, and smart contract implementation
Macroeconomic and Market Cycles
- Performance in Inflationary Environments: Limited information on anti-inflation properties
- Macroeconomic Monetary Policy: Limited information on the impact of interest rates and USD index
- Geopolitical Factors: Limited information on cross-border transaction demands and international situations
III. 2025-2030 Price Prediction: NIM vs QNT
Short-term Prediction (2025)
- NIM: Conservative $0.00051225 - $0.000683 | Optimistic $0.000683 - $0.00071715
- QNT: Conservative $81.744 - $102.18 | Optimistic $102.18 - $116.4852
Mid-term Prediction (2027)
- NIM may enter a growth phase, with estimated prices ranging from $0.00063647318625 to $0.0009217887525
- QNT may enter a bullish market, with estimated prices ranging from $103.61997165 to $151.16325276
- Key drivers: Institutional capital inflow, ETF, ecosystem development
Long-term Prediction (2030)
- NIM: Base scenario $0.001215307507068 - $0.001336838257775 | Optimistic scenario $0.001336838257775+
- QNT: Base scenario $162.20304644544 - $210.863960379072 | Optimistic scenario $210.863960379072+
Disclaimer: This analysis is based on historical data and market projections. Cryptocurrency markets are highly volatile and unpredictable. This information should not be considered as financial advice. Always conduct your own research before making investment decisions.
NIM:
| 年份 | 预测最高价 | 预测平均价格 | 预测最低价 | 涨跌幅 |
|---|---|---|---|---|
| 2025 | 0.00071715 | 0.000683 | 0.00051225 | 0 |
| 2026 | 0.00076308175 | 0.000700075 | 0.000364039 | 2 |
| 2027 | 0.0009217887525 | 0.000731578375 | 0.00063647318625 | 7 |
| 2028 | 0.001165623824887 | 0.00082668356375 | 0.000545611152075 | 21 |
| 2029 | 0.001434461319819 | 0.000996153694318 | 0.000796922955455 | 46 |
| 2030 | 0.001336838257775 | 0.001215307507068 | 0.001057317531149 | 78 |
QNT:
| 年份 | 预测最高价 | 预测平均价格 | 预测最低价 | 涨跌幅 |
|---|---|---|---|---|
| 2025 | 116.4852 | 102.18 | 81.744 | 0 |
| 2026 | 134.479098 | 109.3326 | 97.306014 | 6 |
| 2027 | 151.16325276 | 121.905849 | 103.61997165 | 19 |
| 2028 | 158.3800790208 | 136.53455088 | 77.8246940016 | 33 |
| 2029 | 176.94877794048 | 147.4573149504 | 117.96585196032 | 44 |
| 2030 | 210.863960379072 | 162.20304644544 | 98.9438583317184 | 58 |
IV. Investment Strategy Comparison: NIM vs QNT
Long-term vs Short-term Investment Strategies
- NIM: Suitable for investors focusing on payment scenarios and ecosystem potential
- QNT: Suitable for investors seeking interoperability solutions and enterprise adoption
Risk Management and Asset Allocation
- Conservative investors: NIM: 30% vs QNT: 70%
- Aggressive investors: NIM: 60% vs QNT: 40%
- Hedging tools: Stablecoin allocation, options, cross-currency combinations
V. Potential Risk Comparison
Market Risks
- NIM: Higher volatility, lower liquidity
- QNT: Susceptible to enterprise adoption fluctuations
Technical Risks
- NIM: Scalability, network stability
- QNT: Interoperability challenges, security vulnerabilities
Regulatory Risks
- Global regulatory policies may have different impacts on both assets
VI. Conclusion: Which Is the Better Buy?
📌 Investment Value Summary:
- NIM advantages: Browser-centric blockchain payment protocol, potential for growth in online transactions
- QNT advantages: Strong focus on blockchain interoperability, enterprise adoption potential
✅ Investment Advice:
- Novice investors: Consider a balanced approach with a slight preference for QNT due to its enterprise focus
- Experienced investors: Evaluate both assets based on personal risk tolerance and market analysis
- Institutional investors: QNT may be more attractive due to its enterprise-oriented solutions
⚠️ Risk Warning: The cryptocurrency market is highly volatile. This article does not constitute investment advice. None
VII. FAQ
Q1: What are the main differences between NIM and QNT? A: NIM is a browser-centric blockchain payment protocol, while QNT focuses on blockchain interoperability and enterprise solutions. NIM has a lower price point and market cap, while QNT has shown a wider price range and higher trading volume.
Q2: Which cryptocurrency has shown better historical price performance? A: Based on the available data, QNT has demonstrated better historical price performance. It reached an all-time high of $427.42 in September 2021, while NIM has fluctuated between $0.01501821 and $0.00028326.
Q3: How do the current prices of NIM and QNT compare? A: As of 2025-10-09, NIM is priced at $0.0006811, while QNT is priced at $102.2. QNT has a significantly higher price point and 24-hour trading volume compared to NIM.
Q4: What are the key factors influencing the investment value of NIM and QNT? A: Key factors include supply mechanisms, institutional adoption, technical development, ecosystem building, macroeconomic conditions, and market cycles. However, detailed information on these factors is limited in the provided context.
Q5: What are the long-term price predictions for NIM and QNT? A: By 2030, NIM is predicted to reach a base scenario of $0.001215307507068 - $0.001336838257775, with an optimistic scenario above $0.001336838257775. QNT is predicted to reach a base scenario of $162.20304644544 - $210.863960379072, with an optimistic scenario above $210.863960379072.
Q6: How should investors approach NIM and QNT in terms of asset allocation? A: Conservative investors might consider allocating 30% to NIM and 70% to QNT, while aggressive investors might opt for 60% NIM and 40% QNT. However, individual strategies should be based on personal risk tolerance and market analysis.
Q7: What are the potential risks associated with investing in NIM and QNT? A: Both cryptocurrencies face market risks, technical risks, and regulatory risks. NIM may have higher volatility and lower liquidity, while QNT could be susceptible to fluctuations in enterprise adoption. Technical risks include scalability issues for NIM and interoperability challenges for QNT.
Share
Content