METIS vs GRT: Comparing Two Leading Blockchain Scaling Solutions for Ethereum
Introduction: METIS vs GRT Investment Comparison
In the cryptocurrency market, the comparison between METIS and GRT has always been an unavoidable topic for investors. The two not only show significant differences in market cap ranking, application scenarios, and price performance, but also represent different crypto asset positioning.
Metis Token (METIS): Since its launch in 2021, it has gained market recognition for its multi-network ecosystem approach to decentralized infrastructure.
The Graph (GRT): Introduced in 2020, it has been hailed as a decentralized protocol for indexing and querying blockchain data, becoming one of the most widely used infrastructure projects in the crypto space.
This article will comprehensively analyze the investment value comparison between METIS and GRT, focusing on historical price trends, supply mechanisms, institutional adoption, technological ecosystems, and future predictions, attempting to answer the question investors care about most:
"Which is the better buy right now?"
I. Price History Comparison and Current Market Status
METIS (Coin A) and GRT (Coin B) Historical Price Trends
- 2021: METIS reached its all-time high of $323.54 on January 17, 2022, likely due to increased interest in Layer 2 solutions.
- 2021: GRT hit its all-time high of $2.84 on February 12, 2021, possibly influenced by the growing demand for blockchain data indexing services.
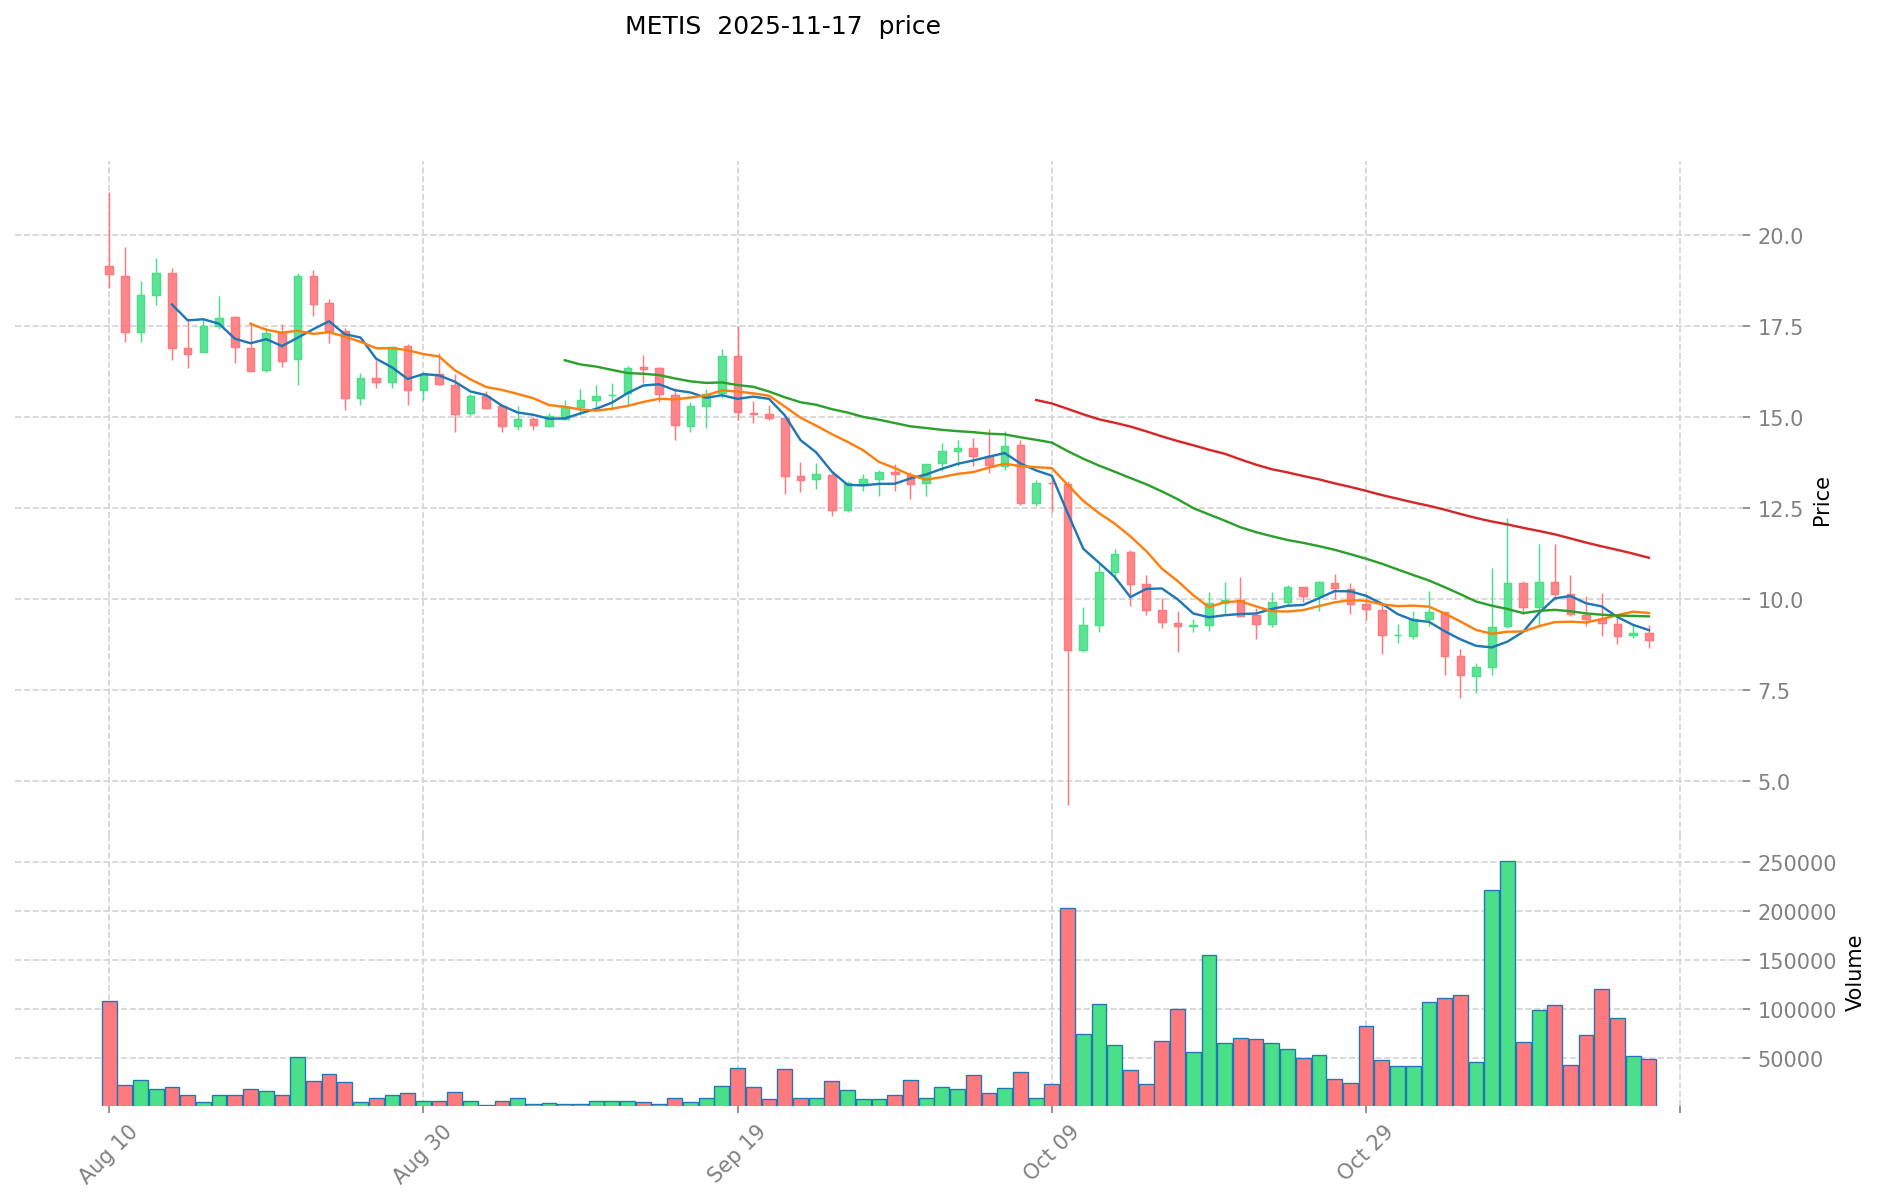
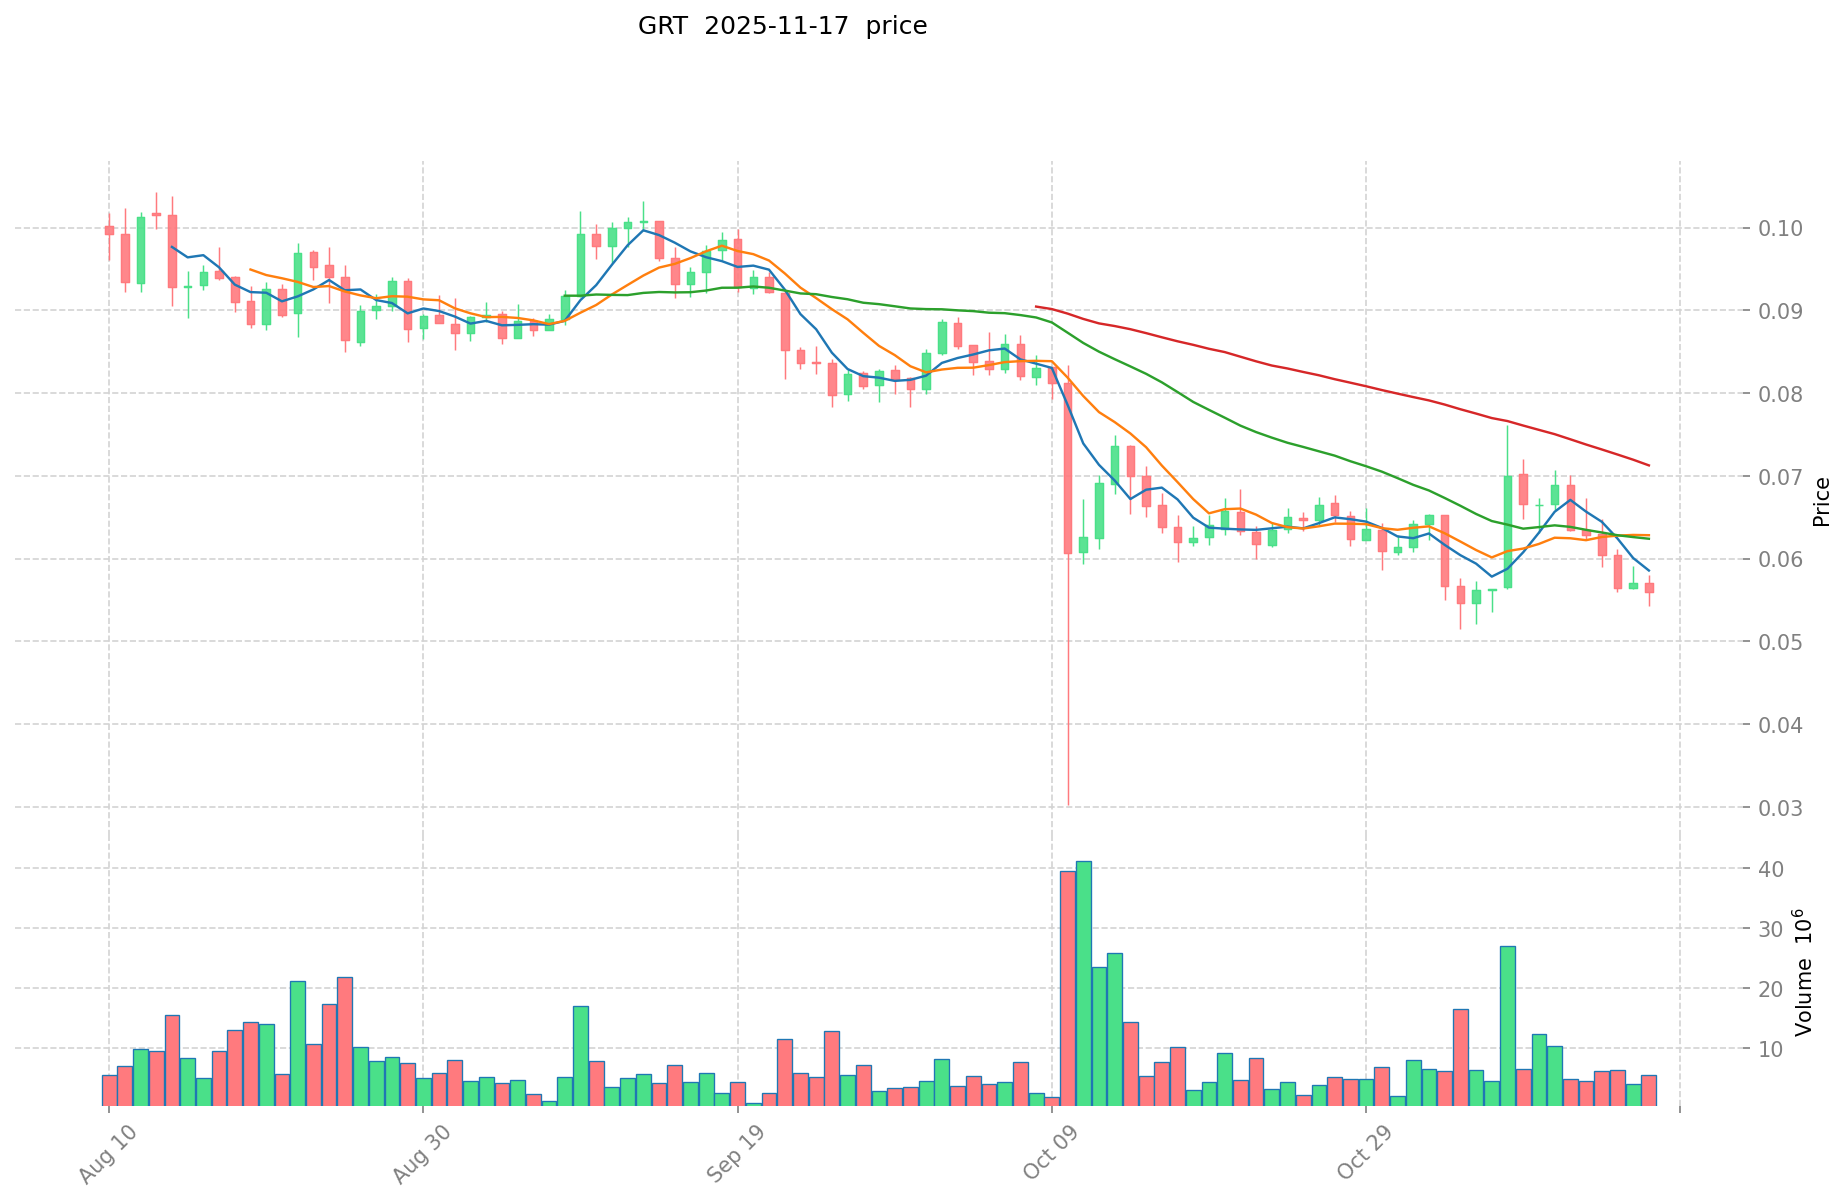
- Comparative analysis: In the current market cycle, METIS has fallen from its all-time high of $323.54 to a current price of $8.755, while GRT has dropped from its peak of $2.84 to $0.05726.
Current Market Situation (2025-11-17)
- METIS current price: $8.755
- GRT current price: $0.05726
- 24-hour trading volume: METIS $454,025.55018 vs GRT $334,324.5666698
- Market Sentiment Index (Fear & Greed Index): 10 (Extreme Fear)
Click to view real-time prices:
- View METIS current price Market Price
- View GRT current price Market Price
II. Core Factors Affecting the Investment Value of METIS vs GRT
Supply Mechanisms Comparison (Tokenomics)
-
METIS: 10 million fixed maximum supply with a deflationary model; tokens are consumed in the network through gas fees
-
GRT: 10 billion total supply with gradual release; uses a delegator-curator-indexer model where tokens are staked and burned during queries
-
📌 Historical Pattern: Deflationary models like METIS tend to create upward price pressure during high network activity, while GRT's indexing rewards and query fees create a balanced tokenomic cycle dependent on ecosystem growth.
Institutional Adoption and Market Applications
- Institutional Holdings: GRT has broader institutional adoption with major backers including Coinbase Ventures, Digital Currency Group, and Framework Ventures
- Enterprise Adoption: METIS focuses on enterprise L2 scaling solutions for Ethereum applications, while GRT powers data indexing across multiple blockchains for hundreds of applications
- Regulatory Stance: Both tokens operate as utility tokens with relatively similar regulatory positioning across jurisdictions
Technical Development and Ecosystem Building
- METIS Technical Upgrades: Implementation of Optimistic rollups and development of a DAC (Decentralized Autonomous Company) framework for enterprise adoption
- GRT Technical Development: Continuous expansion of subgraph support across multiple blockchains and development of verified subgraph marketplace
- Ecosystem Comparison: GRT has established wider adoption as the indexing infrastructure for hundreds of DeFi and NFT projects, while METIS focuses on providing scaling solutions for Ethereum dApps
Macroeconomic Factors and Market Cycles
- Performance During Inflation: Neither token has demonstrated significant inflation-resistant properties compared to traditional hard assets
- Macroeconomic Monetary Policy: Both tokens follow the broader crypto market trends in response to interest rates and USD strength
- Geopolitical Factors: GRT's decentralized data indexing may become more valuable in regions seeking censorship-resistant access to blockchain data
III. 2025-2030 Price Prediction: METIS vs GRT
Short-term Prediction (2025)
- METIS: Conservative $7.40 - $8.71 | Optimistic $8.71 - $12.11
- GRT: Conservative $0.051 - $0.057 | Optimistic $0.057 - $0.075
Mid-term Prediction (2027)
- METIS may enter a growth phase, with estimated price range $8.57 - $14.11
- GRT may enter a steady growth phase, with estimated price range $0.062 - $0.099
- Key drivers: Institutional capital inflow, ETF, ecosystem development
Long-term Prediction (2030)
- METIS: Base scenario $14.97 - $16.82 | Optimistic scenario $16.82 - $21.53
- GRT: Base scenario $0.068 - $0.103 | Optimistic scenario $0.103 - $0.118
Disclaimer: The above predictions are based on historical data and market analysis. Cryptocurrency markets are highly volatile and unpredictable. This information should not be considered as financial advice. Always conduct your own research before making any investment decisions.
METIS:
| 年份 | 预测最高价 | 预测平均价格 | 预测最低价 | 涨跌幅 |
|---|---|---|---|---|
| 2025 | 12.10829 | 8.711 | 7.40435 | 0 |
| 2026 | 14.7816959 | 10.409645 | 9.05639115 | 18 |
| 2027 | 14.107150904 | 12.59567045 | 8.565055906 | 43 |
| 2028 | 13.88546710408 | 13.351410677 | 10.6811285416 | 52 |
| 2029 | 20.0191051690938 | 13.61843889054 | 11.575673056959 | 55 |
| 2030 | 21.528028198165632 | 16.8187720298169 | 14.968707106537041 | 92 |
GRT:
| 年份 | 预测最高价 | 预测平均价格 | 预测最低价 | 涨跌幅 |
|---|---|---|---|---|
| 2025 | 0.0752464 | 0.05744 | 0.0511216 | 0 |
| 2026 | 0.084255864 | 0.0663432 | 0.053737992 | 15 |
| 2027 | 0.09939538224 | 0.075299532 | 0.06249861156 | 31 |
| 2028 | 0.1056904231152 | 0.08734745712 | 0.0515349997008 | 52 |
| 2029 | 0.110031591734064 | 0.0965189401176 | 0.05791136407056 | 68 |
| 2030 | 0.117733803155448 | 0.103275265925832 | 0.068161675511049 | 80 |
IV. Investment Strategy Comparison: METIS vs GRT
Long-term vs Short-term Investment Strategy
- METIS: Suitable for investors focused on Layer 2 scaling solutions and enterprise blockchain adoption
- GRT: Suitable for investors interested in blockchain data infrastructure and wide ecosystem integration
Risk Management and Asset Allocation
- Conservative investors: METIS: 30% vs GRT: 70%
- Aggressive investors: METIS: 60% vs GRT: 40%
- Hedging tools: Stablecoin allocation, options, cross-currency portfolios
V. Potential Risk Comparison
Market Risk
- METIS: Higher volatility due to lower market cap and trading volume
- GRT: Susceptible to broader market trends in DeFi and blockchain data services
Technical Risk
- METIS: Scalability challenges, network stability during high traffic periods
- GRT: Indexer concentration, potential vulnerabilities in subgraph deployments
Regulatory Risk
- Global regulatory policies may impact both tokens differently, with GRT potentially facing more scrutiny due to its role in data indexing
VI. Conclusion: Which Is the Better Buy?
📌 Investment Value Summary:
- METIS advantages: Strong focus on enterprise-grade Layer 2 solutions, deflationary tokenomics
- GRT advantages: Wider ecosystem adoption, established position in blockchain data indexing
✅ Investment Advice:
- New investors: Consider a balanced approach with a slight bias towards GRT due to its more established ecosystem
- Experienced investors: Explore a higher allocation to METIS for potential growth, while maintaining GRT exposure
- Institutional investors: Evaluate both for different portfolio needs - GRT for broader blockchain exposure, METIS for targeted Layer 2 investment
⚠️ Risk Warning: The cryptocurrency market is highly volatile. This article does not constitute investment advice. None
VII. FAQ
Q1: What are the main differences between METIS and GRT? A: METIS focuses on Layer 2 scaling solutions for Ethereum, while GRT is a decentralized protocol for indexing and querying blockchain data. METIS has a fixed supply of 10 million tokens with a deflationary model, while GRT has a total supply of 10 billion tokens with a gradual release.
Q2: Which token has shown better price performance historically? A: Both tokens have experienced significant price drops from their all-time highs. METIS reached $323.54 in January 2022 and is now at $8.755, while GRT peaked at $2.84 in February 2021 and is currently at $0.05726.
Q3: How do the tokenomics of METIS and GRT compare? A: METIS has a deflationary model where tokens are consumed through gas fees, potentially creating upward price pressure during high network activity. GRT uses a delegator-curator-indexer model where tokens are staked and burned during queries, creating a balanced tokenomic cycle dependent on ecosystem growth.
Q4: Which token has greater institutional adoption? A: GRT has broader institutional adoption with major backers including Coinbase Ventures, Digital Currency Group, and Framework Ventures. It's also more widely used across multiple blockchains for hundreds of applications.
Q5: What are the key factors affecting the future price of METIS and GRT? A: Key factors include institutional capital inflow, potential ETF approvals, ecosystem development, technical upgrades, and broader adoption of their respective technologies in the blockchain industry.
Q6: How should investors approach METIS and GRT in terms of risk management? A: For conservative investors, a suggested allocation might be 30% METIS and 70% GRT. For aggressive investors, the ratio could be 60% METIS and 40% GRT. It's also advisable to use hedging tools such as stablecoin allocation, options, and cross-currency portfolios.
Q7: Which token might be a better investment for new crypto investors? A: New investors might consider a balanced approach with a slight bias towards GRT due to its more established ecosystem and wider adoption. However, individual investment decisions should be based on personal research and risk tolerance.
Share
Content
Introduction: METIS vs GRT Investment Comparison
I. Price History Comparison and Current Market Status
II. Core Factors Affecting the Investment Value of METIS vs GRT
III. 2025-2030 Price Prediction: METIS vs GRT
IV. Investment Strategy Comparison: METIS vs GRT
V. Potential Risk Comparison
VI. Conclusion: Which Is the Better Buy?
VII. FAQ

