LEO vs QNT: Battle of the Blockchain Titans in the Financial Services Arena
Introduction: LEO vs QNT Investment Comparison
In the cryptocurrency market, the comparison between LEO and QNT has always been an unavoidable topic for investors. The two not only show significant differences in market cap ranking, application scenarios, and price performance, but also represent different positioning in crypto assets.
LEO (LEO): Since its launch in 2019, it has gained market recognition as the core utility token of the iFinex ecosystem and the platform currency of Bitfinex.
QNT (QNT): Introduced in 2018, it has been hailed as a technology provider enabling trusted digital interactions, recognized for solving interoperability through its global blockchain operating system, Overledger.
This article will comprehensively analyze the investment value comparison between LEO and QNT, focusing on historical price trends, supply mechanisms, institutional adoption, technological ecosystems, and future predictions, attempting to answer the question investors care about most:
"Which is the better buy right now?"
I. Price History Comparison and Current Market Status
LEO and QNT Historical Price Trends
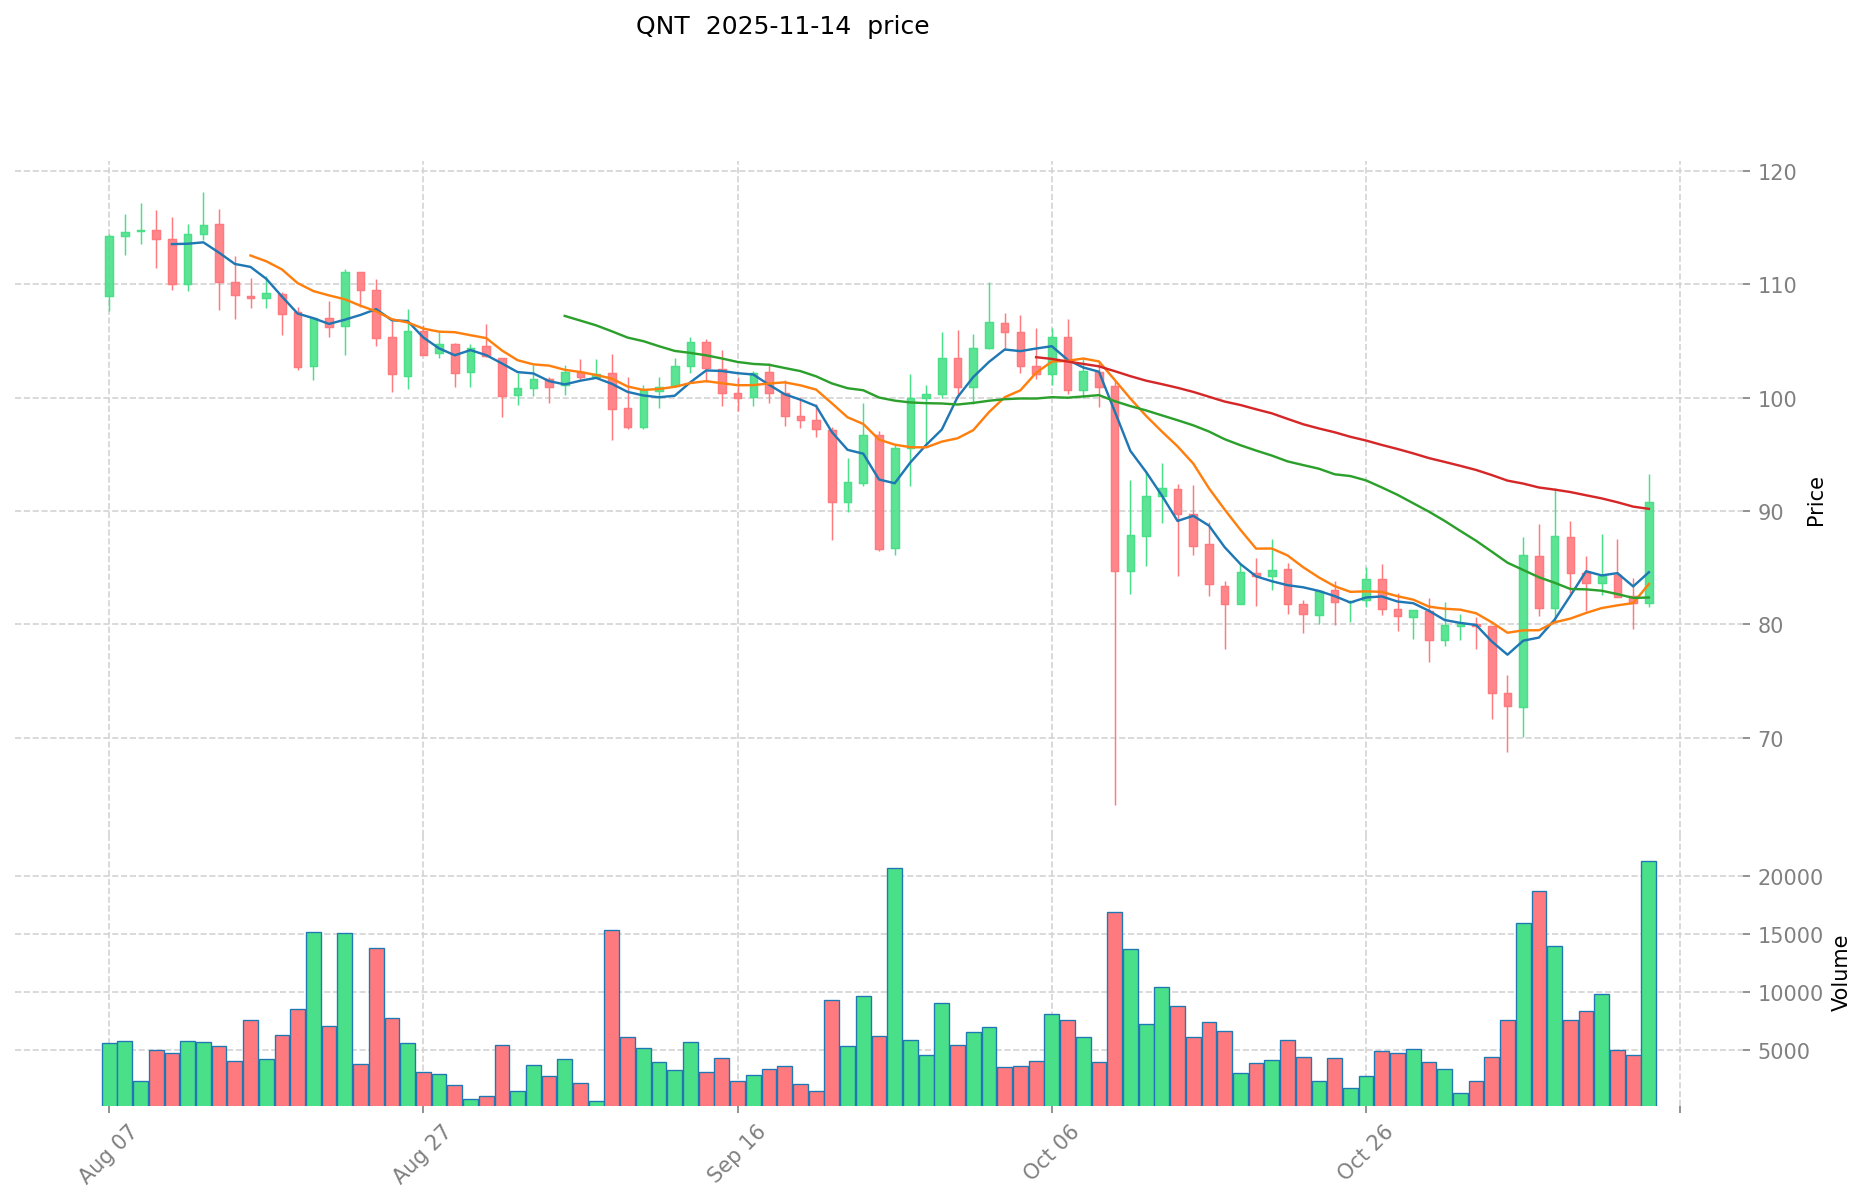
- 2021: QNT reached its all-time high of $427.42 on September 11, 2021.
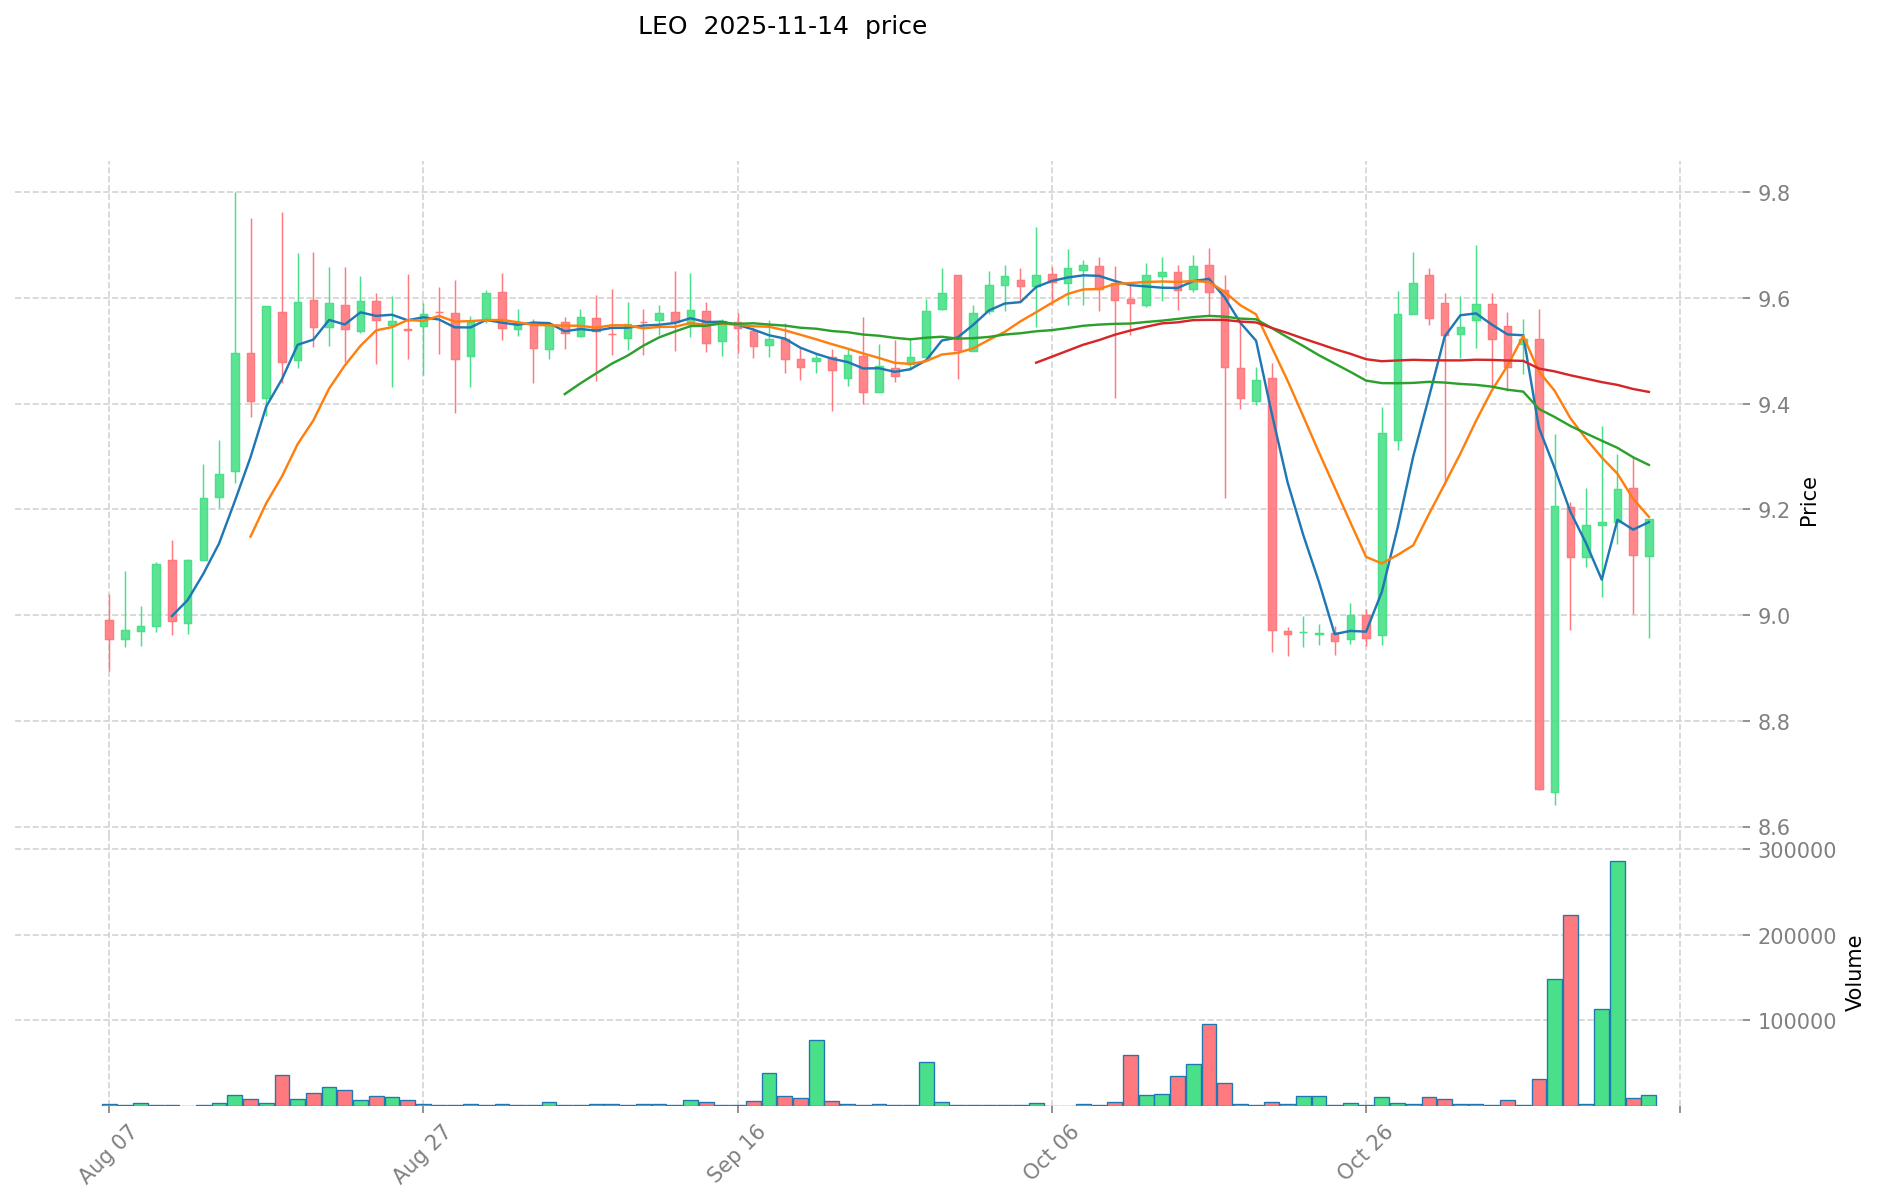
- 2025: LEO achieved its all-time high of $10.14 on March 10, 2025.
- Comparative analysis: LEO has shown more recent strength, reaching its ATH in 2025, while QNT's peak was in 2021.
Current Market Situation (2025-11-14)
- LEO current price: $9.192
- QNT current price: $86.53
- 24-hour trading volume: LEO $211,211.20 vs QNT $2,401,976.05
- Market Sentiment Index (Fear & Greed Index): 16 (Extreme Fear)
Click to view real-time prices:
- View LEO current price Market Price
- View QNT current price Market Price
II. Core Factors Influencing the Investment Value of LEO vs QNT
Supply Mechanisms Comparison (Tokenomics)
- LEO: Fixed maximum supply of 985,239,504 tokens with regular token burns from exchange revenues, creating a deflationary model
- QNT: Fixed supply of 14.6 million tokens with no additional issuance, creating natural scarcity
- 📌 Historical Pattern: Deflationary tokens like LEO tend to appreciate in value as supply decreases through burns, while QNT's extremely limited supply creates price pressure during adoption phases.
Institutional Adoption and Market Applications
- Institutional Holdings: QNT appears to have stronger institutional interest due to its enterprise-focused technology and partnerships with major financial networks
- Enterprise Adoption: QNT shows stronger enterprise implementation through Overledger OS and interoperability solutions for financial institutions, while LEO primarily derives value from Bitfinex ecosystem
- Regulatory Attitudes: QNT generally faces more favorable regulatory environments as it focuses on enterprise blockchain interoperability rather than exchange operations
Technical Development and Ecosystem Building
- LEO technical upgrades: Integration within Bitfinex exchange ecosystem, providing utility for trading fee discounts and platform services
- QNT technical development: Overledger OS platform enabling interoperability between different blockchain networks, positioning for CBDC integration
- Ecosystem comparison: QNT has stronger enterprise DeFi applications and payment systems integration, while LEO primarily serves as utility within the Bitfinex/iFinex ecosystem
Macroeconomic Factors and Market Cycles
- Inflation Performance: QNT potentially offers stronger inflation protection due to its extremely limited supply and enterprise utility
- Monetary Policy Impact: Both tokens are affected by liquidity conditions, with QNT potentially more resilient during tightening cycles due to its business utility
- Geopolitical Factors: QNT benefits from increased cross-border transaction demand and financial system modernization, while LEO is more exposed to crypto exchange regulatory risks III. 2025-2030 Price Prediction: LEO vs QNT
Short-term Prediction (2025)
- LEO: Conservative $7.53 - $9.19 | Optimistic $9.19 - $13.41
- QNT: Conservative $50.43 - $86.94 | Optimistic $86.94 - $98.24
Mid-term Prediction (2027)
- LEO may enter a growth phase, with an expected price range of $8.83 - $18.36
- QNT may enter a steady growth phase, with an expected price range of $59.79 - $111.99
- Key drivers: Institutional capital inflow, ETF, ecosystem development
Long-term Prediction (2030)
- LEO: Base scenario $11.88 - $20.48 | Optimistic scenario $20.48 - $30.52
- QNT: Base scenario $101.73 - $115.61 | Optimistic scenario $115.61 - $172.26
Disclaimer: The above predictions are based on historical data and market analysis. Cryptocurrency markets are highly volatile and subject to rapid changes. These projections should not be considered as financial advice. Always conduct your own research before making any investment decisions.
LEO:
| 年份 | 预测最高价 | 预测平均价格 | 预测最低价 | 涨跌幅 |
|---|---|---|---|---|
| 2025 | 13.41448 | 9.188 | 7.53416 | 0 |
| 2026 | 16.7258352 | 11.30124 | 8.2499052 | 22 |
| 2027 | 18.357734256 | 14.0135376 | 8.828528688 | 52 |
| 2028 | 20.71761398784 | 16.185635928 | 15.05264141304 | 76 |
| 2029 | 22.5109824486624 | 18.45162495792 | 17.529043710024 | 100 |
| 2030 | 30.517142517903888 | 20.4813037032912 | 11.879156147908896 | 122 |
QNT:
| 年份 | 预测最高价 | 预测平均价格 | 预测最低价 | 涨跌幅 |
|---|---|---|---|---|
| 2025 | 98.2422 | 86.94 | 50.4252 | 0 |
| 2026 | 97.220655 | 92.5911 | 51.851016 | 7 |
| 2027 | 111.98893545 | 94.9058775 | 59.790702825 | 9 |
| 2028 | 121.03346557575 | 103.447406475 | 97.2405620865 | 19 |
| 2029 | 118.9748621868975 | 112.240436025375 | 94.281966261315 | 29 |
| 2030 | 172.255397168143012 | 115.60764910613625 | 101.7347312133999 | 33 |
IV. Investment Strategy Comparison: LEO vs QNT
Long-term vs Short-term Investment Strategies
- LEO: Suitable for investors focused on exchange ecosystem growth and deflationary tokenomics
- QNT: Suitable for investors interested in enterprise blockchain adoption and interoperability solutions
Risk Management and Asset Allocation
- Conservative investors: LEO: 30% vs QNT: 70%
- Aggressive investors: LEO: 60% vs QNT: 40%
- Hedging tools: Stablecoin allocation, options, cross-currency portfolio
V. Potential Risk Comparison
Market Risk
- LEO: Highly dependent on Bitfinex exchange performance and crypto market cycles
- QNT: Susceptible to enterprise adoption rates and competition in the interoperability sector
Technical Risk
- LEO: Scalability of Bitfinex ecosystem, network stability
- QNT: Overledger platform security, potential vulnerabilities in interoperability solutions
Regulatory Risk
- Global regulatory policies may have different impacts on exchange-based tokens (LEO) versus enterprise blockchain solutions (QNT)
VI. Conclusion: Which Is the Better Buy?
📌 Investment Value Summary:
- LEO advantages: Deflationary model, strong exchange ecosystem utility, recent price strength
- QNT advantages: Limited supply, enterprise adoption, interoperability focus, potential CBDC integration
✅ Investment Advice:
- New investors: Consider a balanced approach, leaning towards QNT for its enterprise potential
- Experienced investors: Evaluate personal risk tolerance and market cycle position for allocation decisions
- Institutional investors: QNT may offer stronger long-term value proposition due to its enterprise focus
⚠️ Risk Warning: The cryptocurrency market is highly volatile. This article does not constitute investment advice. None
VII. FAQ
Q1: What are the key differences between LEO and QNT? A: LEO is the utility token of the Bitfinex exchange ecosystem with a deflationary model, while QNT is focused on enterprise blockchain interoperability through its Overledger platform. LEO has a larger supply and is more exchange-centric, whereas QNT has a limited supply and targets institutional adoption.
Q2: Which token has shown better recent price performance? A: LEO has shown more recent strength, reaching its all-time high of $10.14 in March 2025, while QNT's all-time high of $427.42 was achieved in September 2021.
Q3: How do the supply mechanisms of LEO and QNT differ? A: LEO has a fixed maximum supply of 985,239,504 tokens with regular token burns, creating a deflationary model. QNT has a fixed supply of 14.6 million tokens with no additional issuance, creating natural scarcity.
Q4: Which token appears to have stronger institutional interest? A: QNT appears to have stronger institutional interest due to its enterprise-focused technology and partnerships with major financial networks.
Q5: What are the long-term price predictions for LEO and QNT by 2030? A: For LEO, the base scenario predicts $11.88 - $20.48, with an optimistic scenario of $20.48 - $30.52. For QNT, the base scenario predicts $101.73 - $115.61, with an optimistic scenario of $115.61 - $172.26.
Q6: How do the investment strategies for LEO and QNT differ? A: LEO is suitable for investors focused on exchange ecosystem growth and deflationary tokenomics, while QNT is suitable for those interested in enterprise blockchain adoption and interoperability solutions.
Q7: What are the main risks associated with investing in LEO and QNT? A: LEO's risks are tied to Bitfinex exchange performance and crypto market cycles, while QNT's risks include enterprise adoption rates and competition in the interoperability sector. Both face regulatory risks, though potentially in different ways due to their distinct focuses.
Share
Content

