Japanese Candlestick Guide for Beginner Traders

2026-01-01 14:32:02
Crypto Trading
Crypto Tutorial
Investing In Crypto
Spot Trading
Trading Bots
Article Rating : 3
100 ratings
Beginner’s Guide to Reading Japanese Candlesticks: In-Depth Overview of Hammer and Engulfing Patterns, Bullish and Bearish Signals. Master Cryptocurrency Trading Strategies on Gate with Expert Technical Analysis.
Japanese Candlestick Guide for Beginner Traders

Introduction to Japanese Candlesticks

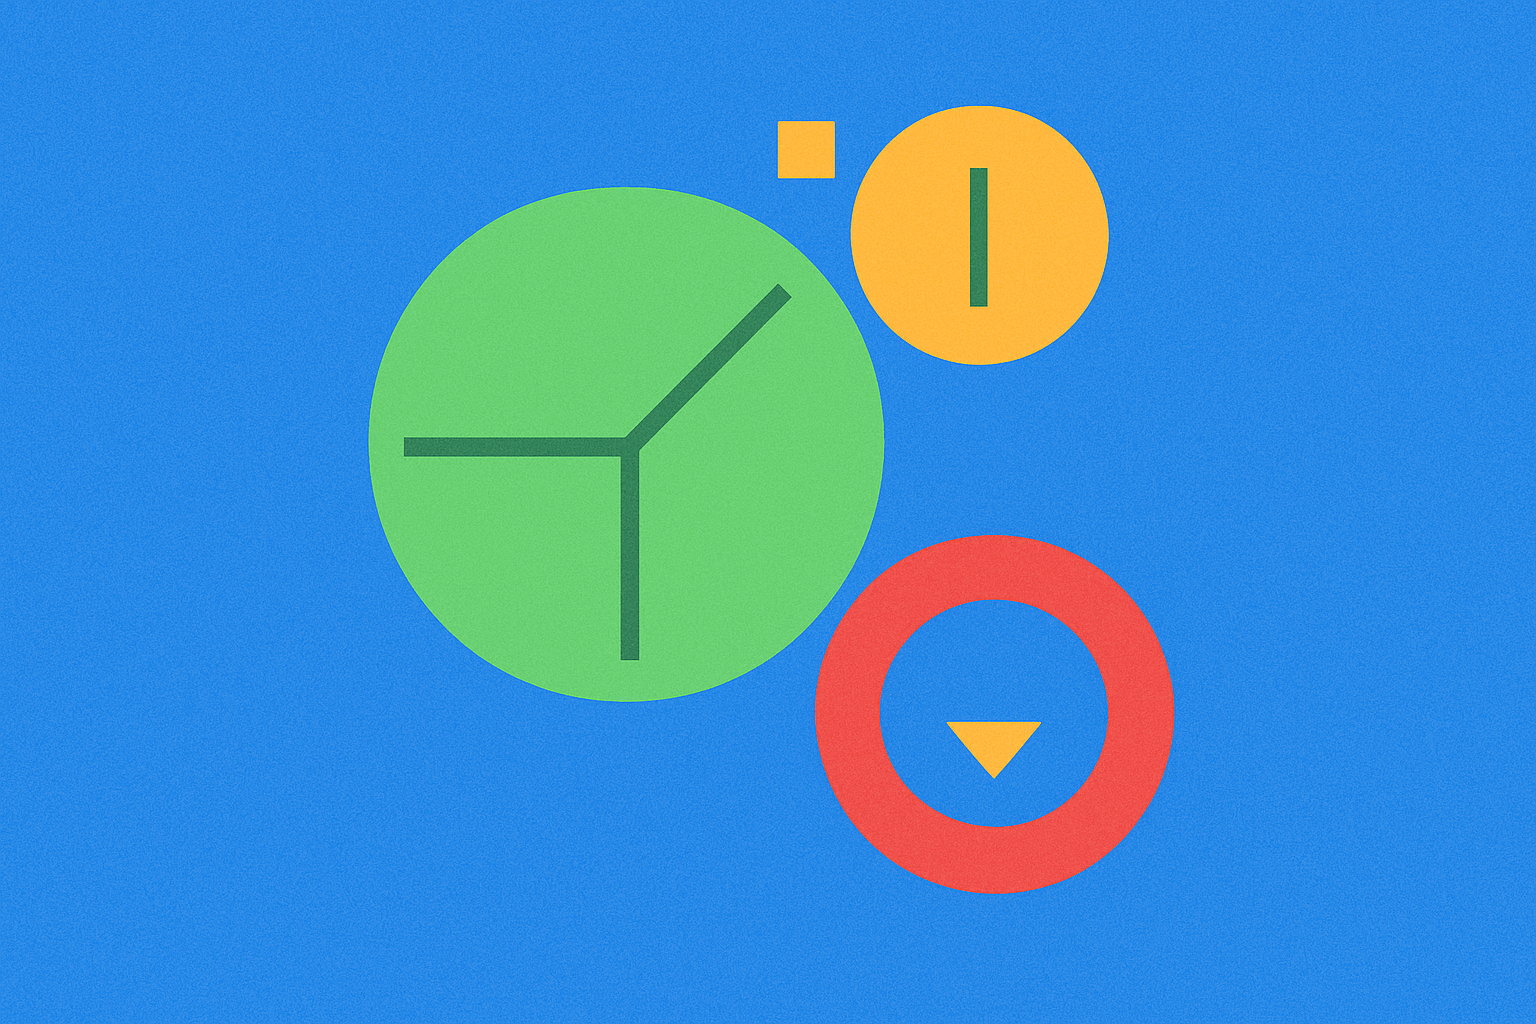
Japanese candlesticks are among the most powerful tools in technical analysis, offering deep insights into market trends, price momentum, and potential reversal zones. Originating in Japan, traders first developed candlestick techniques to forecast rice price movements; over time, these evolved into a cornerstone of modern technical analysis. By mastering various candlestick patterns, novice traders can more accurately identify potential trading opportunities. This guide highlights the four essential candlestick patterns every trader should know.

Hammer Candlestick – Bullish Signal

The hammer candlestick is a key bullish reversal pattern trusted by technical analysts. It forms at the end of a strong downtrend and signals a potential price reversal to the upside. The hammer features a very long lower shadow and a relatively small real body at the top, indicating that buyers are regaining market control after sustained selling pressure. The longer the lower shadow relative to the body, the stronger and more reliable the bullish signal. For confirmation, it is best to wait until the next candlestick closes above the hammer’s body.

Hanging Man Candlestick – Bearish Signal

While visually similar to the hammer, the hanging man candlestick signals the opposite. This pattern appears after a strong uptrend and indicates a potential price decline and trend reversal. The hanging man shares the hammer’s distinctive long lower shadow and small body, but its appearance at the end of an uptrend highlights weakening buyers and a loss of upward momentum, suggesting the onset of distribution and price correction. Technical analysts give this pattern significant weight when considering sell decisions.

Bullish Engulfing Candlestick – Buying Momentum

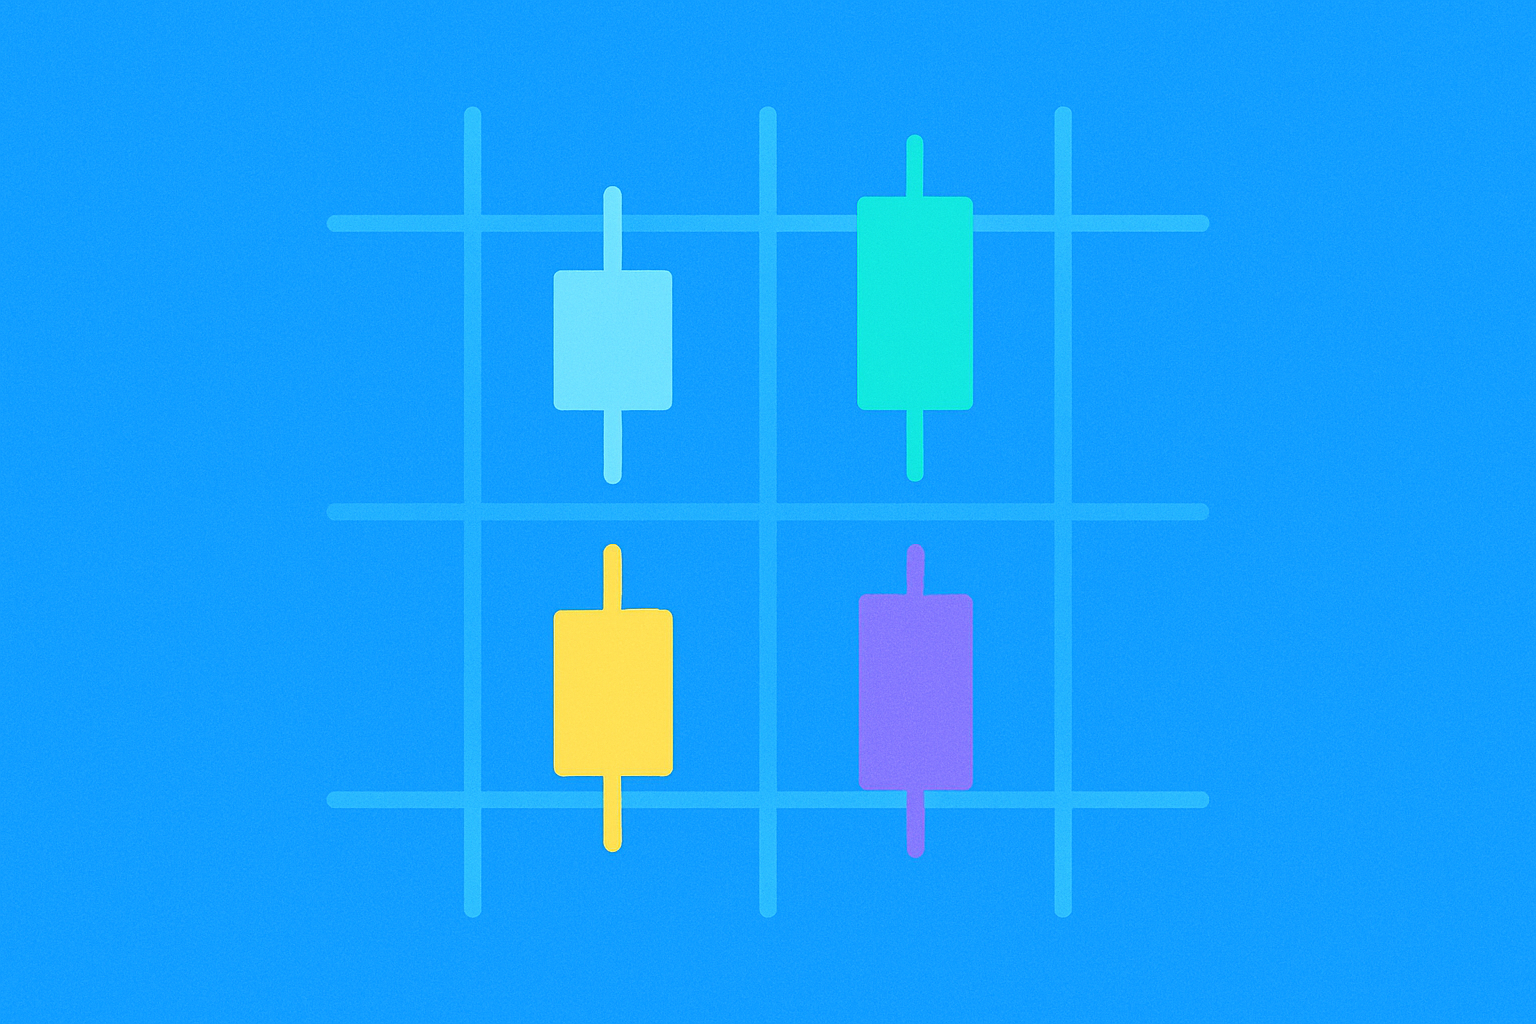
The bullish engulfing pattern is one of the strongest signals of a shift toward buyer dominance. It consists of two consecutive candlesticks: the second (green/bullish) completely engulfs the first (red/bearish). This means the second candle’s close is above the first candle’s open, and its open is below the first candle’s close. The bigger and more forceful the green candle, the stronger and more reliable the bullish signal. This pattern demonstrates that buyers have seized control, and an upward trend is likely to continue.

Bearish Engulfing Candlestick – Selling Momentum

The bearish engulfing pattern is the bearish counterpart to the bullish engulfing, signaling a decisive market shift in favor of sellers. It also consists of two consecutive candles, with the second (red/bearish) fully engulfing the first (green/bullish). This develops when price drops sharply at the close, reflecting increased selling pressure and weakening buyers. Spotting this pattern after an uptrend suggests a likely correction or trend reversal. The larger and more prominent the red candle, the clearer and more reliable the bearish signal.

How to Trade Using Candlestick Patterns

Understanding candlestick patterns alone is not enough for successful trading. Never base key trading decisions solely on a single candle or pattern; always confirm signals with strong support or resistance levels. Combine candlestick patterns with other technical indicators like the Relative Strength Index (RSI) and Moving Average Convergence Divergence (MACD) for a clearer and more accurate picture of market trends. Multi-layered analysis increases the probability of successful trades and reduces risk.

Conclusion and Final Tips

Japanese candlesticks are a powerful and effective tool in technical analysis. Mastering their fundamental patterns is essential for any beginner trader aiming to enhance their skills. Success depends on continuous practice and ongoing learning—never rely on a single tool. Start by applying these patterns to historical charts, then transition gradually to live trading with strict risk management. Remember, trading demands patience and discipline, and a solid grasp of the basics is the foundation of a successful trading journey.

FAQ

What are Japanese candlesticks and what are their components?

Japanese candlesticks display the opening, closing, high, and low prices for a specific period. Green or white candles show upward movement, while red or black indicate downward movement. Each candlestick represents price action and volatility within the selected timeframe.

How do you read the open, close, high, and low prices in Japanese candlesticks?

A green candlestick signals the price rose from open to close; a red candle indicates a decline. The upper wick marks the highest price, while the lower wick marks the lowest price during the period.

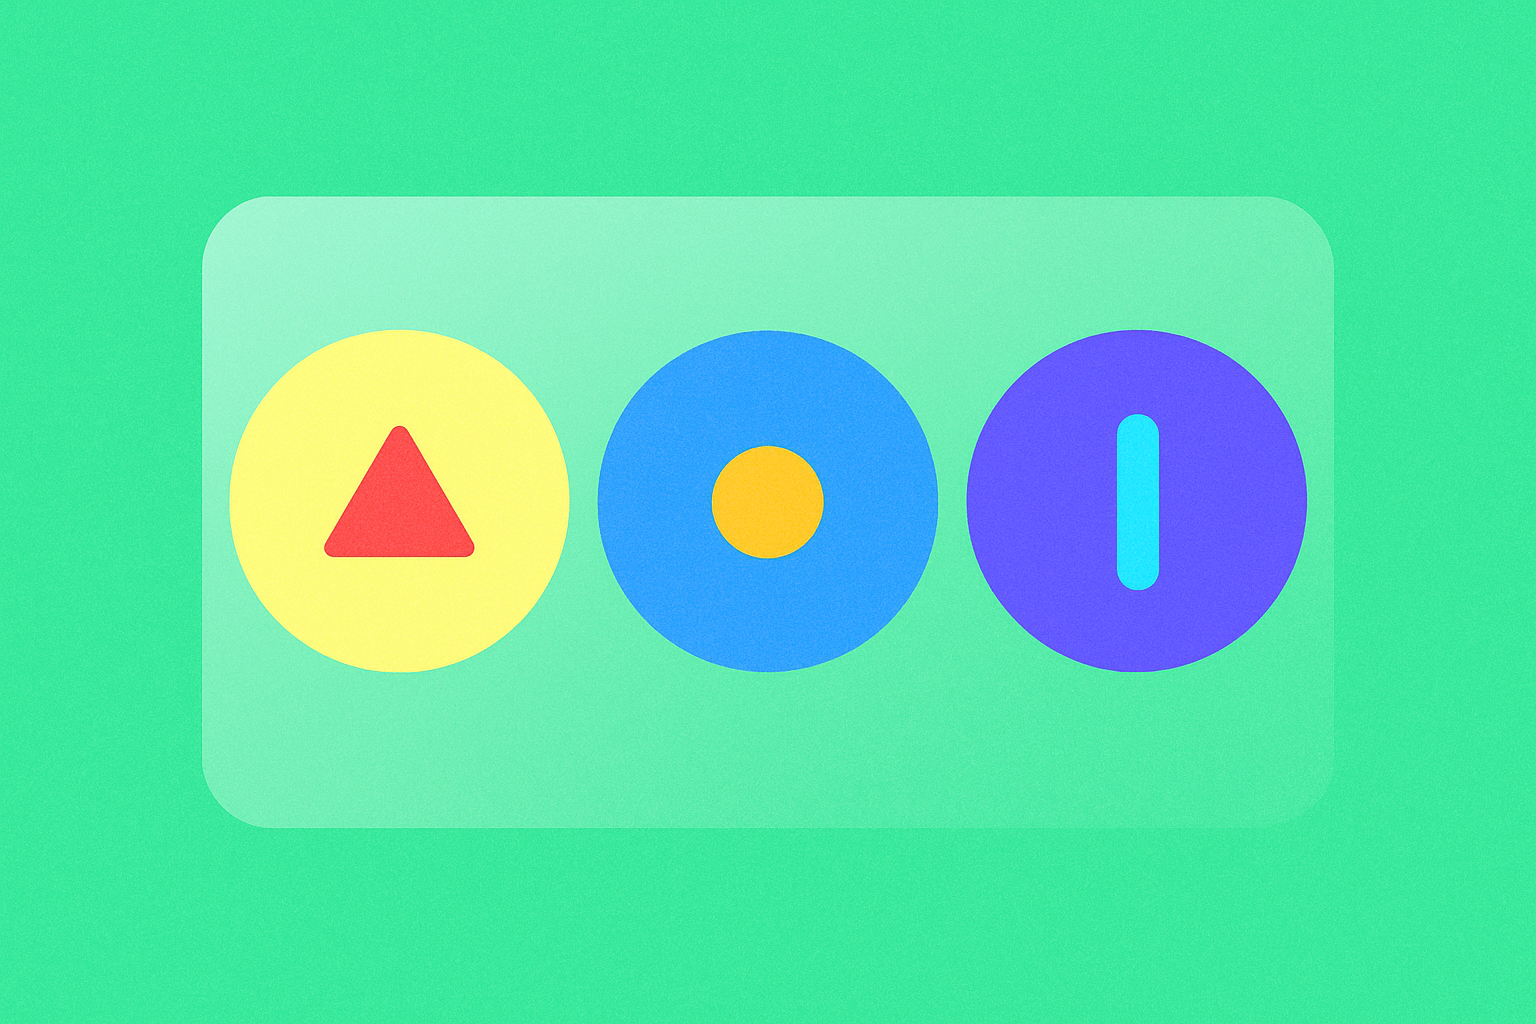
What are common Japanese candlestick shapes and what trading signals do they represent?

Common shapes include the doji star (market indecision), engulfing patterns (potential reversal), hammer (possible bottom), and shooting star (potential top). Each pattern provides traders with key signals about future market direction.

How are candlestick shapes like the hammer, hanging man, and engulfing patterns applied in trading?

Traders use these patterns to pinpoint reversal zones and assess shifts in the balance between buyers and sellers, helping them make more precise decisions based on market signals.

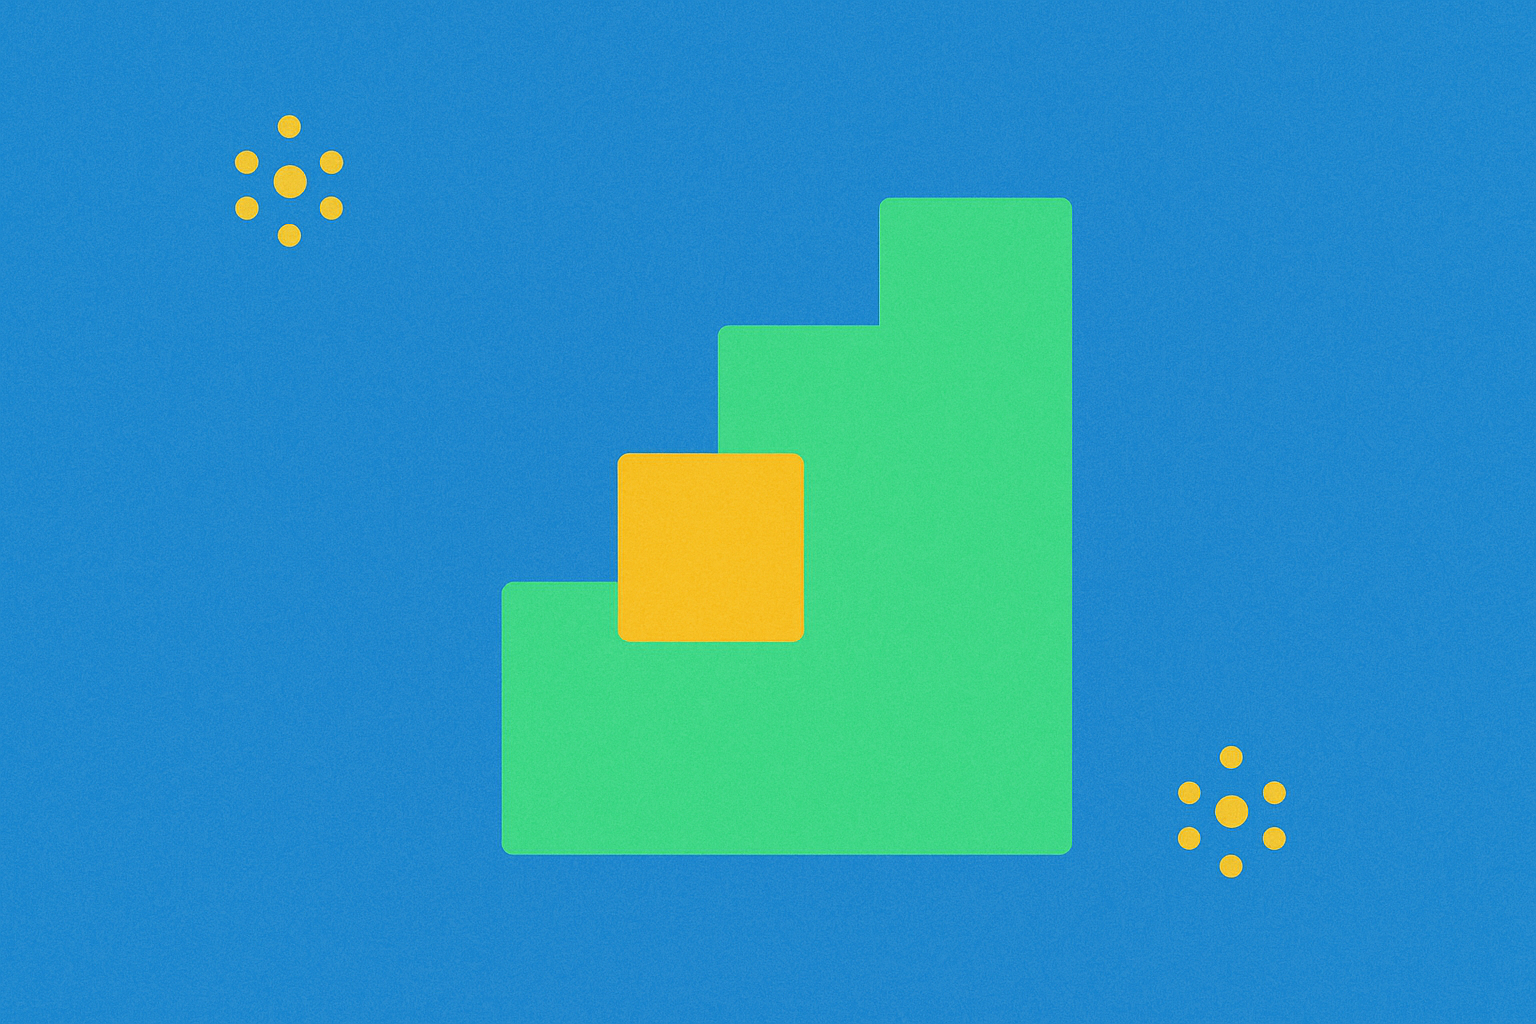
How can you use Japanese candlesticks to identify trends and analyze support and resistance?

Use candlestick patterns to spot trends and draw key support and resistance levels with horizontal lines. Monitor how candlesticks behave at these levels to confirm future price movements and refine trading decisions.

What’s the difference in analyzing Japanese candlesticks across different timeframes (daily, hourly, minutes)?

Candlestick analysis changes with the timeframe: daily candles show broader moves and long-term trends, while hourly and minute candles reveal shorter-term action and are more responsive to rapid market changes.

* The information is not intended to be and does not constitute financial advice or any other recommendation of any sort offered or endorsed by Gate.
Related Articles
Trading Simulator: The Complete Guide to Paper, Backtests, and Live Drills

Trading Simulator: The Complete Guide to Paper, Backtests, and Live Drills

Before risking real funds, smart traders pressure-test their edge in a simulator. Here’s how to choose one, set it up properly, and use it to turn ideas into a repeatable, data-driven playbook.
2025-08-28 04:52:30
TP Means in Trading: How Take Profit Orders Work

TP Means in Trading: How Take Profit Orders Work

The article elucidates the importance of Take Profit (TP) orders in trading, focusing on risk management and gain security. It addresses the needs of traders looking to optimize their profit structure, particularly in volatile markets. Key methods discussed include ATR, Fibonacci, and support/resistance levels for strategic TP setting. It explores advanced strategies for cryptocurrency traders such as trailing TPs and machine learning applications. The piece also emphasizes the 1:2 risk-reward ratio, aiding traders in balancing TP and stop loss orders for sustainable success.
2025-09-12 17:30:21
Beginner's Guide to Laddering Trading: A Step-by-Step Profit Strategy

Beginner's Guide to Laddering Trading: A Step-by-Step Profit Strategy

This comprehensive guide on the laddering trading strategy offers a structured profit approach, breaking down large orders into smaller components for entry/exit at various price levels. It emphasizes core advantages like price averaging, risk management, and slippage avoidance, especially valuable for volatile markets. Readers will learn to implement buy/sell laddering methods, analyze market dynamics, and adapt strategies for optimal execution. The article addresses challenges like missed opportunities and whipsaws, providing strategies for various trader risk profiles and objectives. It is ideal for traders seeking a disciplined, risk-conscious trading framework.
2025-12-22 16:58:29
What is a Liquidity Sweep

What is a Liquidity Sweep

This article provides a comprehensive overview of liquidity sweeps in cryptocurrency trading, emphasizing their role as a strategic tool for market makers to influence prices. It addresses the challenges of detecting these phenomenons and offers insights into market dynamics for both novice and experienced traders. Key topics include understanding the mechanics of liquidity sweeps, their impact on market volatility and sentiment, and how traders can protect their portfolios through effective risk management and diversification. Geared towards crypto traders using Gate, the article integrates SEO-friendly terms like "liquidity sweeps," "market manipulation," and "crypto trading strategies" to facilitate reader understanding.
2025-07-17 08:59:37
Doji Candle Explained

Doji Candle Explained

This guide empowers Aussie crypto traders to master Doji candlestick patterns. A Doji, signaling market indecision, forms when opening and closing prices are almost identical. We cover the Standard, Long-Legged, Gravestone, and Dragonfly Doji, explaining their implications for trend reversals or volatility. The article highlights Dojis' importance in risk management and their applicability across markets like BTC/AUD, ETH/AUD, and meme coins. It also advises on common mistakes and provides FAQs, emphasizing Dojis as a crucial tool for informed trading decisions.
2025-07-03 13:31:09
Heikin-Ashi Charts Most Underrated Tool

Heikin-Ashi Charts Most Underrated Tool

Crypto trading moves fast. One minute Bitcoin is pumping, the next, it’s down 5%. For many traders, traditional candlestick charts often create confusion with mixed signals and short-term noise. That’s where Heikin-Ashi charts come in—a powerful but often overlooked tool that helps filter out volatility and focus on the bigger trend.
2025-07-18 09:23:54
Recommended for You
How Does BONK Compare to Pump.Fun and Believe in the Solana Meme Coin Market?

How Does BONK Compare to Pump.Fun and Believe in the Solana Meme Coin Market?

# How Does BONK Compare to Pump.Fun and Believe in the Solana Meme Coin Market? This comprehensive analysis examines three leading Solana meme coin platforms—BONK, Pump.Fun, and Believe—comparing their market positions, revenue models, and competitive strategies. BONK dominates with $190M daily revenue through robust ecosystem infrastructure and community-driven governance, while Pump.Fun maintains 91% market share in token listings via aggressive buyback mechanisms. The article explores differentiation strategies, market share dynamics shaped by first-mover advantage, and practical investment guidance for traders on Gate. Designed for both beginners and experienced investors, this guide clarifies liquidity metrics, volatility risks, and selection criteria for navigating Solana's meme coin landscape with confidence.
2026-01-06 10:30:35
What Is Token Economics Model: KAS Distribution, Inflation Mechanism & DAO Governance Explained

What Is Token Economics Model: KAS Distribution, Inflation Mechanism & DAO Governance Explained

# Article Introduction Kaspa's token economics model demonstrates a revolutionary approach to blockchain sustainability through three pillars: zero pre-allocation fair launch eliminating insider advantages, deflationary supply mechanics capping KAS at 28.7 billion tokens, and DAO governance empowering community-driven decisions. This guide addresses critical questions for Layer-1 investors and ecosystem participants—how equitable token distribution impacts project trustworthiness, why supply caps matter for long-term value preservation, and how decentralized governance balances community participation with operational efficiency. By exploring KAS distribution mechanisms, inflation control through scheduled halvings, and reputation-based voting systems, readers gain actionable insights into evaluating tokenomics sustainability and identifying advantages over traditional blockchain models like Bitcoin and Ethereum. Whether trading on Gate or participating as a network validator, understanding these economic fu
2026-01-06 10:25:08
How Do Kaspa (KAS) On-Chain Metrics Predict Price Movements in 2026?

How Do Kaspa (KAS) On-Chain Metrics Predict Price Movements in 2026?

# How Do Kaspa (KAS) On-Chain Metrics Predict Price Movements in 2026? This comprehensive guide analyzes Kaspa's critical on-chain metrics to forecast price dynamics through 2026, serving crypto investors, traders, and network analysts seeking data-driven insights. The article examines five core indicators: active address growth among 349,000+ holders, daily transaction volume patterns across 591+ million transactions, whale concentration dynamics with top 1,000 addresses controlling 59.98% supply, mining economics generating $80 daily rewards, and BlockDAG algorithm efficiency. By correlating unmoved supply records (61.65%), weekly whale accumulation (64.97M tokens), and transaction spikes with price movements, this guide equips readers to identify early signals of market direction before mainstream recognition. Whether monitoring liquidity depth on Gate, tracking holder distribution shifts, or evaluating mining incentive structures, these on-chain metrics provide actionable frameworks for predicting KAS va
2026-01-06 10:23:11
What does on-chain data analysis reveal about Render's whale movements and active addresses in 2026?

What does on-chain data analysis reveal about Render's whale movements and active addresses in 2026?

# Article Overview: Render Network On-Chain Analysis 2026 **On-chain data reveals Render Network's strengthening fundamentals through surging active addresses, strategic whale accumulation, and improved network efficiency in 2026.** This analysis examines three critical metrics: expanding active addresses and node operators demonstrating genuine ecosystem adoption; whale positioning patterns showing institutional conviction ahead of the $1.90 resistance level; and transaction volume growth paired with declining fees indicating protocol maturation. Designed for RNDR investors, traders, and cryptocurrency analysts, this article decodes behavioral signals that historically precede significant price expansion. The research clarifies how large holders accumulate during market corrections, reducing exchange supply while strengthening long-term positioning. By connecting on-chain metrics to market sentiment, readers gain actionable intelligence for evaluating Render's GPU computing potential and identifying optimal
2026-01-06 10:21:00
What is PEPE coin's fundamental analysis: white paper logic, use cases, and team background explained

What is PEPE coin's fundamental analysis: white paper logic, use cases, and team background explained

# PEPE Coin Fundamental Analysis: White Paper Logic, Use Cases, and Team Background This comprehensive guide examines PEPE coin's core fundamentals through three critical dimensions. First, the white paper analysis reveals a 420.69 trillion token supply creating mathematical impossibilities—requiring $420.69 trillion market cap for $1 valuation, exposing pure speculation without intrinsic value. Second, the use case overview demonstrates PEPE operates as a sentiment-driven meme coin, with viral social media marketing generating 30% price surges rather than utility-based adoption. Third, the team background assessment highlights anonymous developers, absent roadmaps, and historical insider token dumps, presenting 80% drawdown risks typical of speculative assets. This analysis serves investors and traders on Gate seeking transparent PEPE coin risk evaluation, providing essential due diligence before entering this volatile market segment. --- **Key Topics Covered:** Token supply economics | White paper archit
2026-01-06 10:17:43
What is tokenomics: token distribution, inflation mechanisms, and governance rights explained

What is tokenomics: token distribution, inflation mechanisms, and governance rights explained

# Article Introduction Tokenomics fundamentally shapes cryptocurrency project sustainability and value creation through three critical mechanisms: token distribution, inflation design, and governance frameworks. This comprehensive guide examines how successful projects like PEPE allocate tokens strategically—concentrating 93.1% in liquidity pools while constraining team holdings to 6.9%—and implement deflationary mechanisms including 1% transaction burns to enhance scarcity. Readers will discover how decentralized governance empowers token holders as active stakeholders, balanced vesting schedules prevent dilution risks, and transparent economic models distinguish healthy projects from those with concerning red flags. Whether you're an investor evaluating project fundamentals, a trader on Gate, or a developer designing sustainable tokenomics, this article provides actionable frameworks for assessing long-term viability and community alignment in crypto ecosystems.
2026-01-06 10:15:52