FTT vs STX: The Battle of Cryptocurrency Exchanges Shakes the Digital Asset Market
Introduction: FTT vs STX Investment Comparison
In the cryptocurrency market, the comparison between FTT vs STX has always been an unavoidable topic for investors. The two not only have significant differences in market cap ranking, application scenarios, and price performance, but also represent different crypto asset positioning.
FTT (FTT): Since its launch in 2019, it has gained market recognition as the native token of the FTX exchange ecosystem.
STX (STX): Introduced in 2019, it has been hailed as a new decentralized internet platform, aiming to empower users with better control over their data.
This article will comprehensively analyze the investment value comparison between FTT and STX, focusing on historical price trends, supply mechanisms, institutional adoption, technological ecosystems, and future predictions, attempting to answer the question investors care about most:
"Which is the better buy right now?"
I. Price History Comparison and Current Market Status
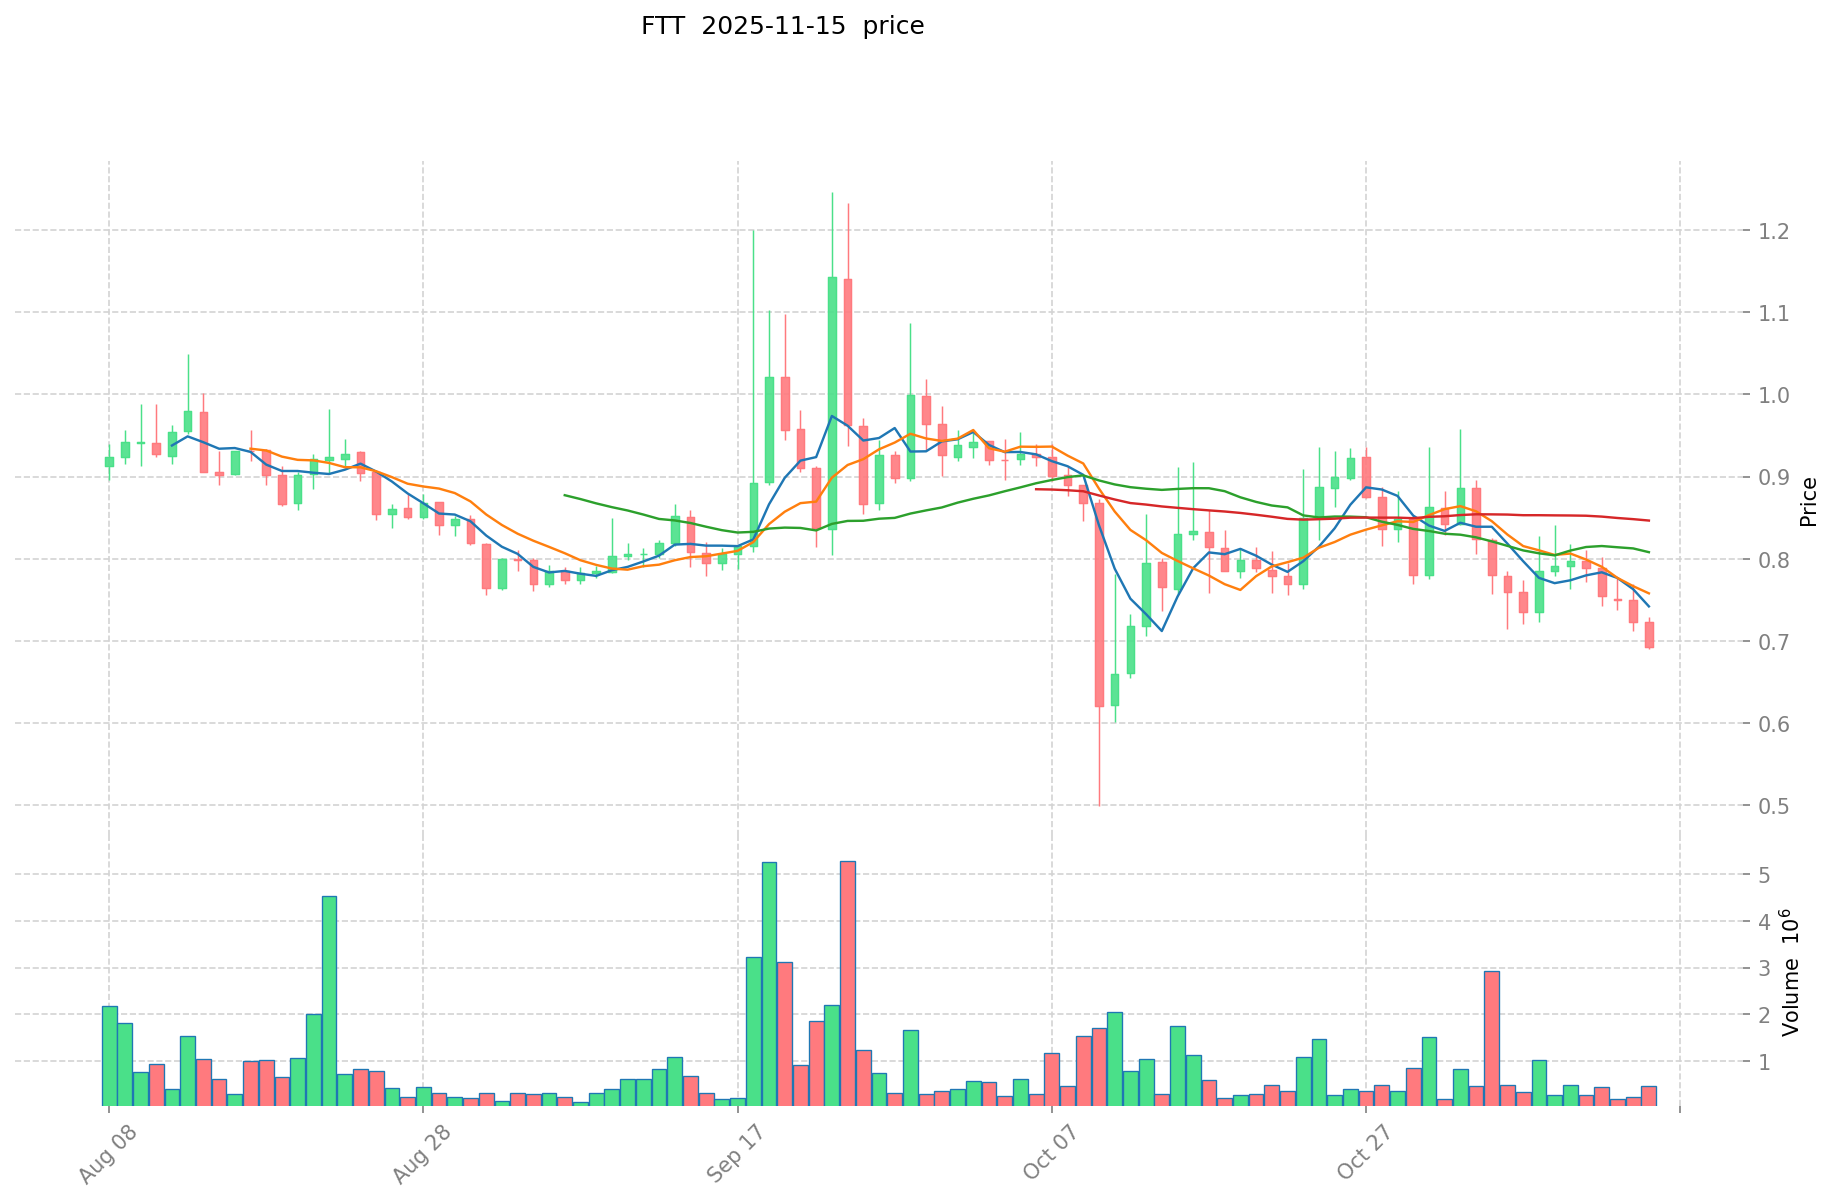
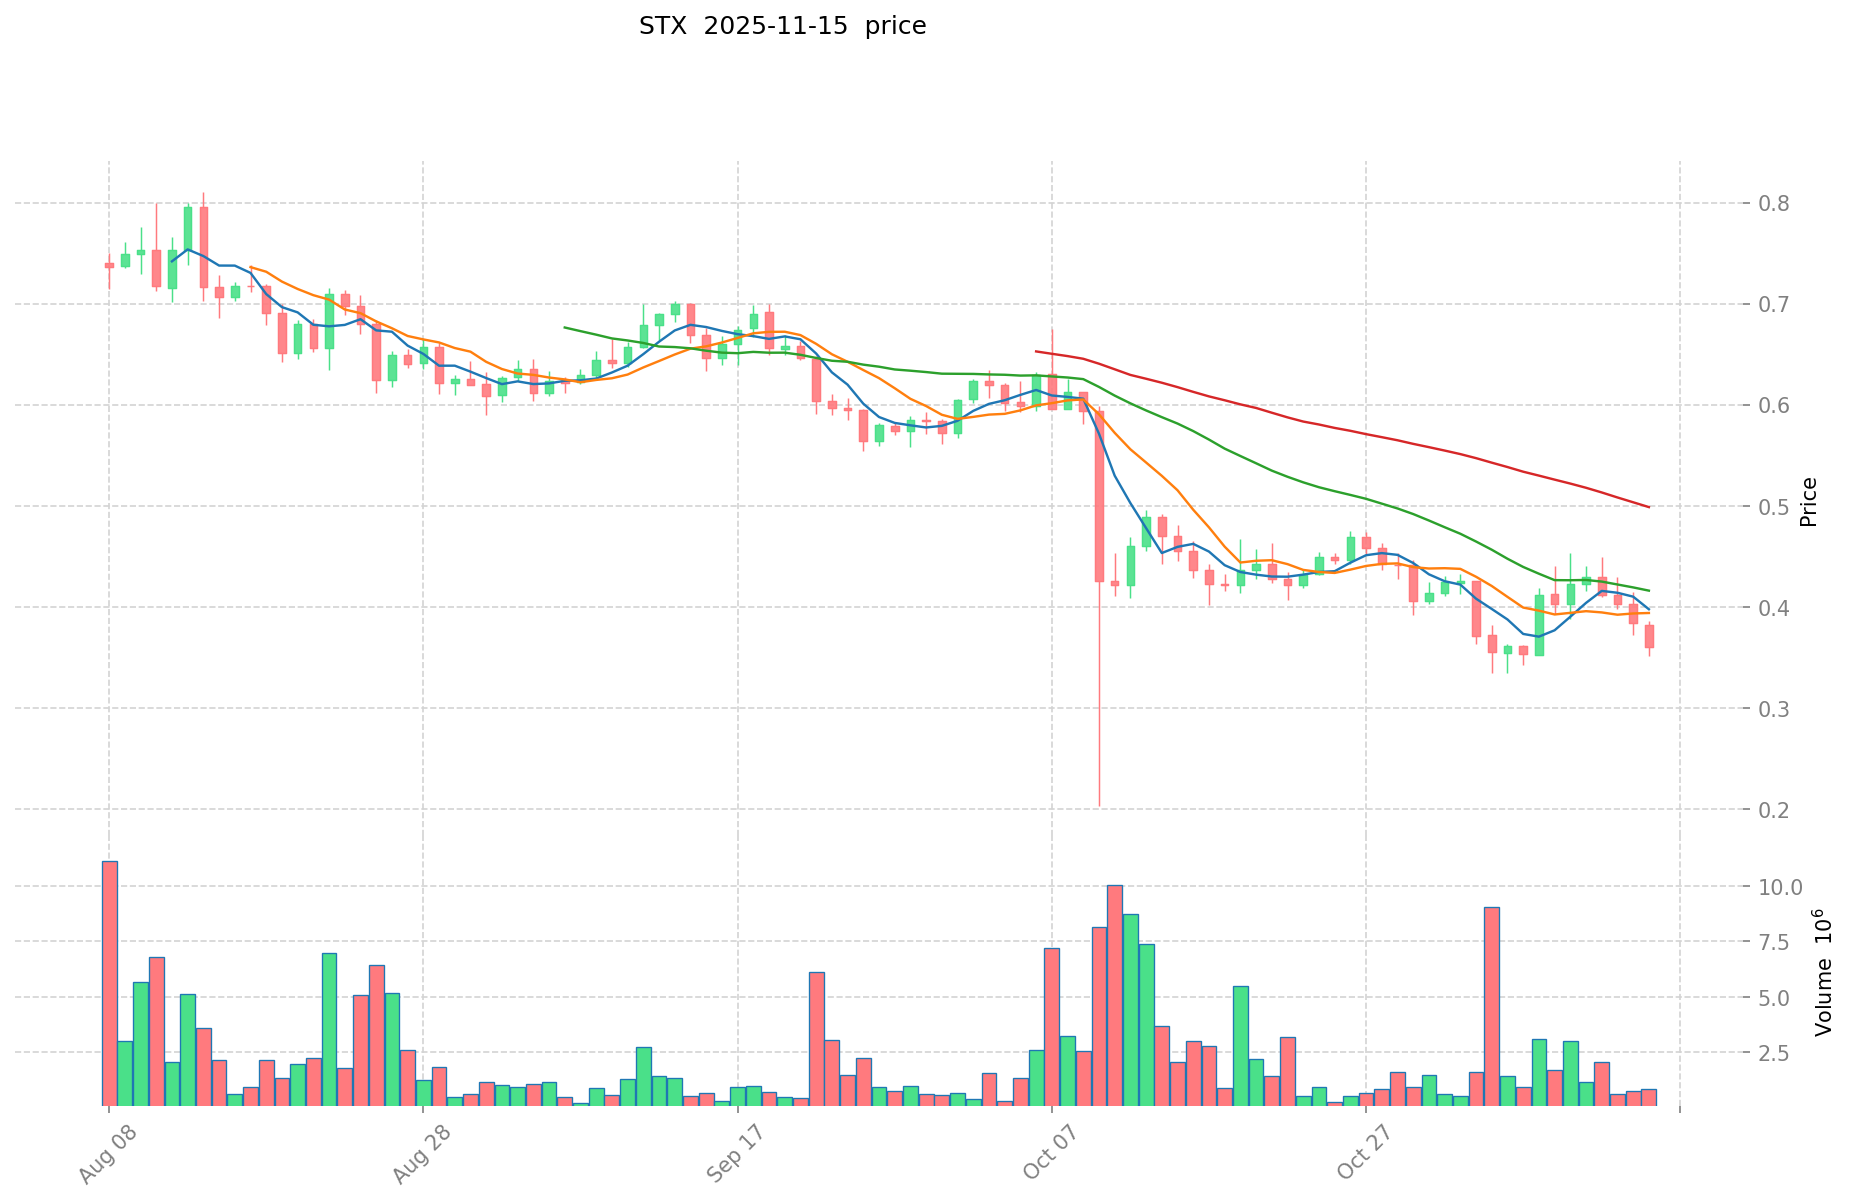
FTT (Coin A) and STX (Coin B) Historical Price Trends
- 2021: FTT reached its all-time high of $84.18 on September 10, 2021.
- 2024: STX hit its all-time high of $3.86 on April 1, 2024.
- Comparative analysis: FTT has fallen from its peak of $84.18 to a current price of $0.7048, while STX has declined from its high of $3.86 to $0.3585.
Current Market Situation (2025-11-16)
- FTT current price: $0.7048
- STX current price: $0.3585
- 24-hour trading volume: FTT $121,250.98 vs STX $298,504.30
- Market Sentiment Index (Fear & Greed Index): 10 (Extreme Fear)
Click to view real-time prices:
- View FTT current price Market Price
- View STX current price Market Price
II. Core Factors Affecting Investment Value of FTT vs STX
Supply Mechanism Comparison (Tokenomics)
- FTT: FTX Token has a maximum supply cap of 352 million tokens, with a deflationary model through regular burn events. The token burn mechanism originally used 33% of trading fees from the FTX exchange to repurchase and destroy tokens.
- STX: Stacks has a maximum supply of approximately 1.818 billion STX tokens, with an annual inflation rate decreasing over time. New STX is created through mining which is linked to Bitcoin's blockchain.
- 📌 Historical pattern: Deflationary models like FTT's have historically created price pressure during bull markets, while STX's mining rewards being tied to Bitcoin creates cyclical alignment with Bitcoin halvings.
Institutional Adoption and Market Applications
- Institutional holdings: STX appears to have greater institutional interest following FTX's collapse, as FTT has been largely abandoned by institutions after the exchange's bankruptcy.
- Enterprise adoption: STX has gained traction with Bitcoin-focused enterprises looking to build applications on Bitcoin, while FTT's utility was primarily limited to the now-defunct FTX exchange ecosystem.
- Regulatory attitudes: FTT faces severe regulatory scrutiny and legal challenges due to the FTX fraud case, while STX benefits from clearer regulatory positioning as a decentralized protocol for Bitcoin applications.
Technical Development and Ecosystem Building
- FTT technical upgrades: Development has effectively ceased following the collapse of FTX exchange.
- STX technical development: Ongoing development includes Nakamoto release to increase transaction throughput, Bitcoin L2 capabilities, and improved smart contract functionality for Bitcoin.
- Ecosystem comparison: STX supports a growing DeFi and NFT ecosystem built around Bitcoin, while FTT's ecosystem has collapsed with the FTX exchange bankruptcy.
Macroeconomic Factors and Market Cycles
- Inflation performance: STX potentially inherits some of Bitcoin's inflation-resistant properties due to its connection to Bitcoin, while FTT has no meaningful inflation resistance given its compromised status.
- Macroeconomic monetary policy: Interest rate changes and USD strength appear to affect STX similarly to Bitcoin, while FTT price movements are now primarily driven by bankruptcy proceedings rather than market factors.
- Geopolitical factors: STX benefits from Bitcoin's global adoption and cross-border utility, while FTT has little remaining utility in cross-border transactions.
III. 2025-2030 Price Prediction: FTT vs STX
Short-term Prediction (2025)
- FTT: Conservative $0.64768 - $0.704 | Optimistic $0.704 - $0.93632
- STX: Conservative $0.218929 - $0.3589 | Optimistic $0.3589 - $0.470159
Mid-term Prediction (2027)
- FTT may enter a growth phase, with estimated price range $0.879047488 - $1.012815584
- STX may enter a growth phase, with estimated price range $0.2608219614 - $0.5417071506
- Key drivers: Institutional capital inflow, ETF, ecosystem development
Long-term Prediction (2030)
- FTT: Base scenario $0.684055798311424 - $1.2215282112704 | Optimistic scenario $1.2215282112704 - $1.502479699862592
- STX: Base scenario $0.436096406036491 - $0.63202377686448 | Optimistic scenario $0.63202377686448 - $0.834271385461113
Disclaimer
FTT:
| 年份 | 预测最高价 | 预测平均价格 | 预测最低价 | 涨跌幅 |
|---|---|---|---|---|
| 2025 | 0.93632 | 0.704 | 0.64768 | 0 |
| 2026 | 1.0908128 | 0.82016 | 0.5084992 | 16 |
| 2027 | 1.012815584 | 0.9554864 | 0.879047488 | 35 |
| 2028 | 1.29907930944 | 0.984150992 | 0.89557740272 | 39 |
| 2029 | 1.3014412718208 | 1.14161515072 | 0.8219629085184 | 62 |
| 2030 | 1.502479699862592 | 1.2215282112704 | 0.684055798311424 | 73 |
STX:
| 年份 | 预测最高价 | 预测平均价格 | 预测最低价 | 涨跌幅 |
|---|---|---|---|---|
| 2025 | 0.470159 | 0.3589 | 0.218929 | 0 |
| 2026 | 0.58863189 | 0.4145295 | 0.252862995 | 15 |
| 2027 | 0.5417071506 | 0.501580695 | 0.2608219614 | 39 |
| 2028 | 0.563375436624 | 0.5216439228 | 0.328635671364 | 45 |
| 2029 | 0.72153787401696 | 0.542509679712 | 0.4611332277552 | 51 |
| 2030 | 0.834271385461113 | 0.63202377686448 | 0.436096406036491 | 76 |
IV. Investment Strategy Comparison: FTT vs STX
Long-term vs Short-term Investment Strategy
- FTT: Suitable for high-risk investors focused on potential recovery scenarios
- STX: Suitable for investors interested in Bitcoin ecosystem growth and decentralized applications
Risk Management and Asset Allocation
- Conservative investors: FTT: 0% vs STX: 5-10%
- Aggressive investors: FTT: 1-2% vs STX: 10-15%
- Hedging tools: Stablecoin allocation, options, cross-currency portfolios
V. Potential Risk Comparison
Market Risk
- FTT: Extreme volatility due to ongoing bankruptcy proceedings and legal issues
- STX: Market correlation with Bitcoin and overall crypto market sentiment
Technical Risk
- FTT: Lack of ongoing development, potential for complete loss of value
- STX: Scalability challenges, network stability during upgrades
Regulatory Risk
- Global regulatory policies have significantly different impacts on FTT and STX, with FTT facing severe scrutiny due to the FTX fraud case
VI. Conclusion: Which Is the Better Buy?
📌 Investment Value Summary:
- FTT advantages: Limited upside potential in case of unexpected positive developments in bankruptcy proceedings
- STX advantages: Growing ecosystem on Bitcoin, ongoing technical development, institutional interest
✅ Investment Advice:
- Novice investors: Avoid FTT, consider small allocation to STX as part of a diversified crypto portfolio
- Experienced investors: Potentially speculate on FTT with extreme caution, focus on STX for Bitcoin ecosystem exposure
- Institutional investors: Avoid FTT, consider STX for Bitcoin-adjacent investment opportunities
⚠️ Risk Warning: The cryptocurrency market is highly volatile, and this article does not constitute investment advice. None
VII. FAQ
Q1: What are the main differences between FTT and STX? A: FTT is the native token of the defunct FTX exchange, while STX is a decentralized internet platform token. FTT has ceased development and faces legal challenges, whereas STX continues to grow its ecosystem on Bitcoin with ongoing technical development.
Q2: Which token has performed better historically? A: Historically, FTT reached a higher all-time high of $84.18 in September 2021, compared to STX's all-time high of $3.86 in April 2024. However, FTT has experienced a more significant decline due to the FTX exchange collapse.
Q3: How do the supply mechanisms of FTT and STX differ? A: FTT has a maximum supply of 352 million tokens with a deflationary model, while STX has a maximum supply of approximately 1.818 billion tokens with a decreasing annual inflation rate tied to Bitcoin mining.
Q4: What are the main risks associated with investing in FTT and STX? A: FTT faces extreme volatility and potential complete loss of value due to ongoing bankruptcy proceedings and legal issues. STX's main risks include market correlation with Bitcoin and potential scalability challenges.
Q5: Which token is considered a better investment for 2025-2030? A: Based on current factors, STX is generally considered a better investment due to its growing ecosystem, ongoing development, and institutional interest. FTT is only suitable for high-risk investors speculating on potential recovery scenarios.
Q6: How do institutional adoption and market applications compare for FTT and STX? A: STX has gained more institutional interest and adoption, particularly among Bitcoin-focused enterprises. FTT has been largely abandoned by institutions following the FTX exchange collapse.
Q7: What are the predicted price ranges for FTT and STX in 2030? A: For FTT, the base scenario predicts a range of $0.684055798311424 - $1.2215282112704, with an optimistic scenario of $1.2215282112704 - $1.502479699862592. For STX, the base scenario predicts $0.436096406036491 - $0.63202377686448, with an optimistic scenario of $0.63202377686448 - $0.834271385461113.
Share
Content
Introduction: FTT vs STX Investment Comparison
I. Price History Comparison and Current Market Status
II. Core Factors Affecting Investment Value of FTT vs STX
III. 2025-2030 Price Prediction: FTT vs STX
IV. Investment Strategy Comparison: FTT vs STX
V. Potential Risk Comparison
VI. Conclusion: Which Is the Better Buy?
VII. FAQ

