DAG vs APT: Comparing Data Flow Models for Efficient Task Scheduling in Cloud Computing
Introduction: Investment Comparison between DAG and APT
In the cryptocurrency market, the comparison between Constellation (DAG) vs Aptos (APT) has always been a topic that investors cannot avoid. The two not only have significant differences in market cap ranking, application scenarios, and price performance, but also represent different cryptocurrency asset positioning.
Constellation (DAG): Since its launch in 2018, it has gained market recognition for its distributed operating system with strong fault tolerance and horizontal scalability.
Aptos (APT): Launched in 2022, it has been hailed as a high-performance PoS Layer 1 project, focused on providing a secure and scalable Layer 1 blockchain.
This article will comprehensively analyze the investment value comparison between DAG and APT, focusing on historical price trends, supply mechanisms, institutional adoption, technological ecosystems, and future predictions, and attempt to answer the question investors care about most:
"Which is the better buy right now?"
I. Price History Comparison and Current Market Status
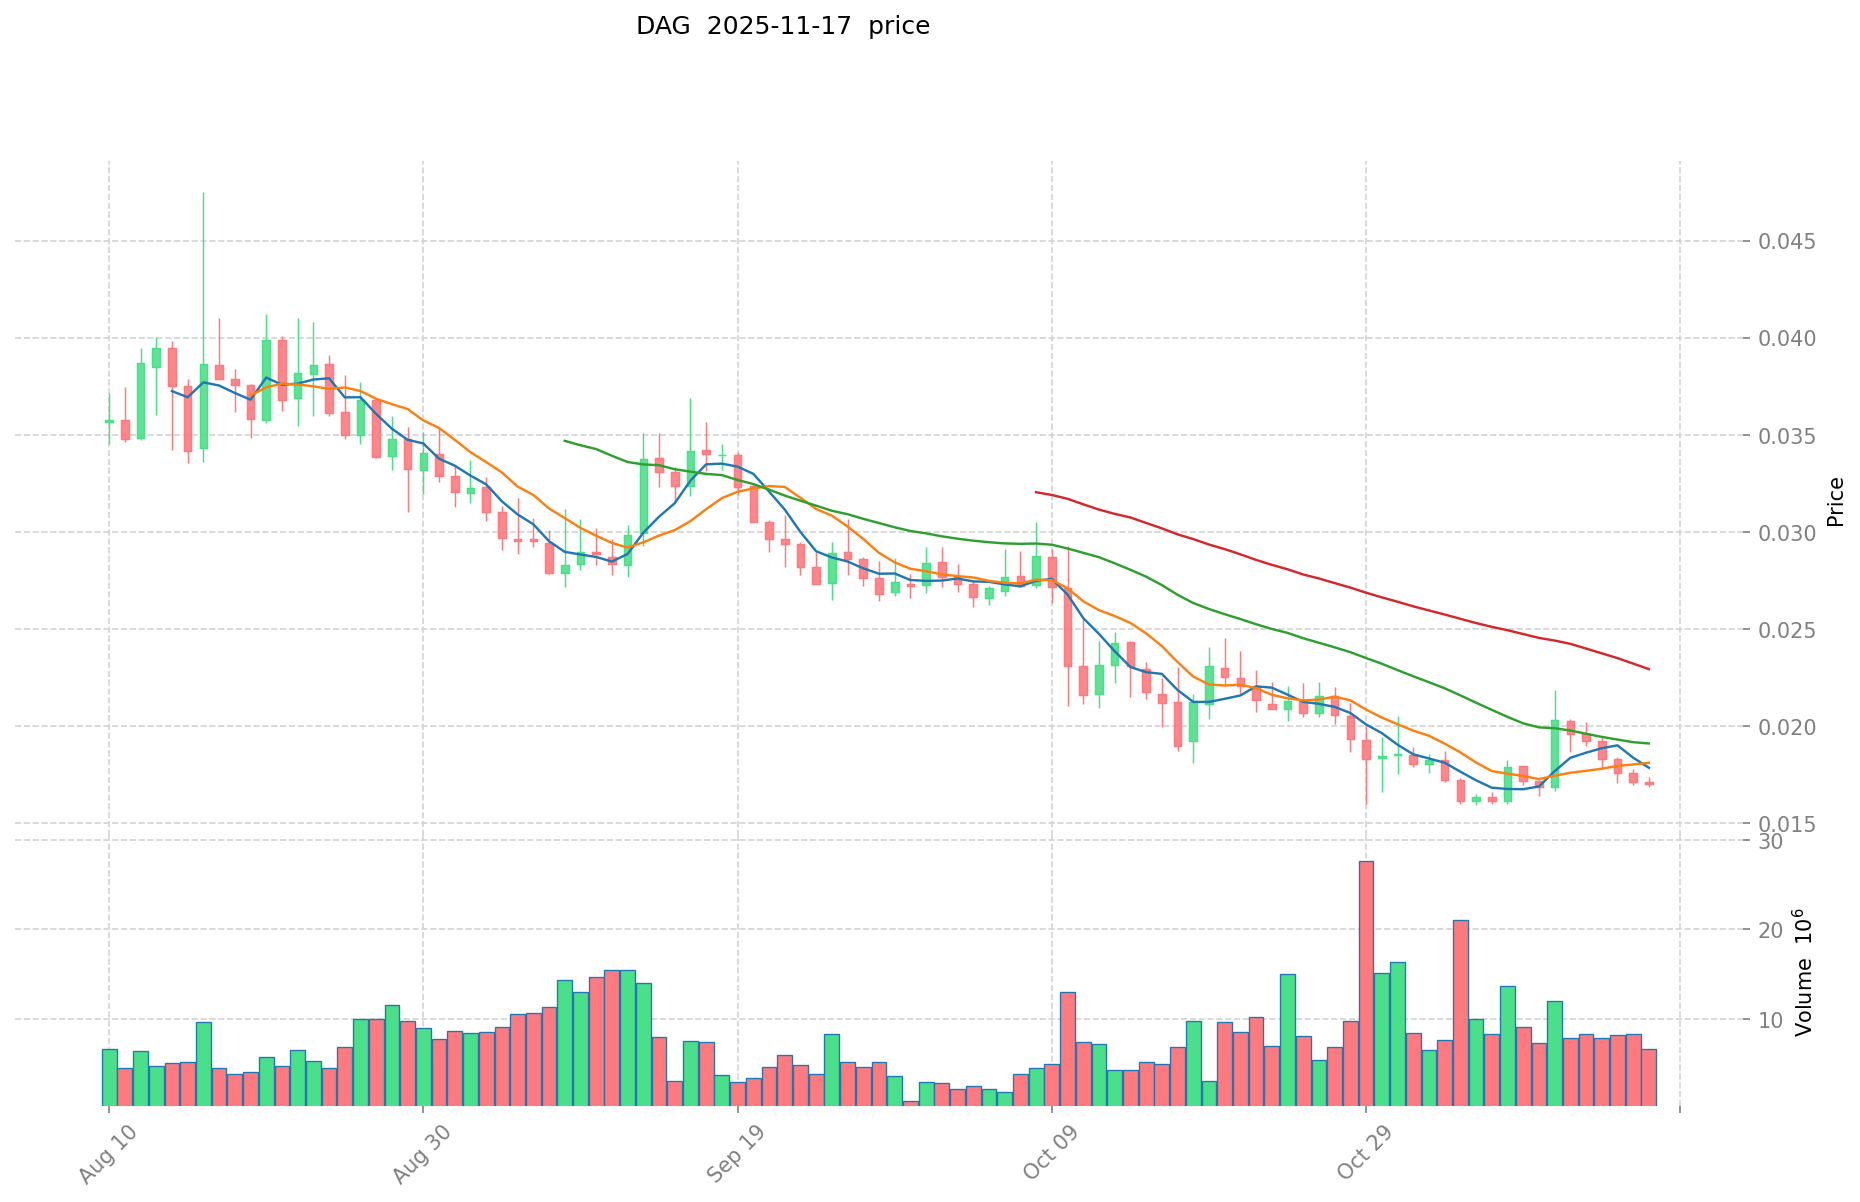
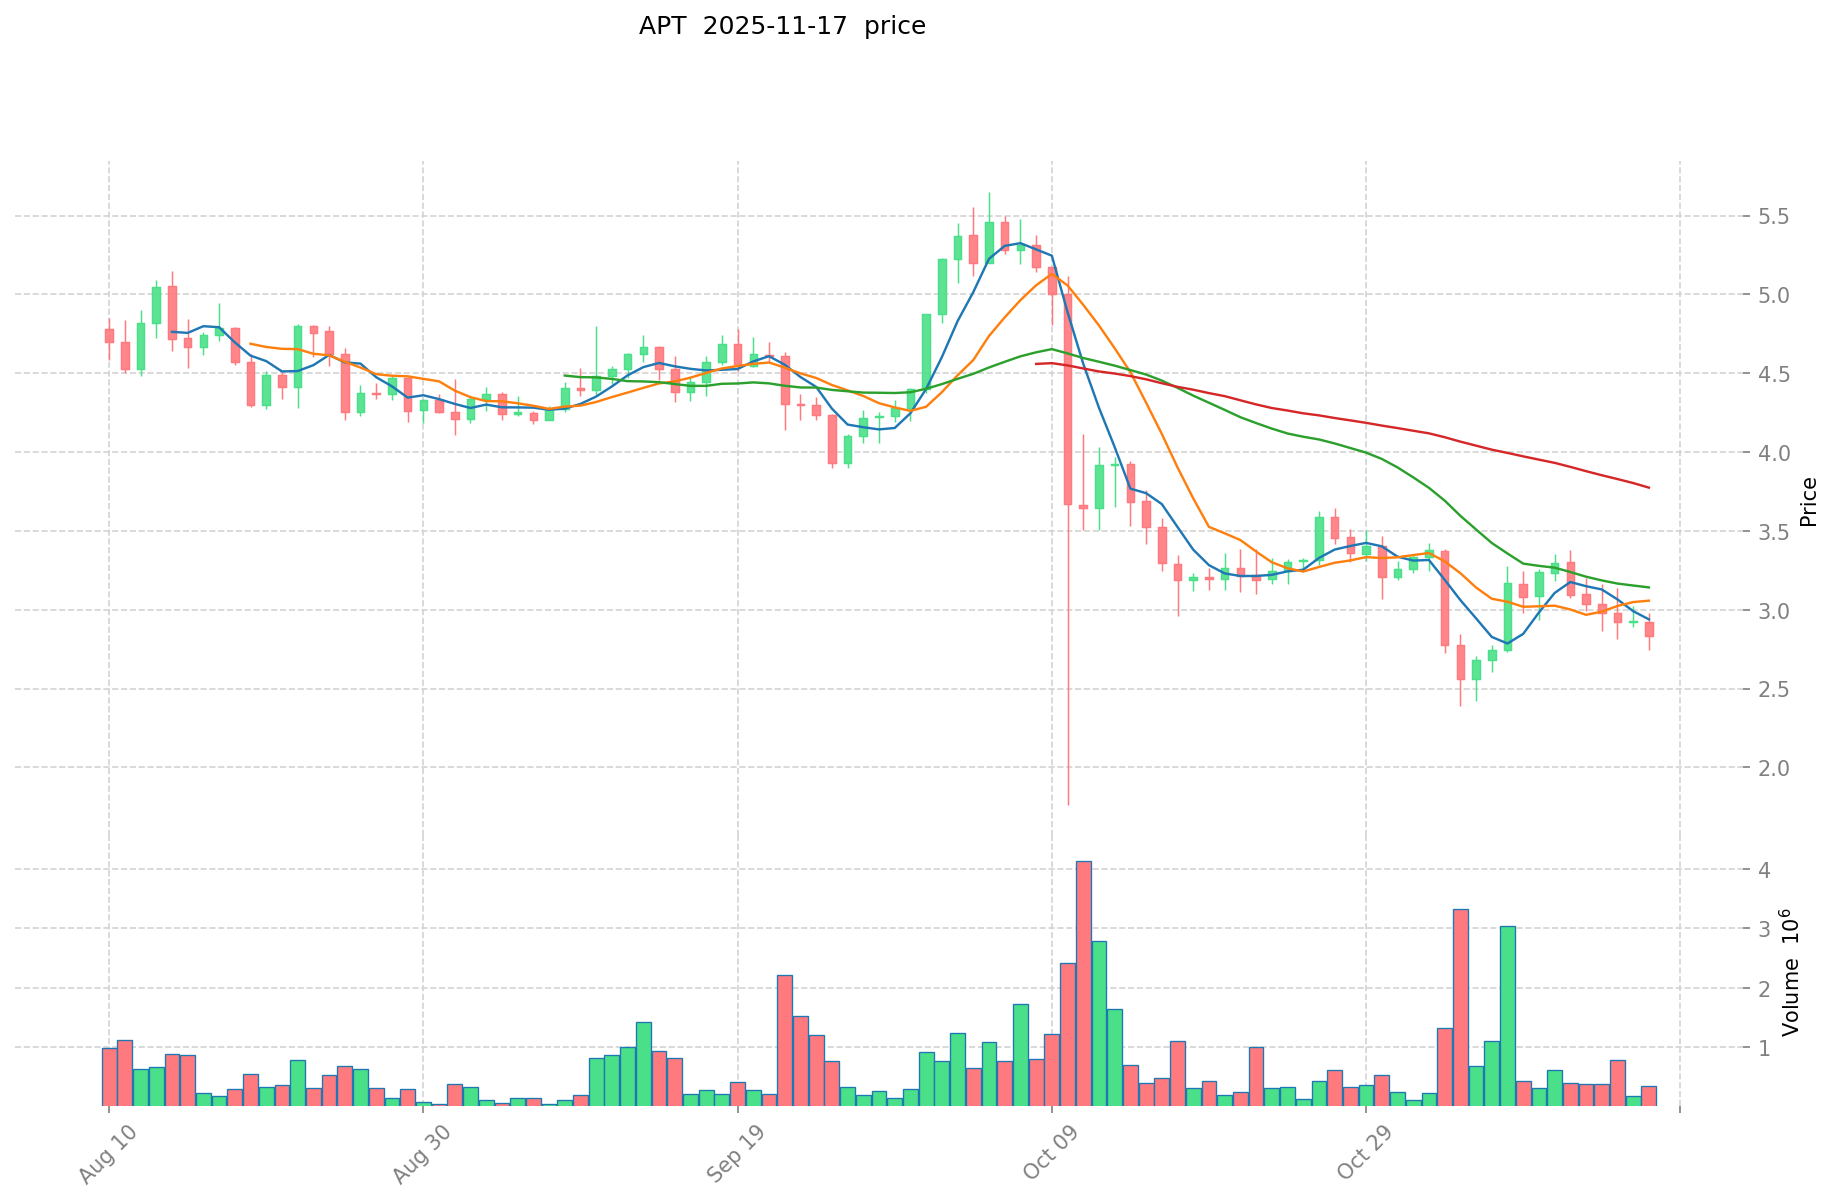
DAG (Coin A) and APT (Coin B) Historical Price Trends
- 2021: DAG reached its all-time high of $0.451761 on August 26, 2021.
- 2023: APT hit its all-time high of $19.92 on January 26, 2023.
- Comparative analysis: In the current market cycle, DAG has fallen from its all-time high of $0.451761 to a current price of $0.01699, while APT has dropped from its peak of $19.92 to $2.895.
Current Market Situation (2025-11-17)
- DAG current price: $0.01699
- APT current price: $2.895
- 24-hour trading volume: DAG $102,780.20 vs APT $1,056,379.43
- Market Sentiment Index (Fear & Greed Index): 10 (Extreme Fear)
Click to view real-time prices:
- View DAG current price Market Price
- View APT current price Market Price
II. Key Factors Affecting DAG vs APT Investment Value
Supply Mechanism Comparison (Tokenomics)
- DAG: Fixed maximum supply of 4 billion tokens with a circulating supply of approximately 1.55 billion tokens
- APT: Total supply of 1 billion tokens with inflationary model that decreases over time from 7% to eventually 3.25%
- 📌 Historical Pattern: Supply mechanisms with fixed caps (DAG) typically create scarcity-driven value over time, while APT's decreasing inflation model aims to balance growth and value preservation.
Institutional Adoption and Market Applications
- Institutional Holdings: APT appears to have stronger institutional backing with support from major VCs like a16z and FTX Ventures
- Enterprise Adoption: DAG focuses on real-world applications in supply chain management and government infrastructure, while APT targets consumer applications and developer ecosystems
- National Policies: Both projects navigate regulatory environments differently, with DAG focusing on compliant infrastructure solutions and APT positioning within Web3 innovation frameworks
Technical Development and Ecosystem Building
- DAG Technical Upgrades: Zero-knowledge integration, and development of Constellation's Hypergraph Transfer Protocol enabling interoperability
- APT Technical Development: Layer 1 blockchain using Move programming language, focusing on security, scalability and reliability through its Byzantine Fault Tolerance consensus mechanism
- Ecosystem Comparison: APT has a more developed DeFi and NFT ecosystem with strong developer tools, while DAG focuses on enterprise adoption and infrastructure applications
Macroeconomic and Market Cycles
- Inflation Environment Performance: DAG's fixed supply model positions it as a potential inflation hedge, similar to Bitcoin's value proposition
- Macroeconomic Monetary Policy: Both tokens are affected by risk asset sentiment during changing interest rate environments
- Geopolitical Factors: DAG's focus on government and enterprise infrastructure may provide stability during geopolitical uncertainty, while APT's broader consumer focus makes it more susceptible to market sentiment fluctuations
III. Price Prediction 2025-2030: DAG vs APT
Short-term Prediction (2025)
- DAG: Conservative $0.015273 - $0.01697 | Optimistic $0.01697 - $0.0251156
- APT: Conservative $2.43516 - $2.899 | Optimistic $2.899 - $3.44981
Mid-term Prediction (2027)
- DAG may enter a growth phase, with prices expected in the range of $0.0203694304 - $0.02826258468
- APT may enter a consolidation phase, with prices expected in the range of $1.87686695625 - $3.99260788875
- Key drivers: Institutional fund inflows, ETF, ecosystem development
Long-term Prediction (2030)
- DAG: Base scenario $0.037819272148086 - $0.054459751893243 | Optimistic scenario $0.054459751893243+
- APT: Base scenario $4.334756469267656 - $5.895268798204012 | Optimistic scenario $5.895268798204012+
Disclaimer: This analysis is based on historical data and market projections. Cryptocurrency markets are highly volatile and unpredictable. This information should not be considered as financial advice. Always conduct your own research before making investment decisions.
DAG:
| 年份 | 预测最高价 | 预测平均价格 | 预测最低价 | 涨跌幅 |
|---|---|---|---|---|
| 2025 | 0.0251156 | 0.01697 | 0.015273 | 0 |
| 2026 | 0.029880776 | 0.0210428 | 0.018517664 | 23 |
| 2027 | 0.02826258468 | 0.025461788 | 0.0203694304 | 49 |
| 2028 | 0.0343835985152 | 0.02686218634 | 0.0166545555308 | 58 |
| 2029 | 0.045015651868572 | 0.0306228924276 | 0.023579627169252 | 80 |
| 2030 | 0.054459751893243 | 0.037819272148086 | 0.020800599681447 | 122 |
APT:
| 年份 | 预测最高价 | 预测平均价格 | 预测最低价 | 涨跌幅 |
|---|---|---|---|---|
| 2025 | 3.44981 | 2.899 | 2.43516 | 0 |
| 2026 | 3.65056575 | 3.174405 | 3.01568475 | 9 |
| 2027 | 3.99260788875 | 3.412485375 | 1.87686695625 | 17 |
| 2028 | 4.55413235720625 | 3.702546631875 | 3.3322919686875 | 27 |
| 2029 | 4.541173443994687 | 4.128339494540625 | 3.385238385523312 | 42 |
| 2030 | 5.895268798204012 | 4.334756469267656 | 3.294414916643418 | 49 |
IV. Investment Strategy Comparison: DAG vs APT
Long-term vs Short-term Investment Strategies
- DAG: Suitable for investors focused on enterprise solutions and infrastructure applications
- APT: Suitable for investors interested in DeFi, NFTs, and consumer-facing blockchain applications
Risk Management and Asset Allocation
- Conservative investors: DAG: 30% vs APT: 70%
- Aggressive investors: DAG: 60% vs APT: 40%
- Hedging tools: Stablecoin allocation, options, cross-currency portfolios
V. Potential Risk Comparison
Market Risks
- DAG: Lower liquidity and trading volume may lead to higher volatility
- APT: Susceptible to broader crypto market sentiment and DeFi sector trends
Technical Risks
- DAG: Scalability, network stability
- APT: Smart contract vulnerabilities, potential consensus issues
Regulatory Risks
- Global regulatory policies may impact both differently, with DAG potentially facing less scrutiny due to its enterprise focus
VI. Conclusion: Which Is the Better Buy?
📌 Investment Value Summary:
- DAG advantages: Fixed supply, enterprise adoption, potential for government infrastructure integration
- APT advantages: Strong institutional backing, developed DeFi ecosystem, high-performance Layer 1 blockchain
✅ Investment Advice:
- New investors: Consider a balanced approach with a slight tilt towards APT due to its stronger ecosystem
- Experienced investors: Evaluate portfolio needs and consider a mix of both for diversification
- Institutional investors: Assess alignment with investment mandates, potentially favoring DAG for enterprise solutions and APT for DeFi exposure
⚠️ Risk Warning: The cryptocurrency market is highly volatile. This article does not constitute investment advice. None
VII. FAQ
Q1: What are the main differences between DAG and APT? A: DAG is a distributed operating system with a fixed supply, focusing on enterprise solutions and infrastructure applications. APT is a high-performance Layer 1 blockchain with an inflationary model, targeting DeFi, NFTs, and consumer applications.
Q2: Which coin has performed better historically? A: APT reached its all-time high more recently in January 2023 at $19.92, while DAG's all-time high was $0.451761 in August 2021. However, both have since declined significantly from these peaks.
Q3: How do the supply mechanisms of DAG and APT differ? A: DAG has a fixed maximum supply of 4 billion tokens, while APT has a total supply of 1 billion tokens with an inflationary model that decreases over time from 7% to 3.25%.
Q4: Which coin has stronger institutional backing? A: APT appears to have stronger institutional backing with support from major venture capital firms like a16z and FTX Ventures.
Q5: What are the key technical features of each project? A: DAG focuses on its Hypergraph Transfer Protocol for interoperability, while APT uses the Move programming language and emphasizes security and scalability through its Byzantine Fault Tolerance consensus mechanism.
Q6: How do their ecosystems compare? A: APT has a more developed DeFi and NFT ecosystem with strong developer tools, while DAG focuses on enterprise adoption and infrastructure applications.
Q7: What are the long-term price predictions for DAG and APT by 2030? A: For DAG, the base scenario predicts $0.037819272148086 - $0.054459751893243, while for APT, the base scenario predicts $4.334756469267656 - $5.895268798204012. However, these are speculative and should not be considered financial advice.
Q8: Which coin might be considered a better buy? A: The choice depends on individual investment goals and risk tolerance. New investors might consider a balanced approach with a slight tilt towards APT due to its stronger ecosystem, while experienced investors should evaluate their portfolio needs and consider a mix of both for diversification.
Share
Content
Introduction: Investment Comparison between DAG and APT
I. Price History Comparison and Current Market Status
II. Key Factors Affecting DAG vs APT Investment Value
III. Price Prediction 2025-2030: DAG vs APT
IV. Investment Strategy Comparison: DAG vs APT
V. Potential Risk Comparison
VI. Conclusion: Which Is the Better Buy?
VII. FAQ

