BCH vs ARB: Comparing Two Crypto Assets in the DeFi Ecosystem
This article delves into a comparison of two prominent crypto assets, Bitcoin Cash (BCH) and Arbitrum (ARB), within the DeFi ecosystem. It examines key investment factors such as price history, supply mechanisms, institutional adoption, technology, and potential risks. The analysis aims to aid investors in identifying which asset might be a better buy based on their investment strategy and risk tolerance. Suitable for both new and experienced investors, the piece offers insights into market dynamics and long-term growth potential. Ensure a balanced understanding by checking real-time prices on Gate and exploring detailed price predictions.Introduction: BCH vs ARB Investment Comparison
In the cryptocurrency market, Bitcoin Cash (BCH) vs Arbitrum (ARB) comparison has always been a topic that investors can't ignore. The two not only differ significantly in market cap ranking, application scenarios, and price performance, but also represent different crypto asset positioning.
Bitcoin Cash (BCH): Since its launch in 2017, it has gained market recognition for its on-chain scaling and global adoption vision.
Arbitrum (ARB): Introduced in 2023, it has been hailed as an Ethereum scaling solution, enabling high-throughput and low-cost smart contracts while maintaining security.
This article will comprehensively analyze the investment value comparison between BCH and ARB, focusing on historical price trends, supply mechanisms, institutional adoption, technological ecosystems, and future predictions, attempting to answer the question that concerns investors the most:
"Which is the better buy right now?"
I. Price History Comparison and Current Market Status
Bitcoin Cash (BCH) and Arbitrum (ARB) Historical Price Trends
- 2017: BCH was created through a hard fork of Bitcoin, with its price reaching an all-time high of $3,785.82 on December 20, 2017.
- 2023: ARB launched on March 23, 2023, with its price reaching an all-time high of $4.00 on the same day.
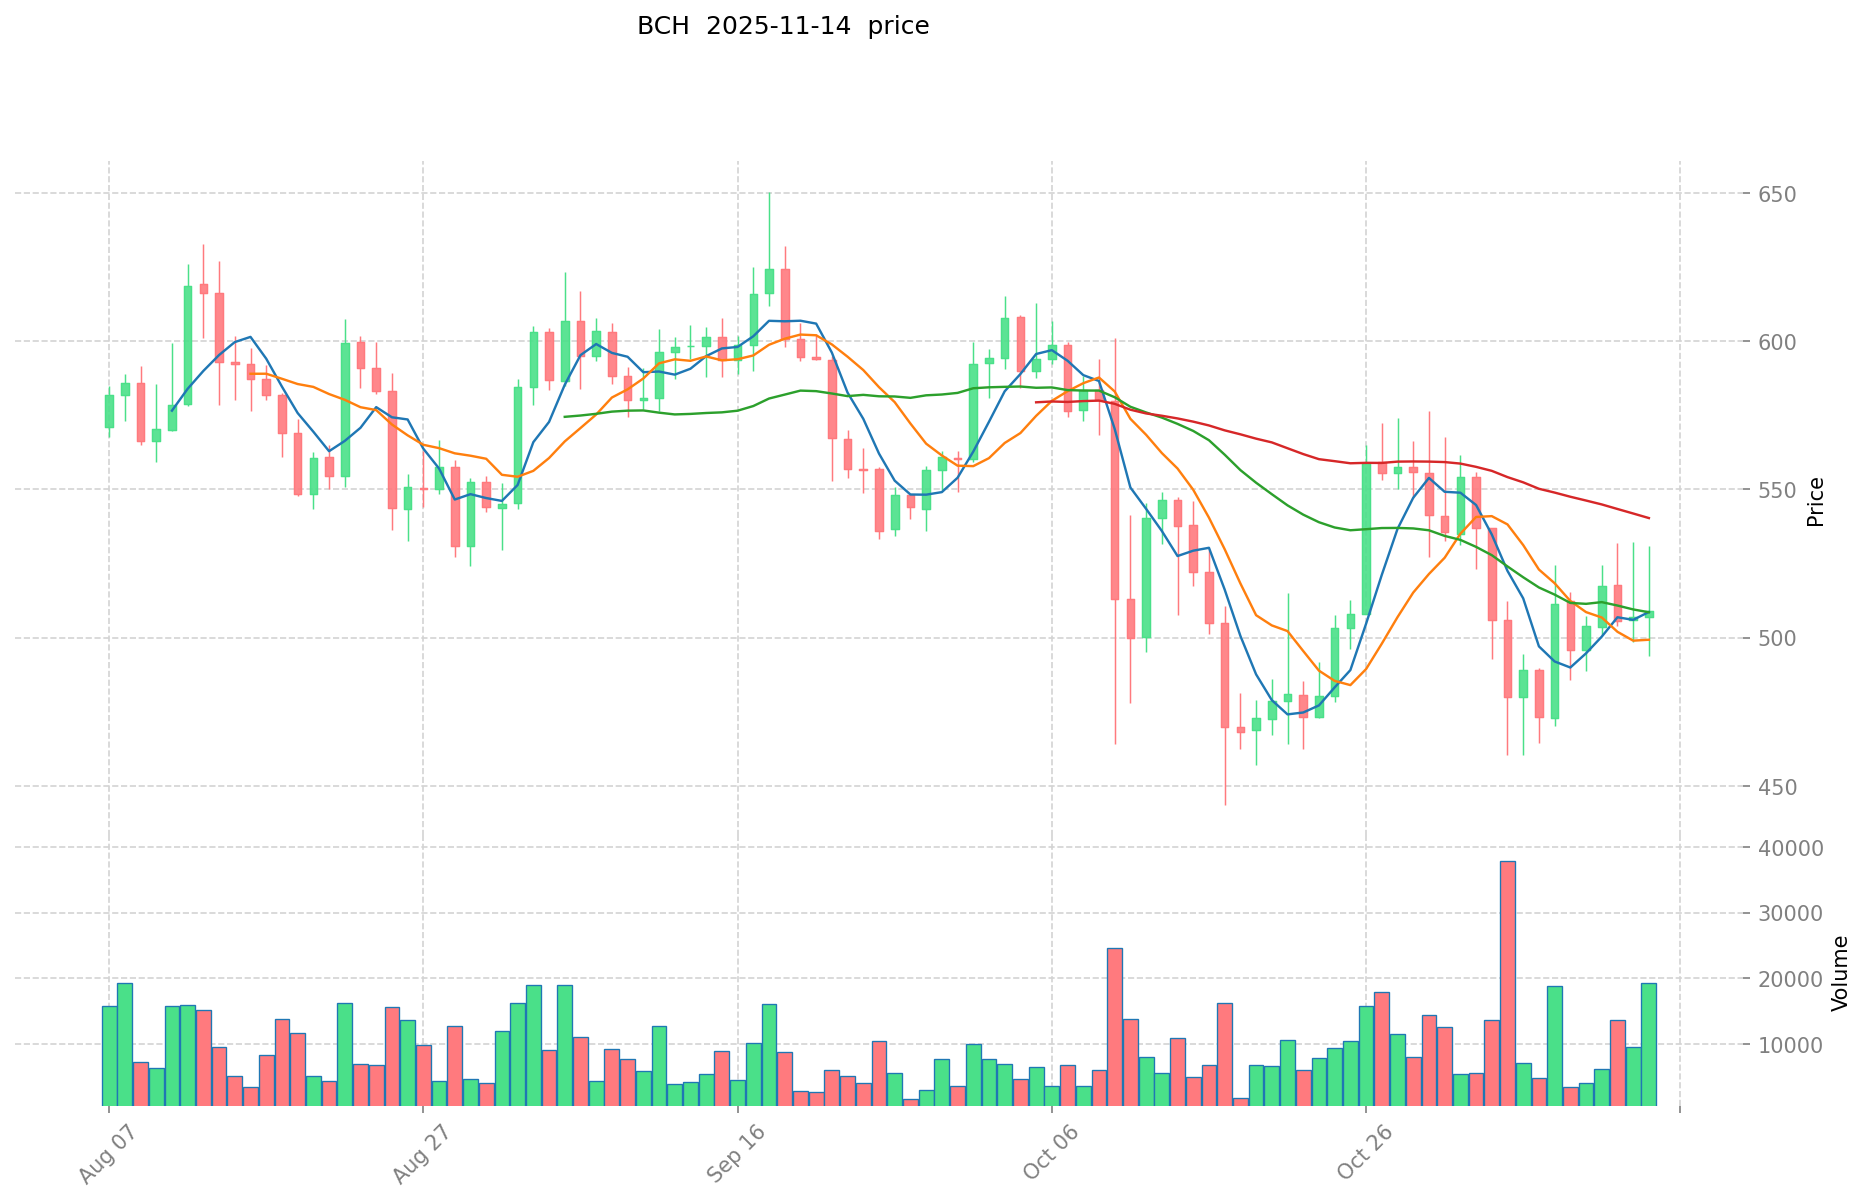
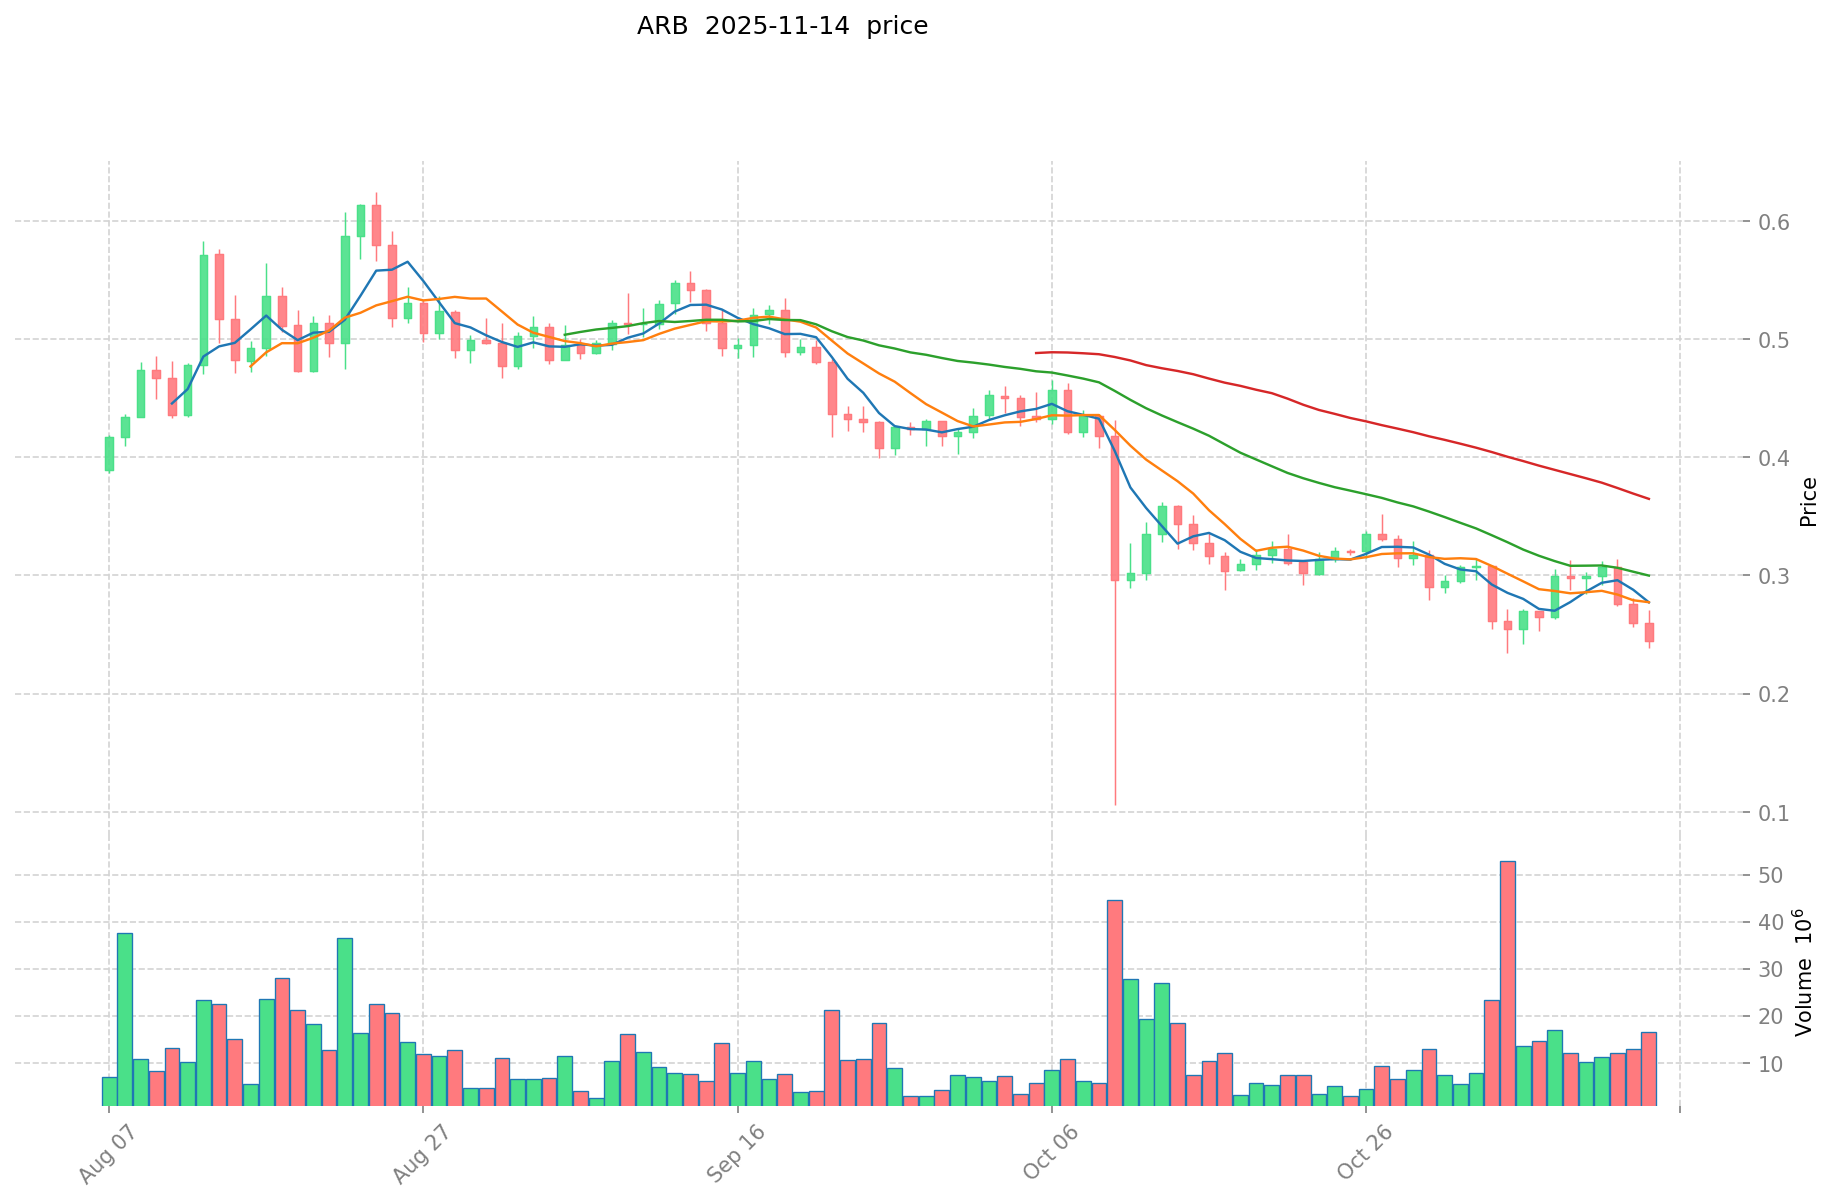
- Comparative analysis: During their respective market cycles, BCH dropped from its all-time high of $3,785.82 to a low of $76.93 on December 16, 2018, while ARB declined from its launch high of $4.00 to its all-time low of $0.1054 on October 10, 2025.
Current Market Situation (2025-11-14)
- BCH current price: $487.36
- ARB current price: $0.2389
- 24-hour trading volume: BCH $7,662,884.44 vs ARB $5,189,601.80
- Market sentiment index (Fear & Greed Index): 16 (Extreme Fear)
Click to view real-time prices:
- Check BCH current price Market Price
- Check ARB current price Market Price
II. Core Factors Affecting BCH vs ARB Investment Value
Supply Mechanism Comparison (Tokenomics)
- BCH: Fixed supply cap of 21 million coins, follows Bitcoin's original supply model with halving events
- ARB: Total supply of 10 billion tokens with strategic distribution across ecosystem components, investors, and team
- 📌 Historical pattern: Fixed supply assets like BCH typically experience cyclical price movements around halving events, while governance tokens like ARB often see value tied to ecosystem growth and protocol revenue.
Institutional Adoption and Market Applications
- Institutional holdings: ARB has seen growing institutional interest as part of Layer 2 investment theses, while BCH has struggled to maintain significant institutional support
- Enterprise adoption: BCH focuses on payment applications and merchant adoption, while ARB is positioned for scaling Ethereum applications and reducing transaction costs
- National policies: Regulatory clarity for BCH generally follows Bitcoin regulations, while ARB faces evolving regulatory frameworks around governance tokens and L2 solutions
Technology Development and Ecosystem Building
- BCH technology upgrades: Regular protocol improvements focusing on transaction capacity, with UTXO model maintaining fundamental design
- ARB technology development: Continuous improvement of Arbitrum's optimistic rollup technology with focus on scaling Ethereum applications
- Ecosystem comparison: ARB has developed a robust DeFi and gaming ecosystem leveraging Ethereum compatibility, while BCH ecosystem primarily focuses on payment applications with limited smart contract functionality
Macroeconomic and Market Cycles
- Performance in inflationary environments: BCH positions itself as a hard money alternative with fixed supply, while ARB value derives from network utility and fee generation
- Macroeconomic monetary policy: Interest rates and USD strength typically affect BCH more directly as a store-of-value asset, while ARB is more influenced by Ethereum ecosystem activity
- Geopolitical factors: BCH benefits from cross-border transaction demand in jurisdictions with currency controls, while ARB usage is more determined by global DeFi and Web3 application development
III. 2025-2030 Price Prediction: BCH vs ARB
Short-term Prediction (2025)
- BCH: Conservative $327.90 - $489.41 | Optimistic $489.41 - $685.17
- ARB: Conservative $0.22762 - $0.2396 | Optimistic $0.2396 - $0.318668
Mid-term Prediction (2027)
- BCH may enter a growth phase, estimated price range $319.05 - $860.82
- ARB may enter a growth phase, estimated price range $0.2397 - $0.4475
- Key drivers: Institutional capital inflow, ETF, ecosystem development
Long-term Prediction (2030)
- BCH: Base scenario $907.57 - $935.64 | Optimistic scenario $935.64 - $1188.27
- ARB: Base scenario $0.4151 - $0.4827 | Optimistic scenario $0.4827 - $0.5117
Disclaimer
BCH:
| 年份 | 预测最高价 | 预测平均价格 | 预测最低价 | 涨跌幅 |
|---|---|---|---|---|
| 2025 | 685.174 | 489.41 | 327.9047 | 0 |
| 2026 | 616.6566 | 587.292 | 381.7398 | 20 |
| 2027 | 860.823249 | 601.9743 | 319.046379 | 23 |
| 2028 | 1009.33030881 | 731.3987745 | 497.35116666 | 50 |
| 2029 | 1000.91922290325 | 870.364541655 | 626.6624699916 | 78 |
| 2030 | 1188.26519049448875 | 935.641882279125 | 907.57262581075125 | 91 |
ARB:
| 年份 | 预测最高价 | 预测平均价格 | 预测最低价 | 涨跌幅 |
|---|---|---|---|---|
| 2025 | 0.318668 | 0.2396 | 0.22762 | 0 |
| 2026 | 0.36008286 | 0.279134 | 0.16468906 | 16 |
| 2027 | 0.447451802 | 0.31960843 | 0.2397063225 | 33 |
| 2028 | 0.44873023572 | 0.383530116 | 0.28381228584 | 60 |
| 2029 | 0.5492918321352 | 0.41613017586 | 0.3786784600326 | 74 |
| 2030 | 0.511673664237456 | 0.4827110039976 | 0.415131463437936 | 102 |
IV. Investment Strategy Comparison: BCH vs ARB
Long-term vs Short-term Investment Strategies
- BCH: Suitable for investors focused on payment solutions and store of value properties
- ARB: Suitable for investors interested in Ethereum ecosystem growth and Layer 2 scaling potential
Risk Management and Asset Allocation
- Conservative investors: BCH: 30% vs ARB: 10%
- Aggressive investors: BCH: 15% vs ARB: 25%
- Hedging tools: Stablecoin allocation, options, cross-currency portfolios
V. Potential Risk Comparison
Market Risks
- BCH: Volatility tied to Bitcoin market cycles, potential loss of market share to other payment-focused cryptocurrencies
- ARB: Dependence on Ethereum's success, competition from other Layer 2 solutions
Technical Risks
- BCH: Scalability challenges, network stability during upgrades
- ARB: Smart contract vulnerabilities, potential issues with the optimistic rollup mechanism
Regulatory Risks
- Global regulatory policies may impact BCH and ARB differently, with BCH potentially facing scrutiny as a payment system and ARB navigating evolving DeFi regulations
VI. Conclusion: Which Is the Better Buy?
📌 Investment Value Summary:
- BCH advantages: Established brand, fixed supply cap, focus on global payments
- ARB advantages: Ethereum scaling solution, growing DeFi ecosystem, potential for increased adoption
✅ Investment Advice:
- New investors: Consider a balanced approach with exposure to both assets, leaning towards BCH for its more established history
- Experienced investors: Evaluate personal risk tolerance and portfolio goals, potentially allocating more to ARB for higher growth potential
- Institutional investors: Consider ARB as part of a broader Ethereum ecosystem investment thesis, while maintaining some BCH exposure for diversification
⚠️ Risk Warning: The cryptocurrency market is highly volatile, and this article does not constitute investment advice. None
VII. FAQ
Q1: What are the main differences between BCH and ARB in terms of investment potential? A: BCH is a more established cryptocurrency focused on payments and store of value, with a fixed supply cap. ARB is a newer token designed as an Ethereum scaling solution, with potential for growth in the DeFi ecosystem.
Q2: How do the supply mechanisms of BCH and ARB differ? A: BCH has a fixed supply cap of 21 million coins, similar to Bitcoin. ARB has a total supply of 10 billion tokens distributed across various ecosystem components, investors, and the team.
Q3: Which asset is more suitable for long-term investment? A: BCH may be more suitable for long-term investors focused on payment solutions and store of value properties. ARB could be better for those interested in the growth of the Ethereum ecosystem and Layer 2 scaling potential.
Q4: What are the key risks associated with investing in BCH and ARB? A: BCH risks include volatility tied to Bitcoin market cycles and potential loss of market share. ARB risks include dependence on Ethereum's success and competition from other Layer 2 solutions.
Q5: How do institutional adoptions compare between BCH and ARB? A: ARB has seen growing institutional interest as part of Layer 2 investment theses, while BCH has struggled to maintain significant institutional support in recent years.
Q6: What are the price predictions for BCH and ARB by 2030? A: According to the provided predictions, BCH's base scenario for 2030 is $907.57 - $935.64, with an optimistic scenario of $935.64 - $1188.27. ARB's base scenario for 2030 is $0.4151 - $0.4827, with an optimistic scenario of $0.4827 - $0.5117.
Q7: How should new investors approach BCH and ARB investments? A: New investors might consider a balanced approach with exposure to both assets, potentially leaning towards BCH for its more established history. It's important to evaluate personal risk tolerance and conduct thorough research before investing.
Share
Content
Introduction: BCH vs ARB Investment Comparison
I. Price History Comparison and Current Market Status
II. Core Factors Affecting BCH vs ARB Investment Value
III. 2025-2030 Price Prediction: BCH vs ARB
IV. Investment Strategy Comparison: BCH vs ARB
V. Potential Risk Comparison
VI. Conclusion: Which Is the Better Buy?
VII. FAQ

