BAT vs DOT: Comparing Two Rival Cryptocurrencies in the Blockchain Space
Introduction: BAT vs DOT Investment Comparison
In the cryptocurrency market, BAT vs DOT comparison has always been an unavoidable topic for investors. The two not only have significant differences in market cap ranking, application scenarios, and price performance, but also represent different positioning of crypto assets.
BasicAttentionToken (BAT): Since its launch in 2017, it has gained market recognition for its innovative approach to digital advertising and user attention monetization.
Polkadot (DOT): Introduced in 2020, it has been hailed as a next-generation blockchain protocol, aiming to enable interoperability between different blockchain networks.
This article will comprehensively analyze the investment value comparison between BAT and DOT, focusing on historical price trends, supply mechanisms, institutional adoption, technological ecosystems, and future predictions, attempting to answer the question investors care about most:
"Which is the better buy right now?"
I. Price History Comparison and Current Market Status
BAT and DOT Historical Price Trends
- 2021: BAT reached its all-time high of $1.9 on November 28, 2021, likely due to increased adoption of the Brave browser.
- 2021: DOT hit its all-time high of $54.98 on November 4, 2021, possibly influenced by the launch of parachains on Polkadot.
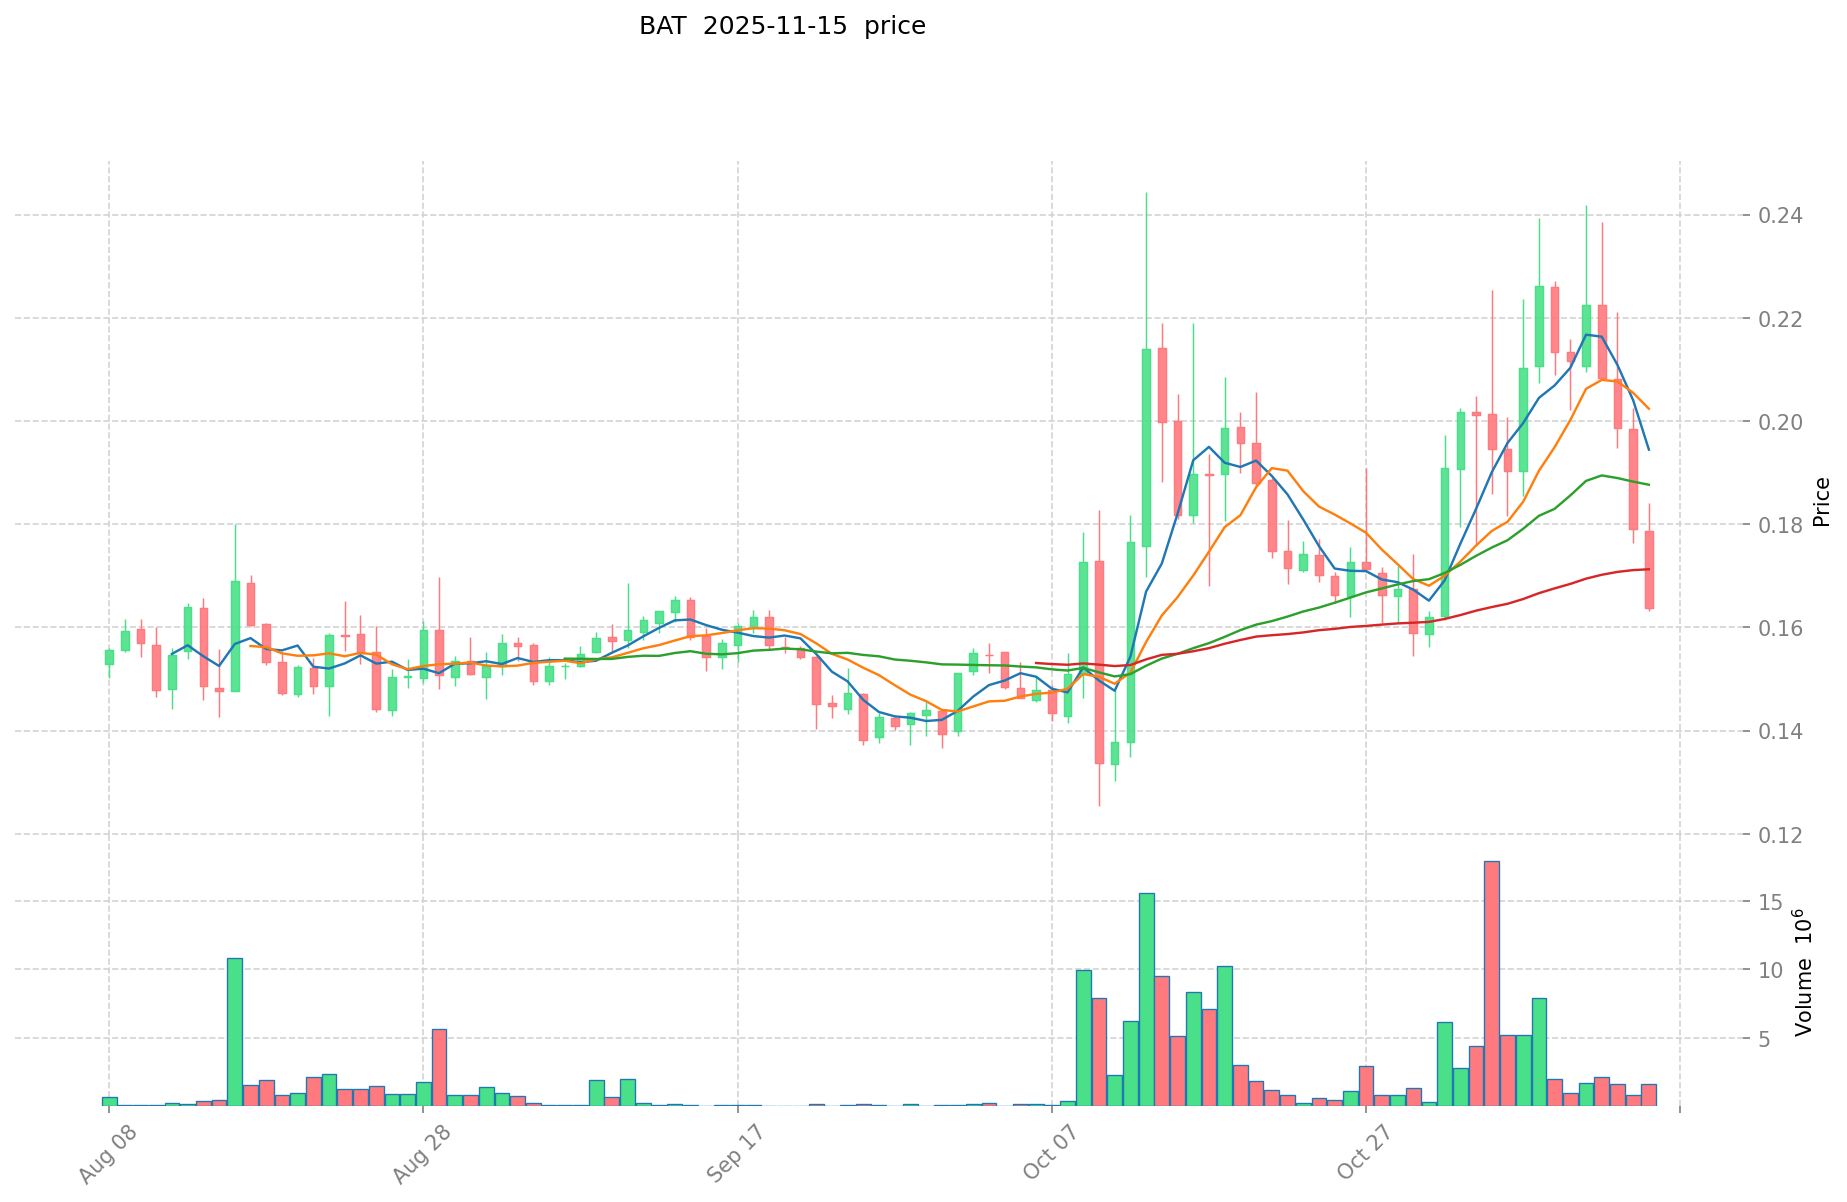
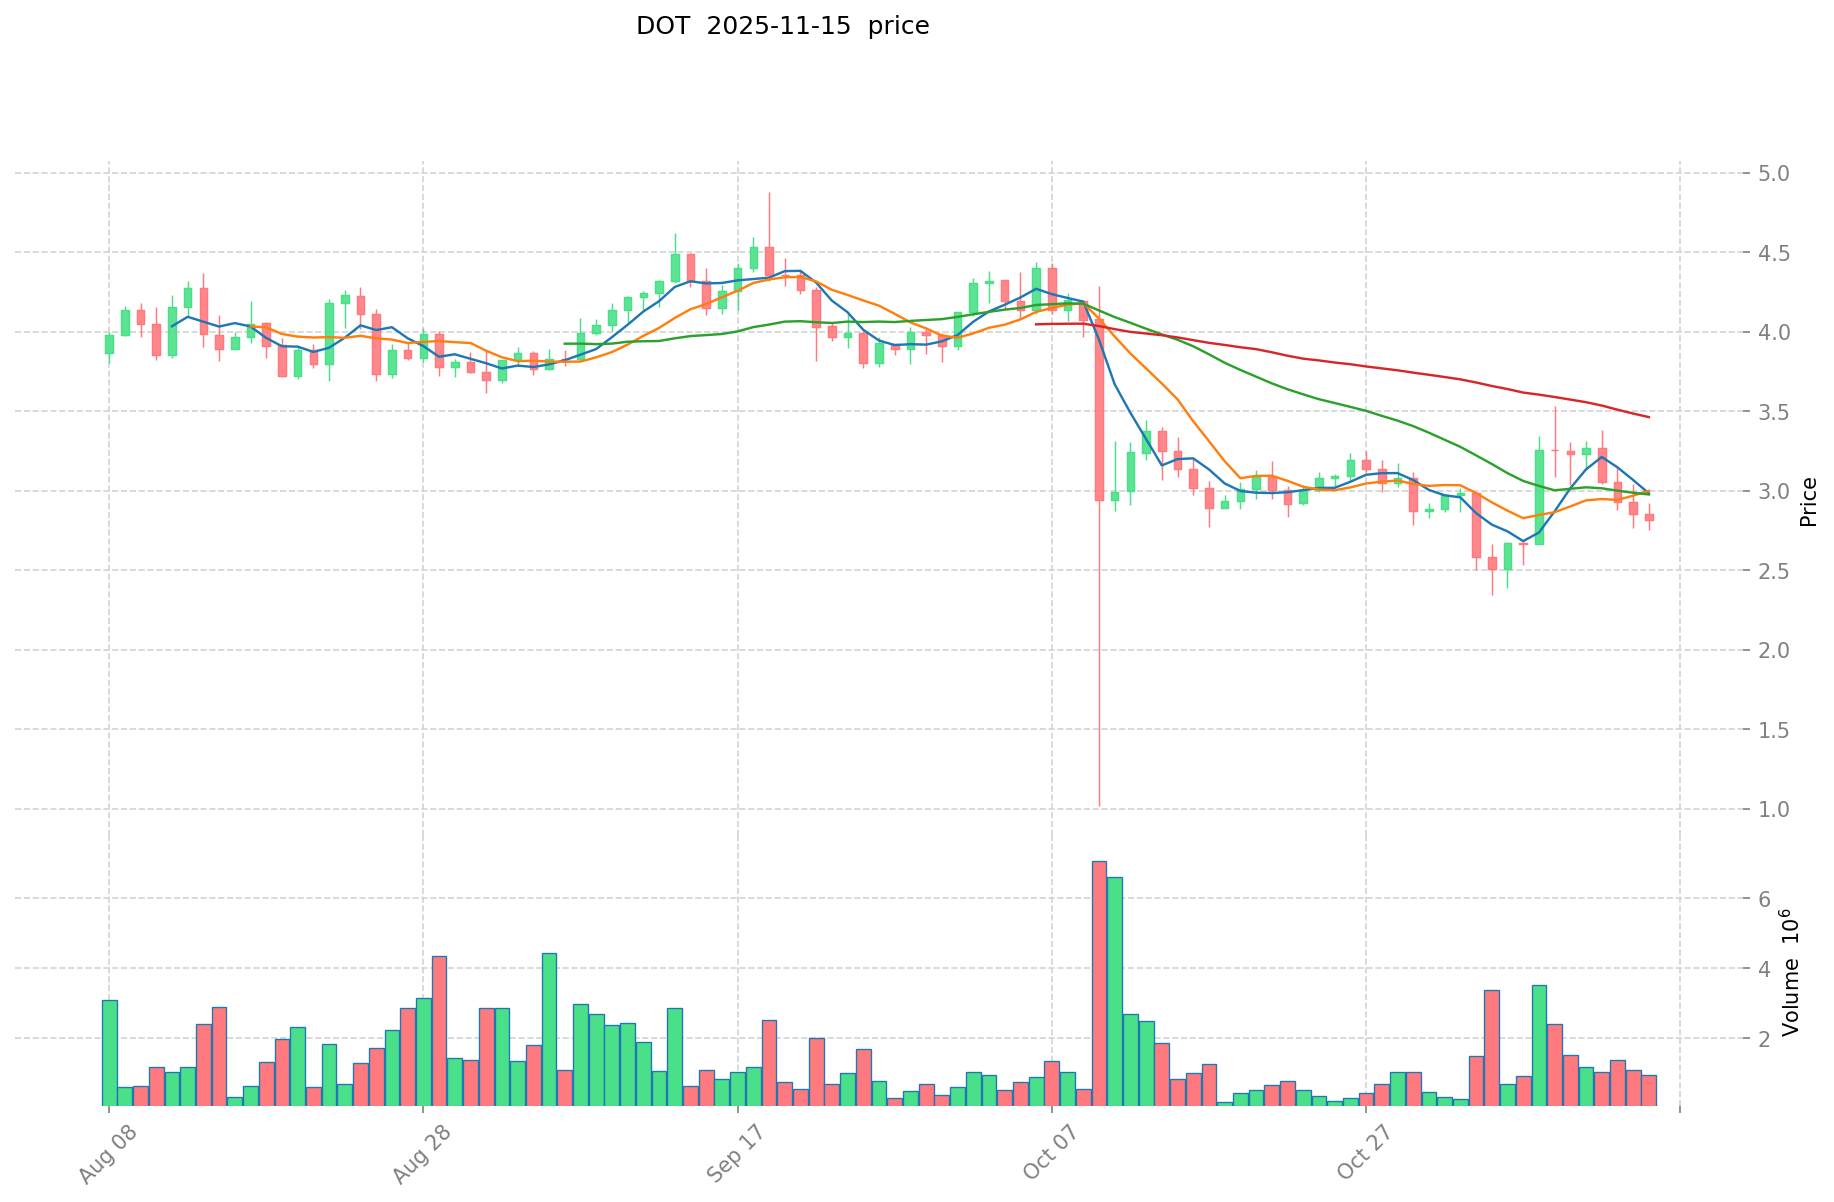
- Comparative analysis: During the market downturn, BAT dropped from its all-time high of $1.9 to a current price of $0.179, while DOT declined from $54.98 to $2.909.
Current Market Situation (2025-11-15)
- BAT current price: $0.179
- DOT current price: $2.909
- 24-hour trading volume: BAT $271,964.07 vs DOT $1,998,133.55
- Market Sentiment Index (Fear & Greed Index): 10 (Extreme Fear)
Click to view real-time prices:
- View BAT current price Market Price
- View DOT current price Market Price
II. Key Factors Influencing BAT vs DOT Investment Value
Supply Mechanism Comparison (Tokenomics)
- BAT: Fixed maximum supply of 1.5 billion tokens
- DOT: Inflationary model with no maximum supply cap, approximately 10% annual inflation rate
- 📌 Historical pattern: BAT's fixed supply creates scarcity potential during adoption periods, while DOT's inflation requires strong network growth to offset dilution effects.
Institutional Adoption and Market Applications
- Institutional holdings: DOT appears more attractive to institutional investors due to its staking rewards and parachain ecosystem
- Enterprise adoption: BAT has stronger mainstream visibility through the Brave browser, while DOT focuses on blockchain interoperability infrastructure
- National policies: Both face varied regulatory frameworks across jurisdictions, with DOT's governance model receiving greater regulatory scrutiny
Technical Development and Ecosystem Building
- BAT technical upgrades: Integration with Brave browser and expanding creator/advertiser ecosystem
- DOT technical development: Parachain auctions, cross-chain functionality, and governance improvements
- Ecosystem comparison: DOT has stronger DeFi and smart contract capabilities through its parachain model, while BAT has better established payments and advertising integration
Macroeconomic Factors and Market Cycles
- Performance in inflationary environments: BAT's fixed supply offers stronger theoretical inflation resistance
- Macroeconomic monetary policy: Both tokens show correlation with broader risk assets during interest rate fluctuations
- Geopolitical factors: DOT's interoperability focus positions it well for cross-border applications in fragmented regulatory environments
III. 2025-2030 Price Prediction: BAT vs DOT
Short-term Prediction (2025)
- BAT: Conservative $0.15-$0.18 | Optimistic $0.18-$0.20
- DOT: Conservative $2.52-$2.90 | Optimistic $2.90-$3.60
Mid-term Prediction (2027)
- BAT may enter a growth phase, with prices expected in the range of $0.11-$0.27
- DOT may enter a consolidation phase, with prices expected in the range of $2.39-$3.72
- Key drivers: Institutional inflows, ETFs, ecosystem development
Long-term Prediction (2030)
- BAT: Base scenario $0.21-$0.34 | Optimistic scenario $0.34-$0.50
- DOT: Base scenario $2.73-$4.55 | Optimistic scenario $4.55-$4.73
Disclaimer: This analysis is for informational purposes only and should not be considered as financial advice. Cryptocurrency markets are highly volatile and unpredictable. Always conduct your own research before making any investment decisions.
BAT:
| 年份 | 预测最高价 | 预测平均价格 | 预测最低价 | 涨跌幅 |
|---|---|---|---|---|
| 2025 | 0.184988 | 0.1796 | 0.150864 | 0 |
| 2026 | 0.2278675 | 0.182294 | 0.09479288 | 1 |
| 2027 | 0.2686557825 | 0.20508075 | 0.1127944125 | 14 |
| 2028 | 0.317403476775 | 0.23686826625 | 0.184757247675 | 32 |
| 2029 | 0.399075654978 | 0.2771358715125 | 0.180138316483125 | 54 |
| 2030 | 0.503777587235422 | 0.33810576324525 | 0.213006630844507 | 88 |
DOT:
| 年份 | 预测最高价 | 预测平均价格 | 预测最低价 | 涨跌幅 |
|---|---|---|---|---|
| 2025 | 3.596 | 2.9 | 2.523 | 0 |
| 2026 | 3.8976 | 3.248 | 1.68896 | 11 |
| 2027 | 3.715712 | 3.5728 | 2.393776 | 22 |
| 2028 | 4.62820512 | 3.644256 | 2.95184736 | 25 |
| 2029 | 4.963476672 | 4.13623056 | 3.6398828928 | 42 |
| 2030 | 4.73184776064 | 4.549853616 | 2.7299121696 | 56 |
IV. Investment Strategy Comparison: BAT vs DOT
Long-term vs Short-term Investment Strategies
- BAT: Suitable for investors focused on digital advertising and user attention monetization
- DOT: Suitable for investors interested in blockchain interoperability and ecosystem development
Risk Management and Asset Allocation
- Conservative investors: BAT: 30% vs DOT: 70%
- Aggressive investors: BAT: 60% vs DOT: 40%
- Hedging tools: Stablecoin allocation, options, cross-currency combinations
V. Potential Risk Comparison
Market Risk
- BAT: Dependence on Brave browser adoption and digital advertising market trends
- DOT: Vulnerability to overall blockchain market sentiment and parachain auction dynamics
Technical Risk
- BAT: Scalability, network stability
- DOT: Parachain security, cross-chain vulnerability
Regulatory Risk
- Global regulatory policies may impact both tokens differently, with DOT potentially facing more scrutiny due to its governance model
VI. Conclusion: Which Is the Better Buy?
📌 Investment Value Summary:
- BAT advantages: Fixed supply, established browser integration, digital advertising use case
- DOT advantages: Interoperability focus, staking rewards, parachain ecosystem
✅ Investment Advice:
- New investors: Consider a balanced approach with a slight preference for DOT due to its broader ecosystem potential
- Experienced investors: Explore opportunities in both tokens, with emphasis on DOT's parachain developments
- Institutional investors: Focus on DOT for its staking rewards and potential institutional-grade applications
⚠️ Risk Warning: Cryptocurrency markets are highly volatile. This article does not constitute investment advice. None
VII. FAQ
Q1: What are the main differences between BAT and DOT in terms of their use cases? A: BAT focuses on digital advertising and user attention monetization through the Brave browser, while DOT aims to enable interoperability between different blockchain networks.
Q2: How do the supply mechanisms of BAT and DOT differ? A: BAT has a fixed maximum supply of 1.5 billion tokens, creating potential scarcity. DOT has an inflationary model with no maximum supply cap and approximately 10% annual inflation rate.
Q3: Which token has shown better price performance since their all-time highs? A: Both tokens have experienced significant drops from their all-time highs. BAT declined from $1.9 to $0.179, while DOT fell from $54.98 to $2.909.
Q4: How do institutional investors view BAT and DOT? A: DOT appears more attractive to institutional investors due to its staking rewards and parachain ecosystem, while BAT has stronger mainstream visibility through the Brave browser.
Q5: What are the key factors influencing the long-term value of BAT and DOT? A: For BAT, key factors include Brave browser adoption and digital advertising trends. For DOT, important factors are blockchain interoperability development and the success of its parachain ecosystem.
Q6: How do the 2030 price predictions compare for BAT and DOT? A: BAT's base scenario for 2030 is $0.21-$0.34, with an optimistic scenario of $0.34-$0.50. DOT's base scenario is $2.73-$4.55, with an optimistic scenario of $4.55-$4.73.
Q7: What are the main risks associated with investing in BAT and DOT? A: Both face market risks related to cryptocurrency volatility. BAT's risks include dependence on Brave browser adoption, while DOT faces risks related to parachain security and cross-chain vulnerability. Both also face varying degrees of regulatory risk.
Share
Content
Introduction: BAT vs DOT Investment Comparison
I. Price History Comparison and Current Market Status
II. Key Factors Influencing BAT vs DOT Investment Value
III. 2025-2030 Price Prediction: BAT vs DOT
IV. Investment Strategy Comparison: BAT vs DOT
V. Potential Risk Comparison
VI. Conclusion: Which Is the Better Buy?
VII. FAQ

