BARD vs DOT: Comparing Two AI Language Models for Natural Conversation
Introduction: BARD vs DOT Investment Comparison
In the cryptocurrency market, the comparison between Lombard (BARD) and Polkadot (DOT) has always been a topic that investors cannot ignore. The two not only show significant differences in market cap ranking, application scenarios, and price performance, but also represent different positions in crypto assets.
Lombard (BARD): Since its launch, it has gained market recognition for its focus on transforming Bitcoin's utility through liquid staked tokens.
Polkadot (DOT): Introduced in 2020, it has been hailed as an interoperability protocol connecting multiple specialized blockchains into a unified network.
This article will provide a comprehensive analysis of the investment value comparison between BARD and DOT, focusing on historical price trends, supply mechanisms, institutional adoption, technological ecosystems, and future predictions, attempting to answer the question that investors care about most:
"Which is the better buy right now?"
I. Price History Comparison and Current Market Status
BARD (Coin A) and DOT (Coin B) Historical Price Trends
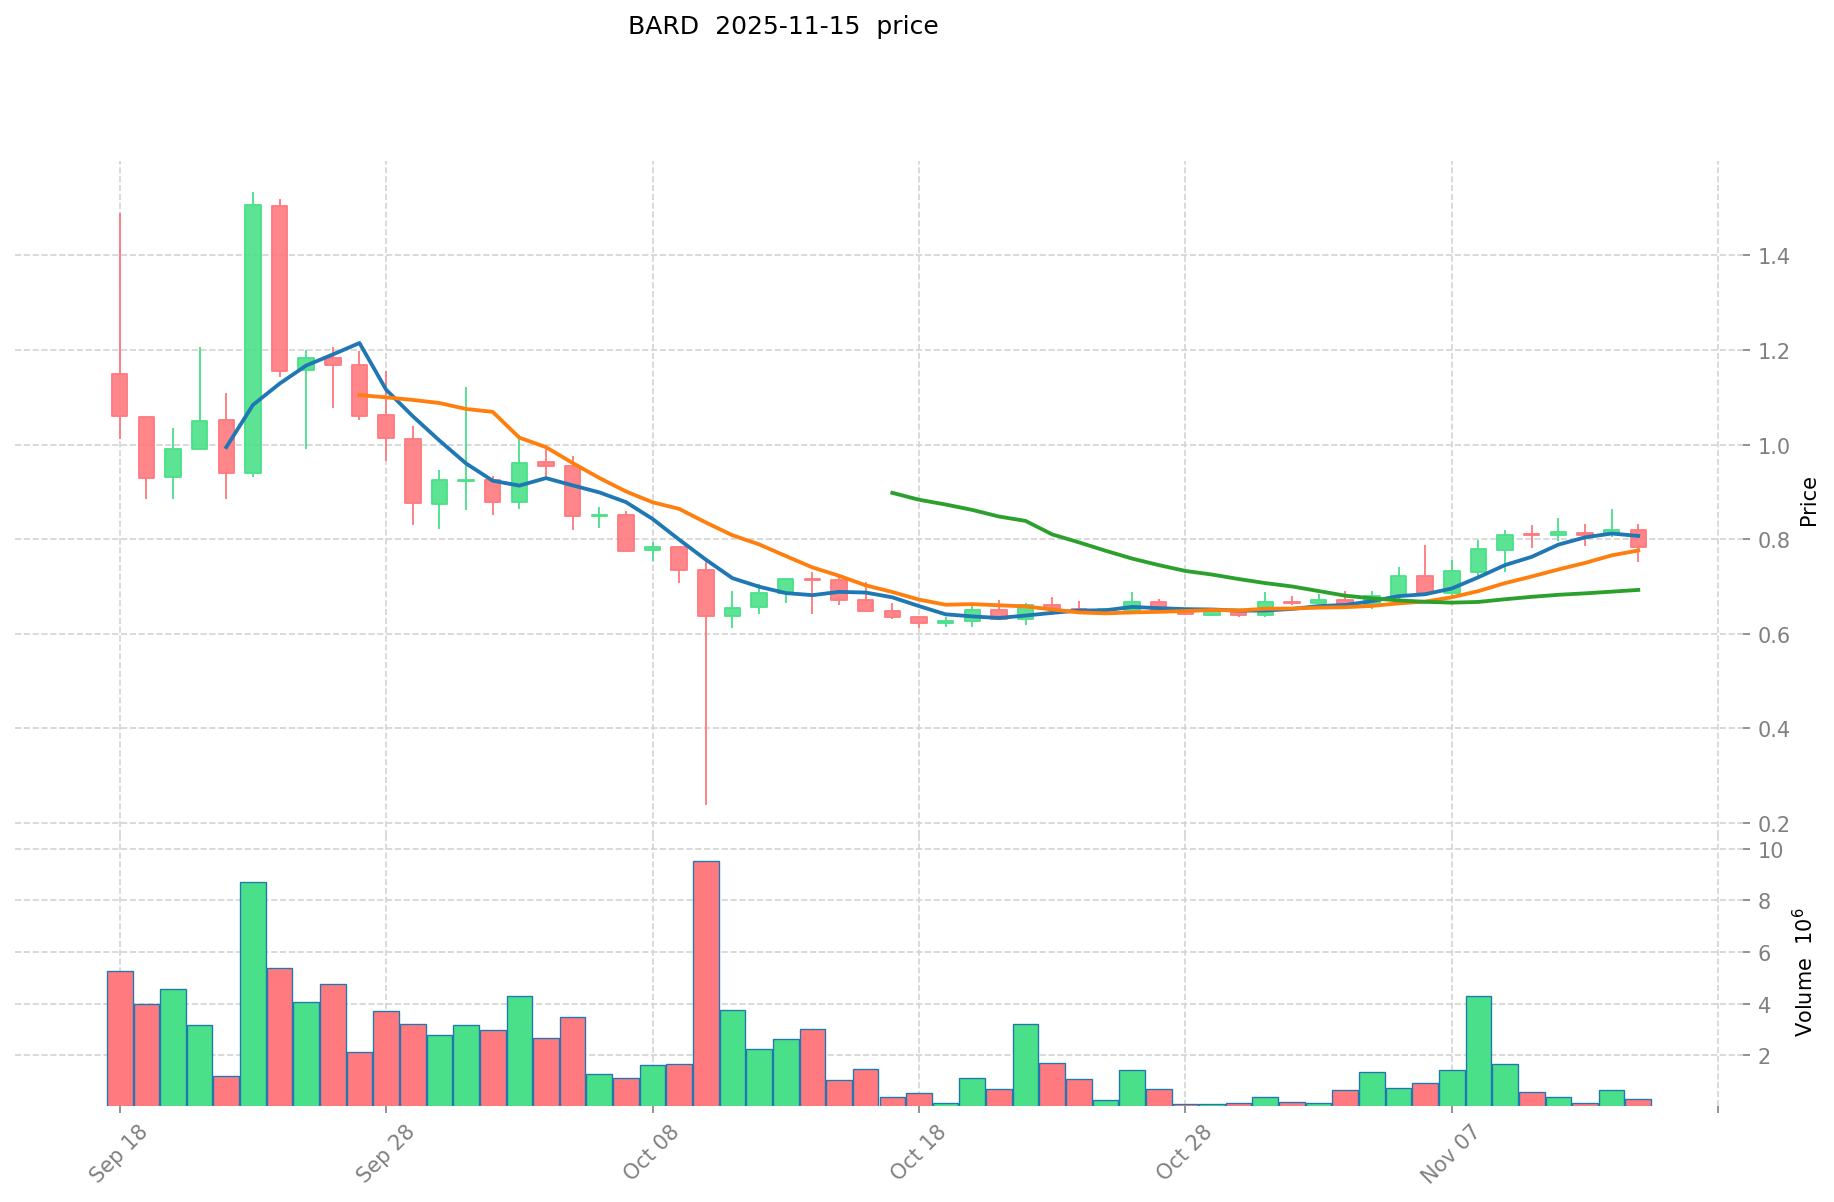
- 2025: BARD reached its all-time high of $1.5345 on September 23, followed by a significant drop to its all-time low of $0.2373 on October 10.
- 2021: DOT reached its all-time high of $54.98 on November 4, showing strong performance during the bull market.
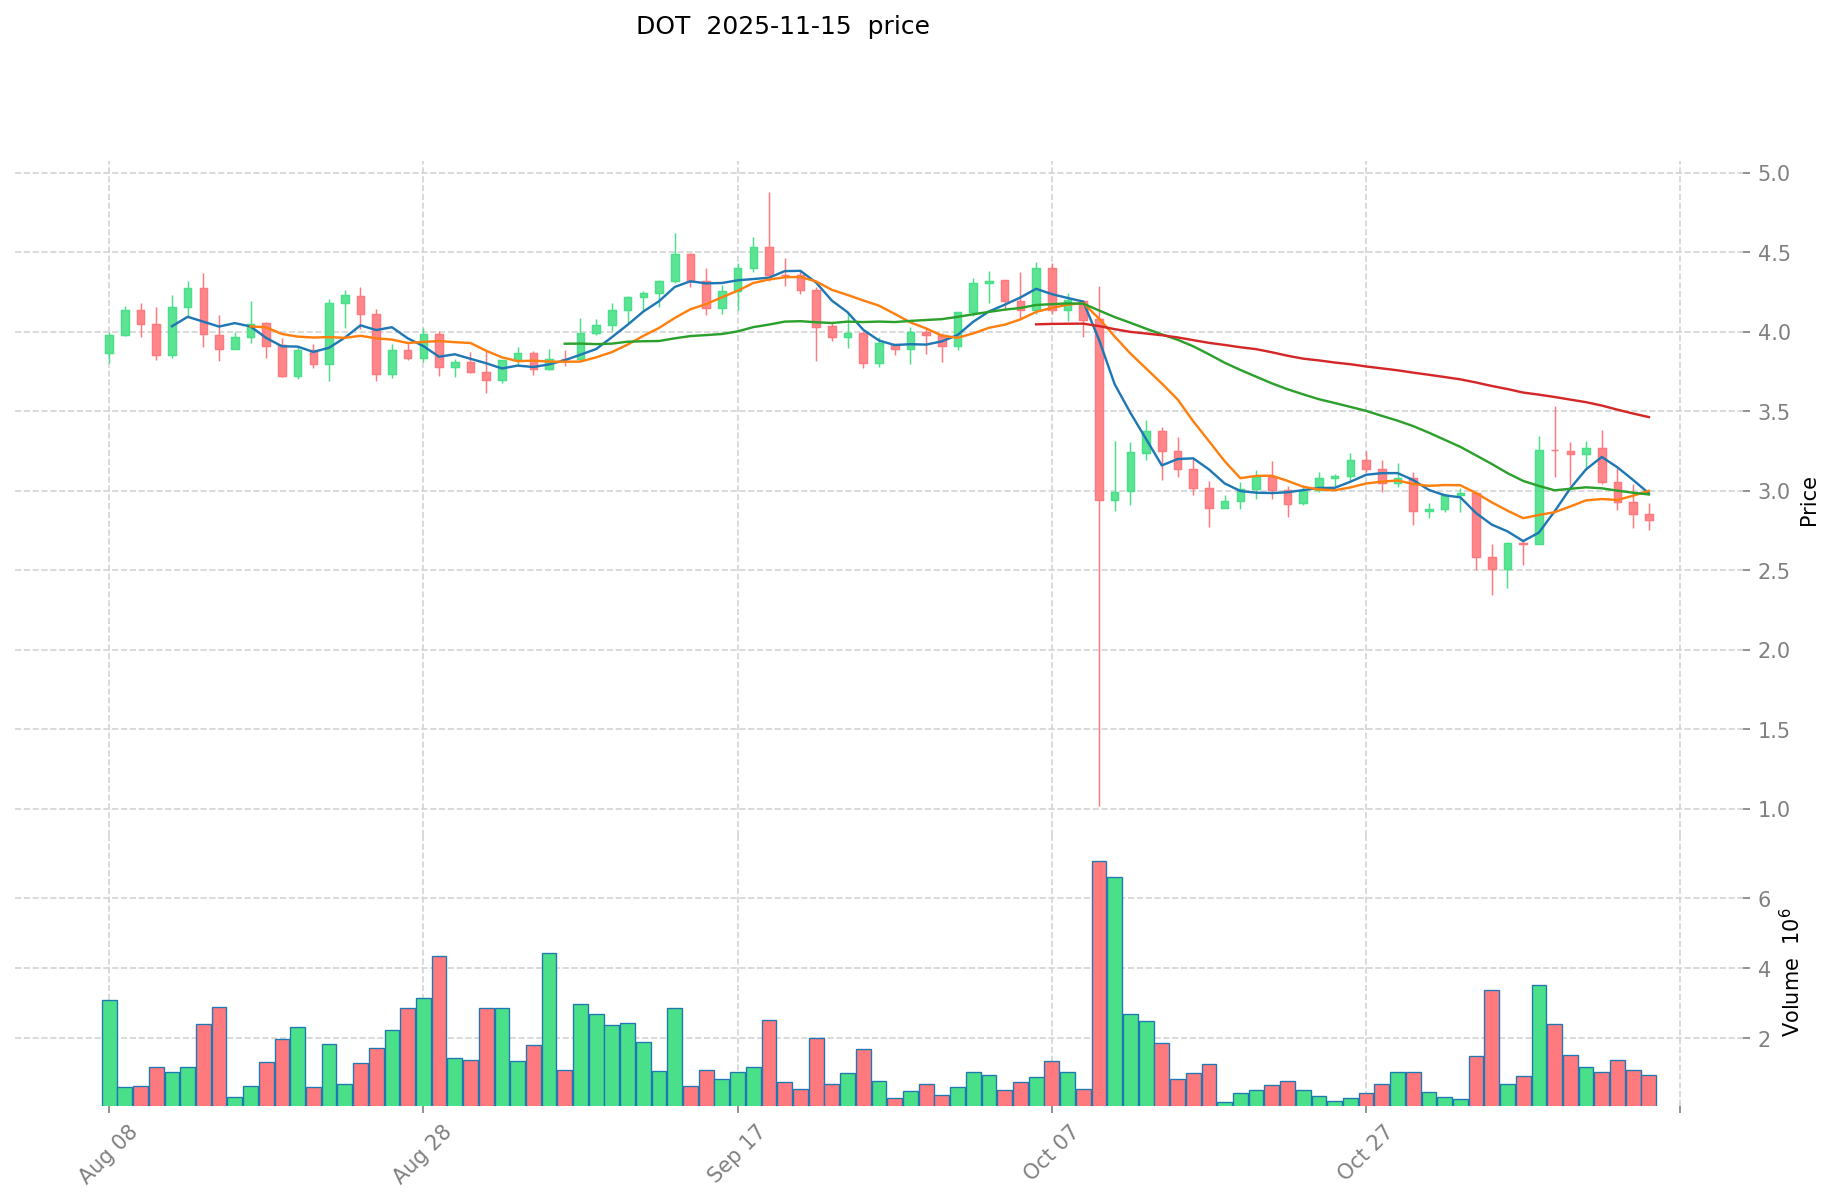
- Comparative analysis: In the recent market cycle, BARD dropped from $1.5345 to $0.2373, while DOT declined from its historical high of $54.98 to a low of $2.13 in 2025.
Current Market Situation (2025-11-16)
- BARD current price: $0.7873
- DOT current price: $2.832
- 24-hour trading volume: BARD $145,702.43 vs DOT $1,460,622.08
- Market Sentiment Index (Fear & Greed Index): 10 (Extreme Fear)
Click to view real-time prices:
- Check BARD current price Market Price
- Check DOT current price Market Price
II. Core Factors Affecting Investment Value of BARD vs DOT
Supply Mechanism Comparison (Tokenomics)
- BARD: Initial supply of 10 billion tokens with 40% allocated to public sale, 20% to core contributors and founders, and 20% reserved for ecosystem growth
- DOT: Inflationary model with target annual inflation rate between 8-10%, designed to incentivize network participation
Institutional Adoption and Market Applications
- Institutional Holdings: Both tokens have limited institutional adoption compared to major cryptocurrencies like Bitcoin and Ethereum
- Enterprise Adoption: DOT has gained traction in enterprise solutions through its cross-chain communication protocol, while BARD focuses on AI integration applications
- National Policies: Regulatory frameworks for both tokens remain evolving across jurisdictions, with neither facing specific regulatory challenges
Technical Development and Ecosystem Building
- BARD Technical Upgrades: Integration with Google's AI technology, improving functionality for AI-assisted content creation
- DOT Technical Development: Ongoing parachain auctions and cross-chain interoperability improvements through the Substrate framework
- Ecosystem Comparison: DOT has a more established ecosystem with multiple parachains and DeFi projects, while BARD's ecosystem is primarily focused on AI applications and content creation
Macroeconomic Factors and Market Cycles
- Inflation Environment Performance: Neither token has established strong anti-inflation properties comparable to Bitcoin
- Macroeconomic Monetary Policy: Both tokens show sensitivity to broader crypto market trends, which are influenced by interest rate changes and dollar strength
- Geopolitical Factors: DOT's cross-chain infrastructure potentially offers resilience during periods of regional regulatory uncertainty
III. 2025-2030 Price Prediction: BARD vs DOT
Short-term Prediction (2025)
- BARD: Conservative $0.45 - $0.79 | Optimistic $0.79 - $0.87
- DOT: Conservative $2.18 - $2.83 | Optimistic $2.83 - $3.45
Mid-term Prediction (2027)
- BARD may enter a growth phase, with expected price range $0.87 - $1.11
- DOT may enter a bullish market, with expected price range $3.20 - $5.29
- Key drivers: Institutional capital inflow, ETF, ecosystem development
Long-term Prediction (2030)
- BARD: Base scenario $1.41 - $1.45 | Optimistic scenario $1.45 - $1.73
- DOT: Base scenario $3.64 - $4.92 | Optimistic scenario $4.92 - $6.64
Disclaimer
BARD:
| 年份 | 预测最高价 | 预测平均价格 | 预测最低价 | 涨跌幅 |
|---|---|---|---|---|
| 2025 | 0.86537 | 0.7867 | 0.448419 | 0 |
| 2026 | 1.1234076 | 0.826035 | 0.5286624 | 4 |
| 2027 | 1.111182282 | 0.9747213 | 0.867501957 | 23 |
| 2028 | 1.49142106113 | 1.042951791 | 0.96994516563 | 32 |
| 2029 | 1.63467048962385 | 1.267186426065 | 0.95038981954875 | 60 |
| 2030 | 1.726604864834865 | 1.450928457844425 | 1.407400604109092 | 84 |
DOT:
| 年份 | 预测最高价 | 预测平均价格 | 预测最低价 | 涨跌幅 |
|---|---|---|---|---|
| 2025 | 3.4526 | 2.83 | 2.1791 | 0 |
| 2026 | 4.052277 | 3.1413 | 2.889996 | 10 |
| 2027 | 5.287279095 | 3.5967885 | 3.201141765 | 27 |
| 2028 | 4.6197151494 | 4.4420337975 | 3.3759456861 | 56 |
| 2029 | 5.3011231339365 | 4.53087447345 | 3.3075383656185 | 59 |
| 2030 | 6.636598384985887 | 4.91599880369325 | 3.637839114733005 | 73 |
IV. Investment Strategy Comparison: BARD vs DOT
Long-term vs Short-term Investment Strategy
- BARD: Suitable for investors focused on AI integration and content creation potential
- DOT: Suitable for investors interested in cross-chain interoperability and ecosystem development
Risk Management and Asset Allocation
- Conservative investors: BARD: 30% vs DOT: 70%
- Aggressive investors: BARD: 60% vs DOT: 40%
- Hedging tools: Stablecoin allocation, options, cross-currency portfolios
V. Potential Risk Comparison
Market Risk
- BARD: High volatility due to relatively new market presence
- DOT: Susceptible to broader crypto market trends and sentiment
Technical Risk
- BARD: Scalability, network stability
- DOT: Parachain auction dynamics, security vulnerabilities in cross-chain operations
Regulatory Risk
- Global regulatory policies may impact both differently, with DOT potentially facing more scrutiny due to its broader ecosystem
VI. Conclusion: Which Is the Better Buy?
📌 Investment Value Summary:
- BARD advantages: AI integration potential, focus on content creation applications
- DOT advantages: Established ecosystem, cross-chain interoperability, ongoing technical development
✅ Investment Advice:
- New investors: Consider a balanced approach, leaning towards DOT for its more established presence
- Experienced investors: Explore opportunities in both, with a focus on BARD's growth potential
- Institutional investors: Consider DOT for its ecosystem development and cross-chain capabilities
⚠️ Risk Warning: The cryptocurrency market is highly volatile, and this article does not constitute investment advice. None
VII. FAQ
Q1: What are the key differences between BARD and DOT? A: BARD focuses on AI integration and content creation, while DOT specializes in cross-chain interoperability. BARD has a fixed supply of 10 billion tokens, whereas DOT has an inflationary model. DOT has a more established ecosystem with multiple parachains, while BARD's ecosystem is primarily centered around AI applications.
Q2: Which token has performed better historically? A: DOT reached its all-time high of $54.98 in November 2021, while BARD's all-time high was $1.5345 in September 2025. However, both have experienced significant price drops since their peaks. As of November 16, 2025, BARD is trading at $0.7873, and DOT at $2.832.
Q3: What are the long-term price predictions for BARD and DOT? A: By 2030, BARD is predicted to reach between $1.41 and $1.73 in optimistic scenarios, while DOT is expected to be between $3.64 and $6.64. These predictions are based on current market trends and potential ecosystem developments.
Q4: How do institutional adoption and market applications compare between BARD and DOT? A: Both tokens have limited institutional adoption compared to major cryptocurrencies. DOT has gained traction in enterprise solutions through its cross-chain communication protocol, while BARD focuses on AI integration applications. Regulatory frameworks for both tokens are still evolving across jurisdictions.
Q5: What are the main risks associated with investing in BARD and DOT? A: Both face market risks due to crypto volatility. BARD has technical risks related to scalability and network stability, while DOT faces risks in parachain auction dynamics and cross-chain security. Regulatory risks exist for both, with DOT potentially facing more scrutiny due to its broader ecosystem.
Q6: How should investors allocate their portfolio between BARD and DOT? A: Conservative investors might consider allocating 30% to BARD and 70% to DOT, while aggressive investors might opt for 60% BARD and 40% DOT. However, individual allocation should be based on personal risk tolerance and investment goals.
Q7: Which token is considered a better buy for different types of investors? A: New investors might lean towards DOT for its more established presence. Experienced investors could explore opportunities in both, focusing on BARD's growth potential. Institutional investors might consider DOT for its ecosystem development and cross-chain capabilities. However, all investment decisions should be made after thorough research and consideration of individual risk tolerance.
Share
Content
Introduction: BARD vs DOT Investment Comparison
I. Price History Comparison and Current Market Status
II. Core Factors Affecting Investment Value of BARD vs DOT
III. 2025-2030 Price Prediction: BARD vs DOT
IV. Investment Strategy Comparison: BARD vs DOT
V. Potential Risk Comparison
VI. Conclusion: Which Is the Better Buy?
VII. FAQ

