AT vs SHIB: The Battle of Meme Coins in the Crypto Arena
Introduction: Investment Comparison between AT and SHIB
In the cryptocurrency market, the comparison between AT vs SHIB has always been a topic that investors cannot ignore. The two not only have significant differences in market cap ranking, application scenarios, and price performance, but also represent different crypto asset positioning.
APRO Token (AT): Since its launch, it has gained market recognition for its AI-enhanced oracle powering next-gen ecosystems across RWA, AI, Prediction Markets, and DeFi.
Shiba Inu (SHIB): Since its inception in 2020, it has been hailed as a "meme token" similar to Dogecoin, and is one of the most traded and highest market cap cryptocurrencies globally.
This article will comprehensively analyze the investment value comparison between AT vs SHIB, focusing on historical price trends, supply mechanisms, institutional adoption, technological ecosystems, and future predictions, and attempt to answer the question that investors care about most:
"Which is the better buy right now?"
I. Price History Comparison and Current Market Status
AT (Coin A) and SHIB (Coin B) Historical Price Trends
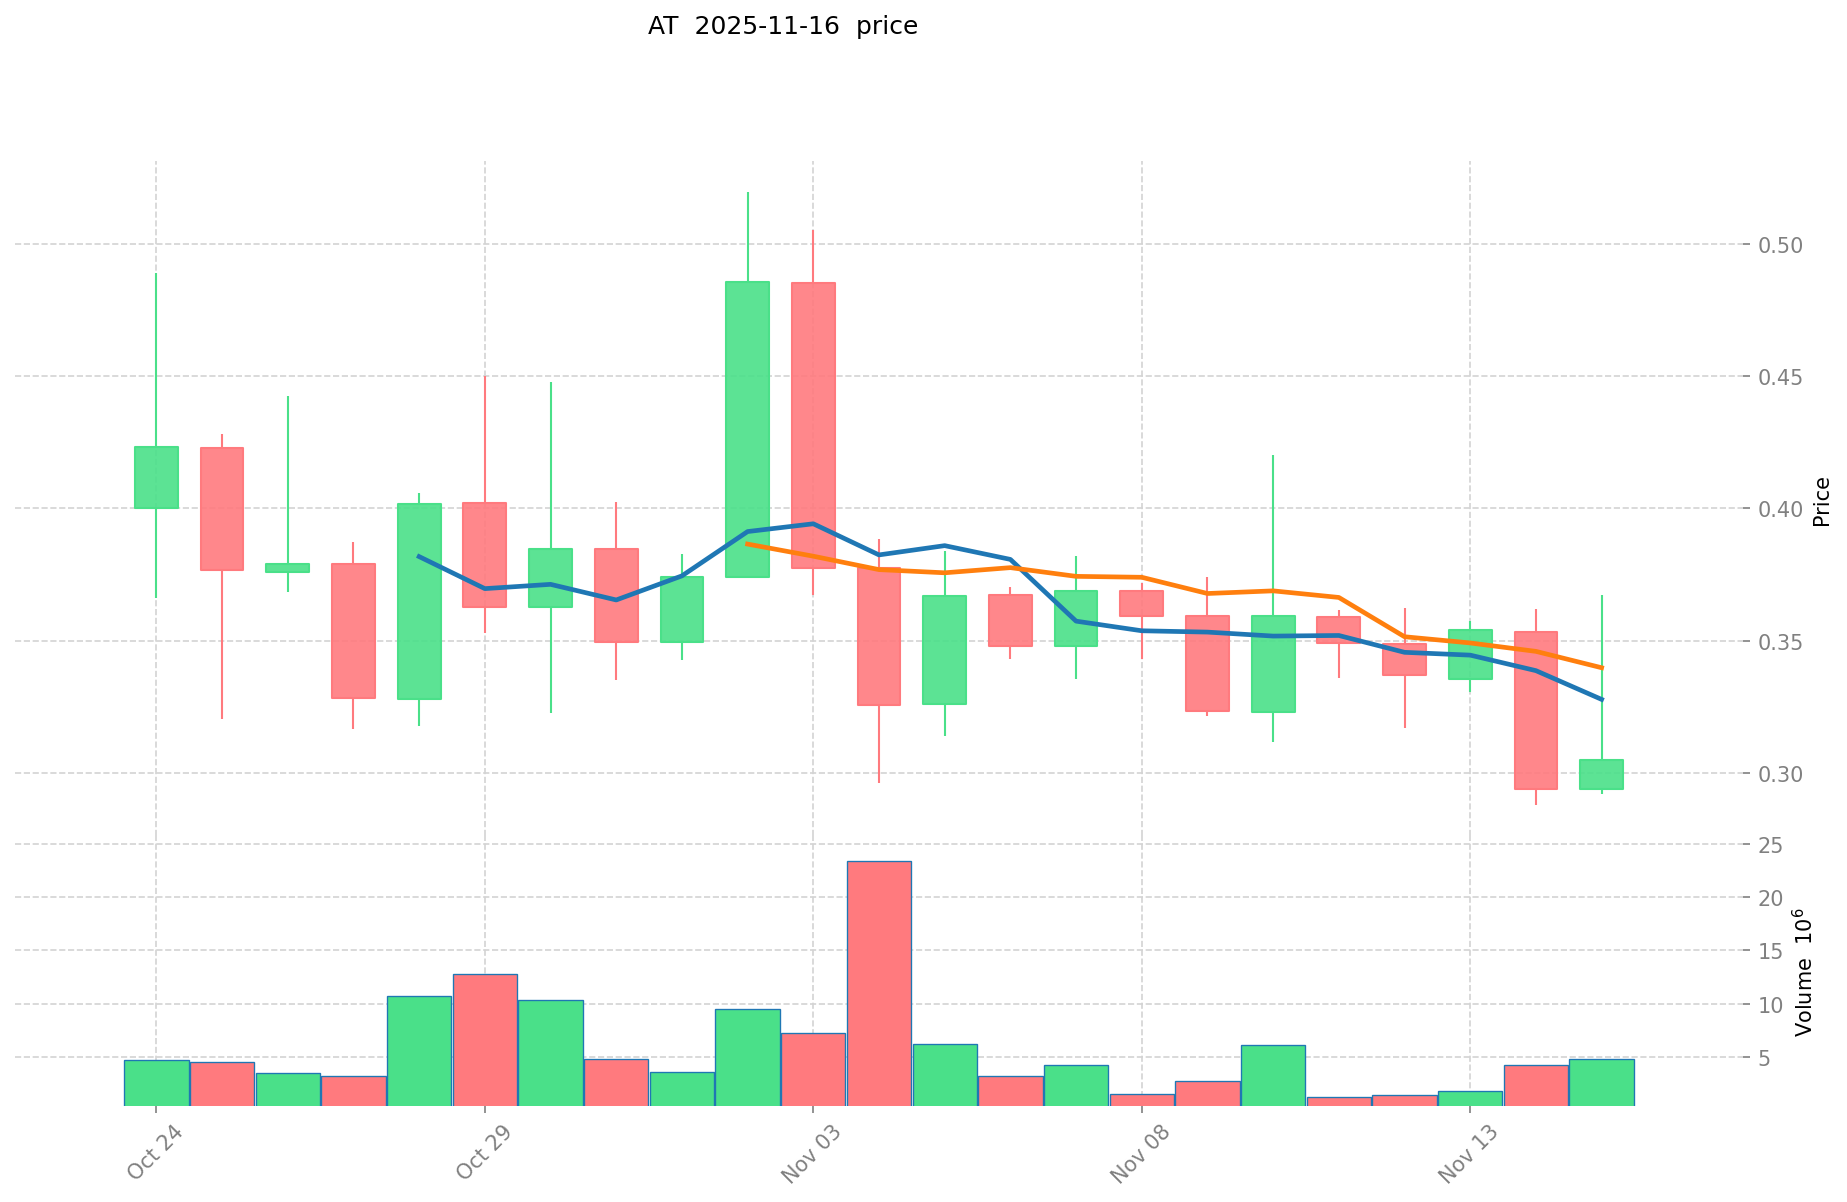
- 2025: AT reached its all-time high of $0.5196 on November 2, 2025, and its all-time low of $0.2878 on November 14, 2025.
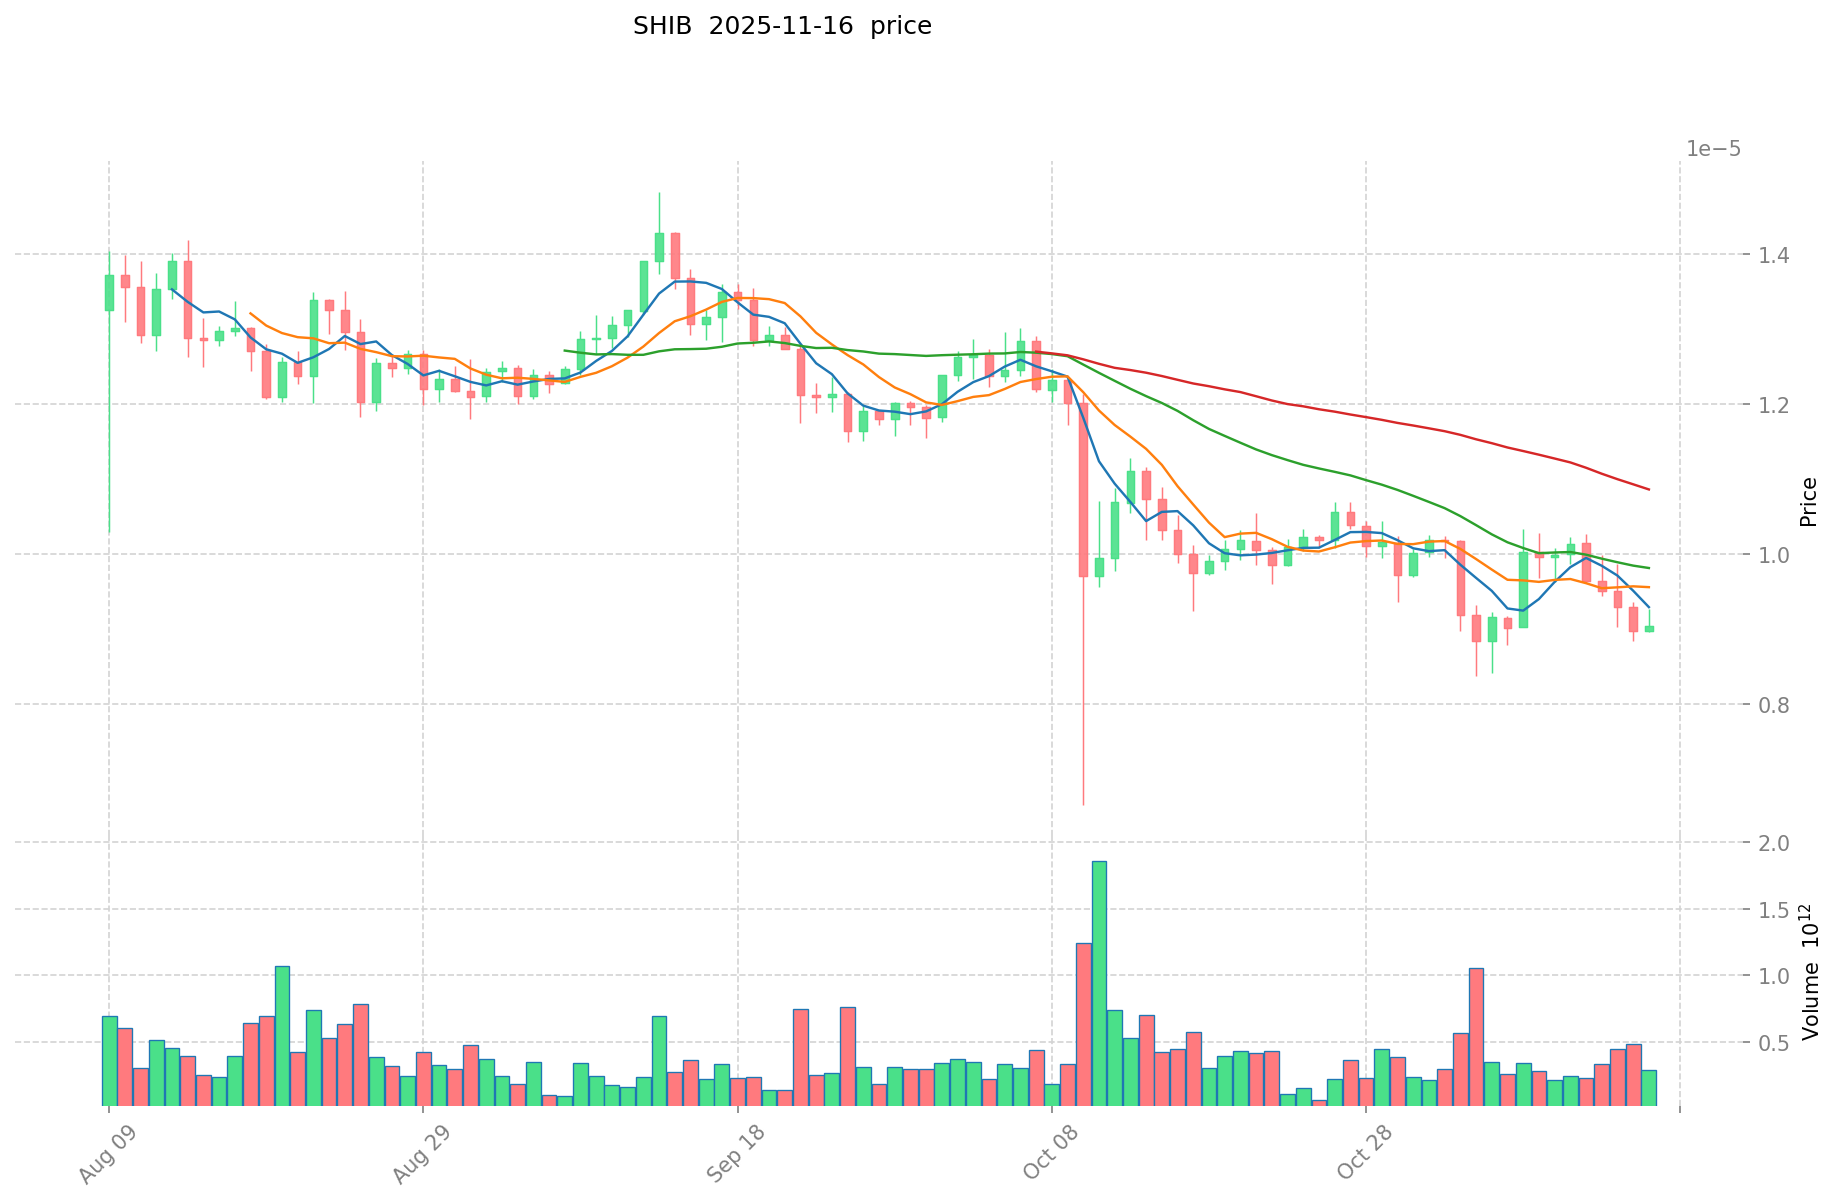
- 2021: SHIB hit its all-time high of $0.00008616 on October 28, 2021, during the bull market peak.
- Comparative analysis: In the recent market cycle, AT has shown significant volatility, ranging from $0.5196 to $0.2878, while SHIB has experienced a substantial decline from its 2021 peak.
Current Market Situation (2025-11-17)
- AT current price: $0.3127
- SHIB current price: $0.000008842
- 24-hour trading volume: AT $1,959,139.46 vs SHIB $3,112,711.56
- Market Sentiment Index (Fear & Greed Index): 10 (Extreme Fear)
Click to view real-time prices:
- View AT current price Market Price
- View SHIB current price Market Price
II. Core Factors Affecting AT vs SHIB Investment Value
Supply Mechanism Comparison (Tokenomics)
- AT: Perpetual Mining Model - daily supply increases by 11% (~110 trillion AT issued per day), creating an inflationary tokenomics structure.
- SHIB: Fixed supply of 589.7 trillion with burn mechanisms reducing total circulation over time.
- 📌 Historical Pattern: While AT's inflationary model puts constant downward pressure on price, SHIB's deflationary mechanism with ongoing burns creates potential upward price pressure over time.
Institutional Adoption and Market Applications
- Institutional Holdings: SHIB has achieved more widespread exchange listings and attracts higher trading volumes compared to AT.
- Enterprise Adoption: SHIB has developed a broader ecosystem with ShibaSwap DEX and multiple use cases, while AT remains primarily focused on mining activities.
- Regulatory Attitudes: Both tokens face regulatory scrutiny as meme coins, though SHIB has achieved more regulatory acceptance through its wider exchange presence.
Technical Development and Ecosystem Building
- AT Technical Development: Focused primarily on mining accessibility and mobile mining experience.
- SHIB Technical Development: Expanded beyond basic token functionality with ShibaSwap, Layer-2 solution (Shibarium), and NFT marketplace development.
- Ecosystem Comparison: SHIB has developed a more robust ecosystem with DeFi capabilities (ShibaSwap), NFT functionality, and Layer-2 scaling, while AT remains more limited in its ecosystem applications.
Macroeconomic Factors and Market Cycles
- Inflation Performance: Neither token demonstrates strong anti-inflationary properties, with AT's continuously increasing supply potentially making it more vulnerable to inflationary pressures.
- Monetary Policy Impact: Both tokens show high correlation with broader crypto market movements in response to monetary policy shifts.
- Geopolitical Factors: SHIB's wider global adoption and exchange presence may provide some advantages in cross-border trading scenarios compared to AT.
III. 2025-2030 Price Prediction: AT vs SHIB
Short-term Prediction (2025)
- AT: Conservative $0.29963 - $0.3154 | Optimistic $0.3154 - $0.337478
- SHIB: Conservative $0.00000757832 - $0.000008812 | Optimistic $0.000008812 - $0.00001224868
Mid-term Prediction (2027)
- AT may enter a growth phase, with prices expected in the range of $0.22352910525 - $0.54866234925
- SHIB may enter a growth phase, with prices expected in the range of $0.000006454045386 - $0.000015776555388
- Key drivers: Institutional capital inflow, ETF, ecosystem development
Long-term Prediction (2030)
- AT: Base scenario $0.513288055511077 - $0.641610069388846 | Optimistic scenario $0.641610069388846 - $0.673690572858289
- SHIB: Base scenario $0.000013390268678 - $0.000018859533349 | Optimistic scenario $0.000018859533349 - $0.000022442844686
Disclaimer
AT:
| 年份 | 预测最高价 | 预测平均价格 | 预测最低价 | 涨跌幅 |
|---|---|---|---|---|
| 2025 | 0.337478 | 0.3154 | 0.29963 | 0 |
| 2026 | 0.48639411 | 0.326439 | 0.30358827 | 4 |
| 2027 | 0.54866234925 | 0.406416555 | 0.22352910525 | 29 |
| 2028 | 0.58737352611375 | 0.477539452125 | 0.439336295955 | 52 |
| 2029 | 0.750763649658318 | 0.532456489119375 | 0.372719542383562 | 70 |
| 2030 | 0.673690572858289 | 0.641610069388846 | 0.513288055511077 | 105 |
SHIB:
| 年份 | 预测最高价 | 预测平均价格 | 预测最低价 | 涨跌幅 |
|---|---|---|---|---|
| 2025 | 0.00001224868 | 0.000008812 | 0.00000757832 | 0 |
| 2026 | 0.0000133735318 | 0.00001053034 | 0.0000090560924 | 19 |
| 2027 | 0.000015776555388 | 0.0000119519359 | 0.000006454045386 | 35 |
| 2028 | 0.000017053022142 | 0.000013864245644 | 0.000009843614407 | 56 |
| 2029 | 0.000022260432806 | 0.000015458633893 | 0.000009429766674 | 74 |
| 2030 | 0.000022442844686 | 0.000018859533349 | 0.000013390268678 | 113 |
IV. Investment Strategy Comparison: AT vs SHIB
Long-term vs Short-term Investment Strategy
- AT: Suitable for investors focused on AI-enhanced oracle ecosystems and potential growth in DeFi applications
- SHIB: Suitable for investors seeking short-term trading opportunities and meme-driven market movements
Risk Management and Asset Allocation
- Conservative investors: AT: 20% vs SHIB: 10%
- Aggressive investors: AT: 40% vs SHIB: 30%
- Hedging tools: Stablecoin allocation, options, cross-currency portfolios
V. Potential Risk Comparison
Market Risk
- AT: High volatility due to inflationary tokenomics and relatively new market presence
- SHIB: Susceptibility to market sentiment shifts and meme-driven price fluctuations
Technical Risk
- AT: Scalability, network stability
- SHIB: Smart contract vulnerabilities, ecosystem development challenges
Regulatory Risk
- Global regulatory policies may impact both tokens differently, with SHIB potentially facing less scrutiny due to wider adoption and exchange listings
VI. Conclusion: Which Is the Better Buy?
📌 Investment Value Summary:
- AT advantages: AI-enhanced oracle technology, potential for growth in DeFi and prediction markets
- SHIB advantages: Established brand recognition, larger ecosystem, and ongoing development initiatives
✅ Investment Advice:
- Novice investors: Consider a small allocation to SHIB for exposure to meme token market dynamics
- Experienced investors: Explore AT for its technological potential in AI and oracle services
- Institutional investors: Evaluate both tokens based on risk tolerance and portfolio diversification needs
⚠️ Risk Warning: Cryptocurrency markets are highly volatile, and this article does not constitute investment advice. None
VII. FAQ
Q1: What are the key differences between AT and SHIB? A: AT is focused on AI-enhanced oracle technology for DeFi and prediction markets, while SHIB is a meme token with a larger ecosystem including a DEX and NFT marketplace. AT has an inflationary tokenomics model, while SHIB has a fixed supply with burn mechanisms.
Q2: Which token has shown better price performance recently? A: AT has shown significant volatility in 2025, ranging from $0.5196 to $0.2878. SHIB has experienced a substantial decline from its 2021 peak but maintains a higher trading volume.
Q3: How do the supply mechanisms of AT and SHIB differ? A: AT uses a Perpetual Mining Model with daily supply increases of 11%, creating an inflationary structure. SHIB has a fixed supply of 589.7 trillion tokens with burn mechanisms reducing circulation over time.
Q4: Which token has greater institutional adoption? A: SHIB has achieved more widespread exchange listings and attracts higher trading volumes compared to AT. It also has developed a broader ecosystem with multiple use cases.
Q5: What are the long-term price predictions for AT and SHIB? A: By 2030, AT is predicted to reach $0.513288055511077 - $0.673690572858289, while SHIB is expected to reach $0.000013390268678 - $0.000022442844686 in the base to optimistic scenarios.
Q6: How should investors allocate their portfolio between AT and SHIB? A: Conservative investors might consider allocating 20% to AT and 10% to SHIB, while aggressive investors might allocate 40% to AT and 30% to SHIB. However, this should be adjusted based on individual risk tolerance and market conditions.
Q7: What are the main risks associated with investing in AT and SHIB? A: Both tokens face market risks due to volatility. AT has technical risks related to scalability and network stability, while SHIB faces potential smart contract vulnerabilities. Both also face regulatory risks, though SHIB may have less scrutiny due to wider adoption.
Share
Content
Introduction: Investment Comparison between AT and SHIB
I. Price History Comparison and Current Market Status
II. Core Factors Affecting AT vs SHIB Investment Value
III. 2025-2030 Price Prediction: AT vs SHIB
IV. Investment Strategy Comparison: AT vs SHIB
V. Potential Risk Comparison
VI. Conclusion: Which Is the Better Buy?
VII. FAQ

