ARKM vs TRX: Battle of the Blockchain Titans - Which Cryptocurrency Will Dominate in 2023?
Introduction: Investment Comparison of ARKM vs TRX
In the cryptocurrency market, the comparison between Arkham (ARKM) and TRON (TRX) has always been an unavoidable topic for investors. The two not only differ significantly in market cap ranking, application scenarios, and price performance, but also represent different positioning in the crypto asset landscape.
Arkham (ARKM): Since its launch in 2023, it has gained market recognition for its blockchain intelligence platform.
TRON (TRX): Since its inception in 2017, it has been hailed as a decentralized content-sharing platform and has become one of the largest public blockchains by market capitalization and transaction volume globally.
This article will comprehensively analyze the investment value comparison between ARKM and TRX, focusing on historical price trends, supply mechanisms, institutional adoption, technological ecosystems, and future predictions, attempting to answer the question investors care about most:
"Which is the better buy right now?"
I. Price History Comparison and Current Market Status
ARKM and TRX Historical Price Trends
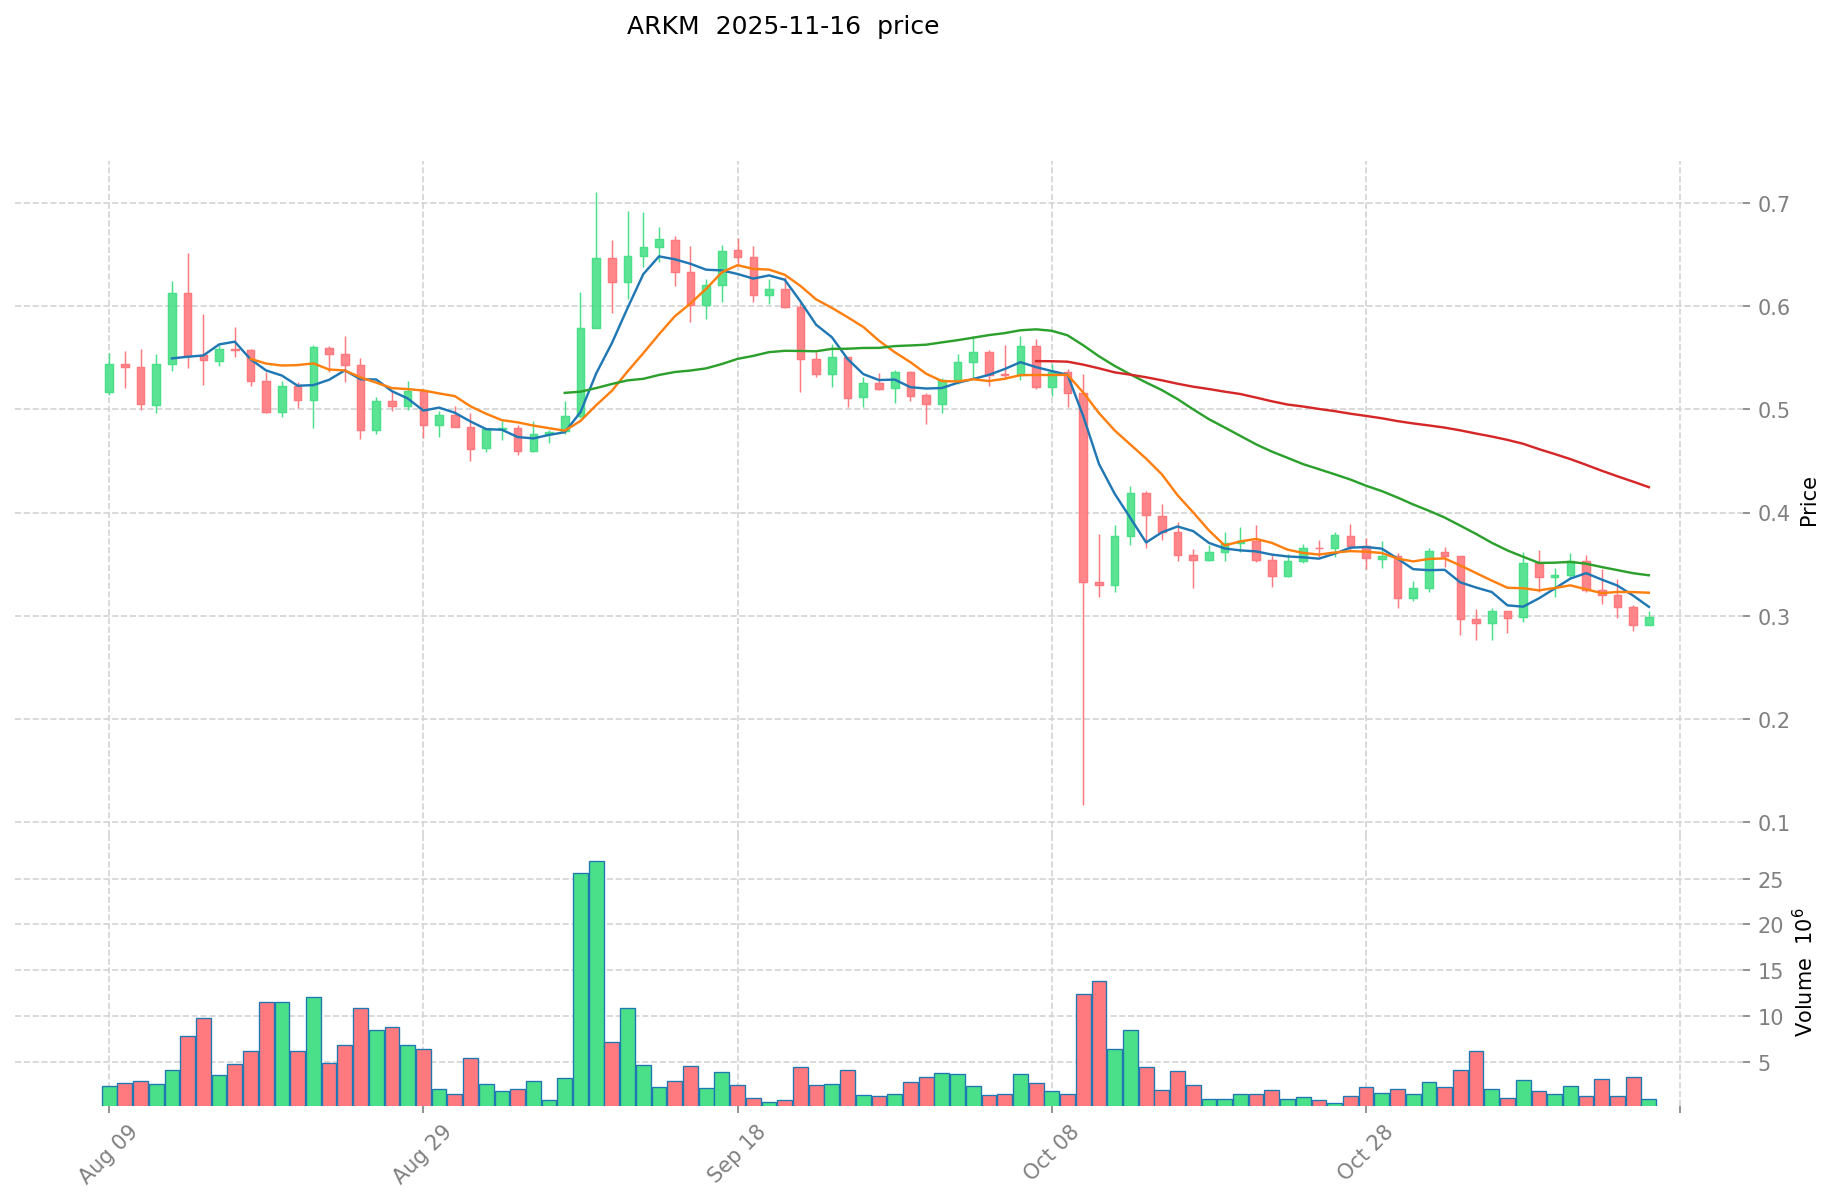
- 2024: ARKM reached its all-time high of $3.9923 on March 10, 2024.
- 2025: ARKM hit its all-time low of $0.1162 on October 10, 2025, showing significant volatility.
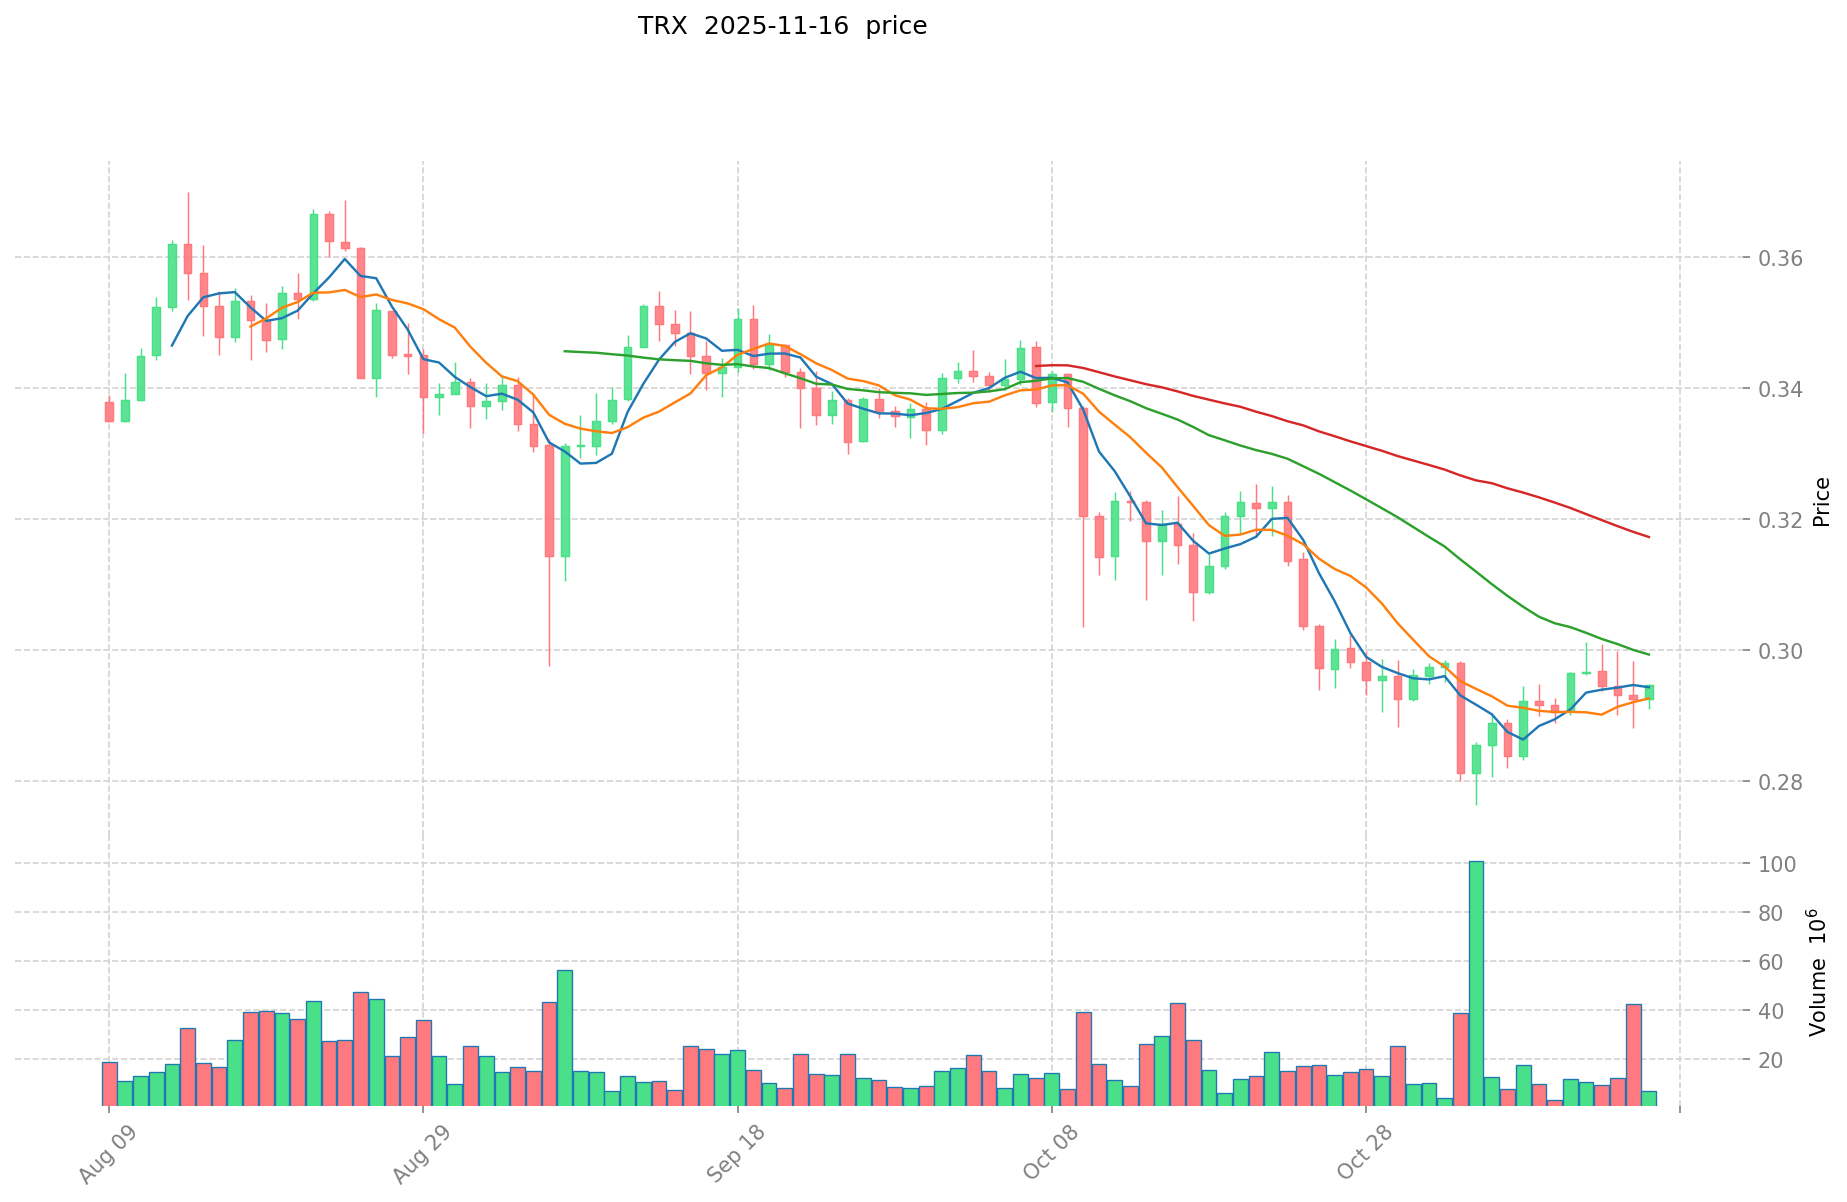
- Comparative analysis: In this market cycle, ARKM dropped from its peak of $3.9923 to a low of $0.1162, while TRX has shown more stability, currently trading near its all-time high of $0.431288.
Current Market Situation (2025-11-16)
- ARKM current price: $0.2942
- TRX current price: $0.29406
- 24-hour trading volume: ARKM $245,517.44 vs TRX $2,081,341.30
- Market Sentiment Index (Fear & Greed Index): 10 (Extreme Fear)
Click to view real-time prices:
- View ARKM current price Market Price
- View TRX current price Market Price
II. Key Factors Affecting the Investment Value of ARKM vs TRX
Supply Mechanisms (Tokenomics)
- ARKM: Fixed supply of 1 billion tokens with a vesting schedule for team and investors
- TRX: Inflationary model with rewards for block producers and voters; total supply of approximately 89.3 billion TRX
- 📌 Historical pattern: Fixed supply tokens like ARKM tend to benefit from scarcity value in bull markets, while TRX's reward-based model provides stability but may face inflationary pressure over time.
Institutional Adoption and Market Applications
- Institutional holdings: TRX has more established institutional presence with strategic partnerships in entertainment and gaming industries
- Enterprise adoption: TRX has broader enterprise adoption with partnerships across various sectors and a complete cross-chain interoperability solution, while ARKM is still emerging in the web3 gaming space
- Regulatory attitudes: Both face varied regulatory approaches across jurisdictions, with TRX having more established regulatory relationships in Asia
Technical Development and Ecosystem Building
- ARKM technical upgrades: Focus on AR technology integration and web3 gaming infrastructure development
- TRX technical development: Continuous improvement of the TRON network with high throughput and low fees; development of stablecoin ecosystem with USDD
- Ecosystem comparison: TRX has a more mature ecosystem spanning DeFi, NFTs, stablecoins and dApps with over 250 million accounts, while ARKM is building specifically in gaming and AR experiences
Macroeconomic and Market Cycles
- Performance during inflation: TRX has demonstrated more resilience during inflationary periods due to its established stablecoin ecosystem
- Macroeconomic monetary policy: Both tokens are affected by interest rates and USD strength, with TRX showing slightly more independence due to its wider geographic adoption
- Geopolitical factors: TRX has stronger presence in Asian markets while ARKM appears to have more Western orientation, creating different geopolitical risk profiles
III. 2025-2030 Price Prediction: ARKM vs TRX
Short-term Prediction (2025)
- ARKM: Conservative $0.1867 - $0.2964 | Optimistic $0.2964 - $0.3142
- TRX: Conservative $0.1738 - $0.2946 | Optimistic $0.2946 - $0.4125
Mid-term Prediction (2027)
- ARKM may enter a growth phase, with an estimated price range of $0.2335 - $0.4524
- TRX may enter a bullish market, with an estimated price range of $0.3296 - $0.4986
- Key drivers: Institutional capital inflow, ETF, ecosystem development
Long-term Prediction (2030)
- ARKM: Base scenario $0.3224 - $0.4885 | Optimistic scenario $0.4885 - $0.5129
- TRX: Base scenario $0.3076 - $0.6030 | Optimistic scenario $0.6030 - $0.8684
Disclaimer
ARKM:
| 年份 | 预测最高价 | 预测平均价格 | 预测最低价 | 涨跌幅 |
|---|---|---|---|---|
| 2025 | 0.314184 | 0.2964 | 0.186732 | 0 |
| 2026 | 0.42435588 | 0.305292 | 0.2900274 | 3 |
| 2027 | 0.4523816856 | 0.36482394 | 0.2334873216 | 24 |
| 2028 | 0.437205009696 | 0.4086028128 | 0.339140334624 | 38 |
| 2029 | 0.55400412373488 | 0.422903911248 | 0.25797138586128 | 43 |
| 2030 | 0.512876718366012 | 0.48845401749144 | 0.32237965154435 | 66 |
TRX:
| 年份 | 预测最高价 | 预测平均价格 | 预测最低价 | 涨跌幅 |
|---|---|---|---|---|
| 2025 | 0.412496 | 0.29464 | 0.1738376 | 0 |
| 2026 | 0.49145952 | 0.353568 | 0.31113984 | 20 |
| 2027 | 0.4985662368 | 0.42251376 | 0.3295607328 | 43 |
| 2028 | 0.630939797808 | 0.4605399984 | 0.405275198592 | 56 |
| 2029 | 0.66034527670584 | 0.545739898104 | 0.36018833274864 | 85 |
| 2030 | 0.868381325863084 | 0.60304258740492 | 0.307551719576509 | 105 |
IV. Investment Strategy Comparison: ARKM vs TRX
Long-term vs Short-term Investment Strategies
- ARKM: Suitable for investors focused on web3 gaming and AR technology potential
- TRX: Suitable for investors seeking stability and ecosystem diversity
Risk Management and Asset Allocation
- Conservative investors: ARKM: 20% vs TRX: 80%
- Aggressive investors: ARKM: 40% vs TRX: 60%
- Hedging tools: Stablecoin allocation, options, cross-currency portfolios
V. Potential Risk Comparison
Market Risks
- ARKM: Higher volatility due to newer market entry and niche focus
- TRX: Exposure to broader crypto market trends and competition from other smart contract platforms
Technical Risks
- ARKM: Scalability, network stability
- TRX: Centralization concerns, potential security vulnerabilities
Regulatory Risks
- Global regulatory policies may have different impacts on both, with TRX potentially facing more scrutiny due to its wider adoption
VI. Conclusion: Which Is the Better Buy?
📌 Investment Value Summary:
- ARKM advantages: Niche focus on blockchain intelligence and gaming, potential for high growth
- TRX advantages: Established ecosystem, wider adoption, and more stable performance
✅ Investment Advice:
- New investors: Consider a smaller allocation to ARKM for potential growth, larger allocation to TRX for stability
- Experienced investors: Balanced approach with both tokens, adjusting based on risk tolerance
- Institutional investors: Strategic allocation to both, with emphasis on TRX for its established market presence
⚠️ Risk Warning: The cryptocurrency market is highly volatile. This article does not constitute investment advice. None
VII. FAQ
Q1: What are the main differences between ARKM and TRX? A: ARKM is focused on blockchain intelligence and web3 gaming, with a fixed supply of 1 billion tokens. TRX is a more established platform for decentralized content sharing with an inflationary model and a total supply of about 89.3 billion tokens. TRX has a broader ecosystem spanning DeFi, NFTs, and dApps, while ARKM is still emerging in its niche market.
Q2: Which token has shown better price stability? A: TRX has demonstrated more price stability compared to ARKM. While ARKM has shown significant volatility, dropping from its all-time high of $3.9923 to a low of $0.1162, TRX has been trading near its all-time high of $0.431288, showing more resilience in the market.
Q3: How do the long-term price predictions for ARKM and TRX compare? A: By 2030, ARKM's base scenario price range is predicted to be $0.3224 - $0.4885, with an optimistic scenario of $0.4885 - $0.5129. For TRX, the base scenario is $0.3076 - $0.6030, with an optimistic scenario of $0.6030 - $0.8684. TRX is projected to have a higher potential price ceiling in the long term.
Q4: What are the key factors affecting the investment value of ARKM and TRX? A: Key factors include supply mechanisms, institutional adoption, technical development, ecosystem building, and macroeconomic conditions. TRX generally has advantages in institutional adoption, enterprise partnerships, and a more mature ecosystem, while ARKM offers potential in the emerging web3 gaming and AR technology sectors.
Q5: How should investors allocate their portfolio between ARKM and TRX? A: Conservative investors might consider allocating 20% to ARKM and 80% to TRX, while more aggressive investors could opt for 40% ARKM and 60% TRX. The exact allocation should be based on individual risk tolerance and investment goals.
Q6: What are the main risks associated with investing in ARKM and TRX? A: For ARKM, risks include higher volatility, scalability issues, and network stability concerns. TRX faces risks related to centralization concerns, potential security vulnerabilities, and regulatory scrutiny due to its wider adoption. Both are subject to overall crypto market trends and regulatory risks.
Share
Content
Introduction: Investment Comparison of ARKM vs TRX
I. Price History Comparison and Current Market Status
II. Key Factors Affecting the Investment Value of ARKM vs TRX
III. 2025-2030 Price Prediction: ARKM vs TRX
IV. Investment Strategy Comparison: ARKM vs TRX
V. Potential Risk Comparison
VI. Conclusion: Which Is the Better Buy?
VII. FAQ

