AR vs QNT: Comparing Two Leading Blockchain Platforms for Enterprise Solutions
Introduction: AR vs QNT Investment Comparison
In the cryptocurrency market, the comparison between Arweave (AR) and Quant (QNT) has been an unavoidable topic for investors. The two not only differ significantly in market cap ranking, application scenarios, and price performance but also represent different positioning in the crypto asset landscape.
Arweave (AR): Since its launch in 2018, it has gained market recognition for its innovative approach to decentralized storage.
Quant (QNT): Introduced in 2018, it has been hailed as a solution for blockchain interoperability, positioning itself as a leader in enterprise-level blockchain adoption.
This article will comprehensively analyze the investment value comparison between AR and QNT, focusing on historical price trends, supply mechanisms, institutional adoption, technological ecosystems, and future predictions, attempting to answer the question investors care about most:
"Which is the better buy right now?"
I. Price History Comparison and Current Market Status
AR (Arweave) and QNT (Quant) Historical Price Trends
- 2021: AR reached its all-time high of $89.24 on November 5, 2021, likely due to increased interest in decentralized storage solutions.
- 2021: QNT hit its peak price of $427.42 on September 11, 2021, possibly influenced by growing adoption of its interoperability solutions.
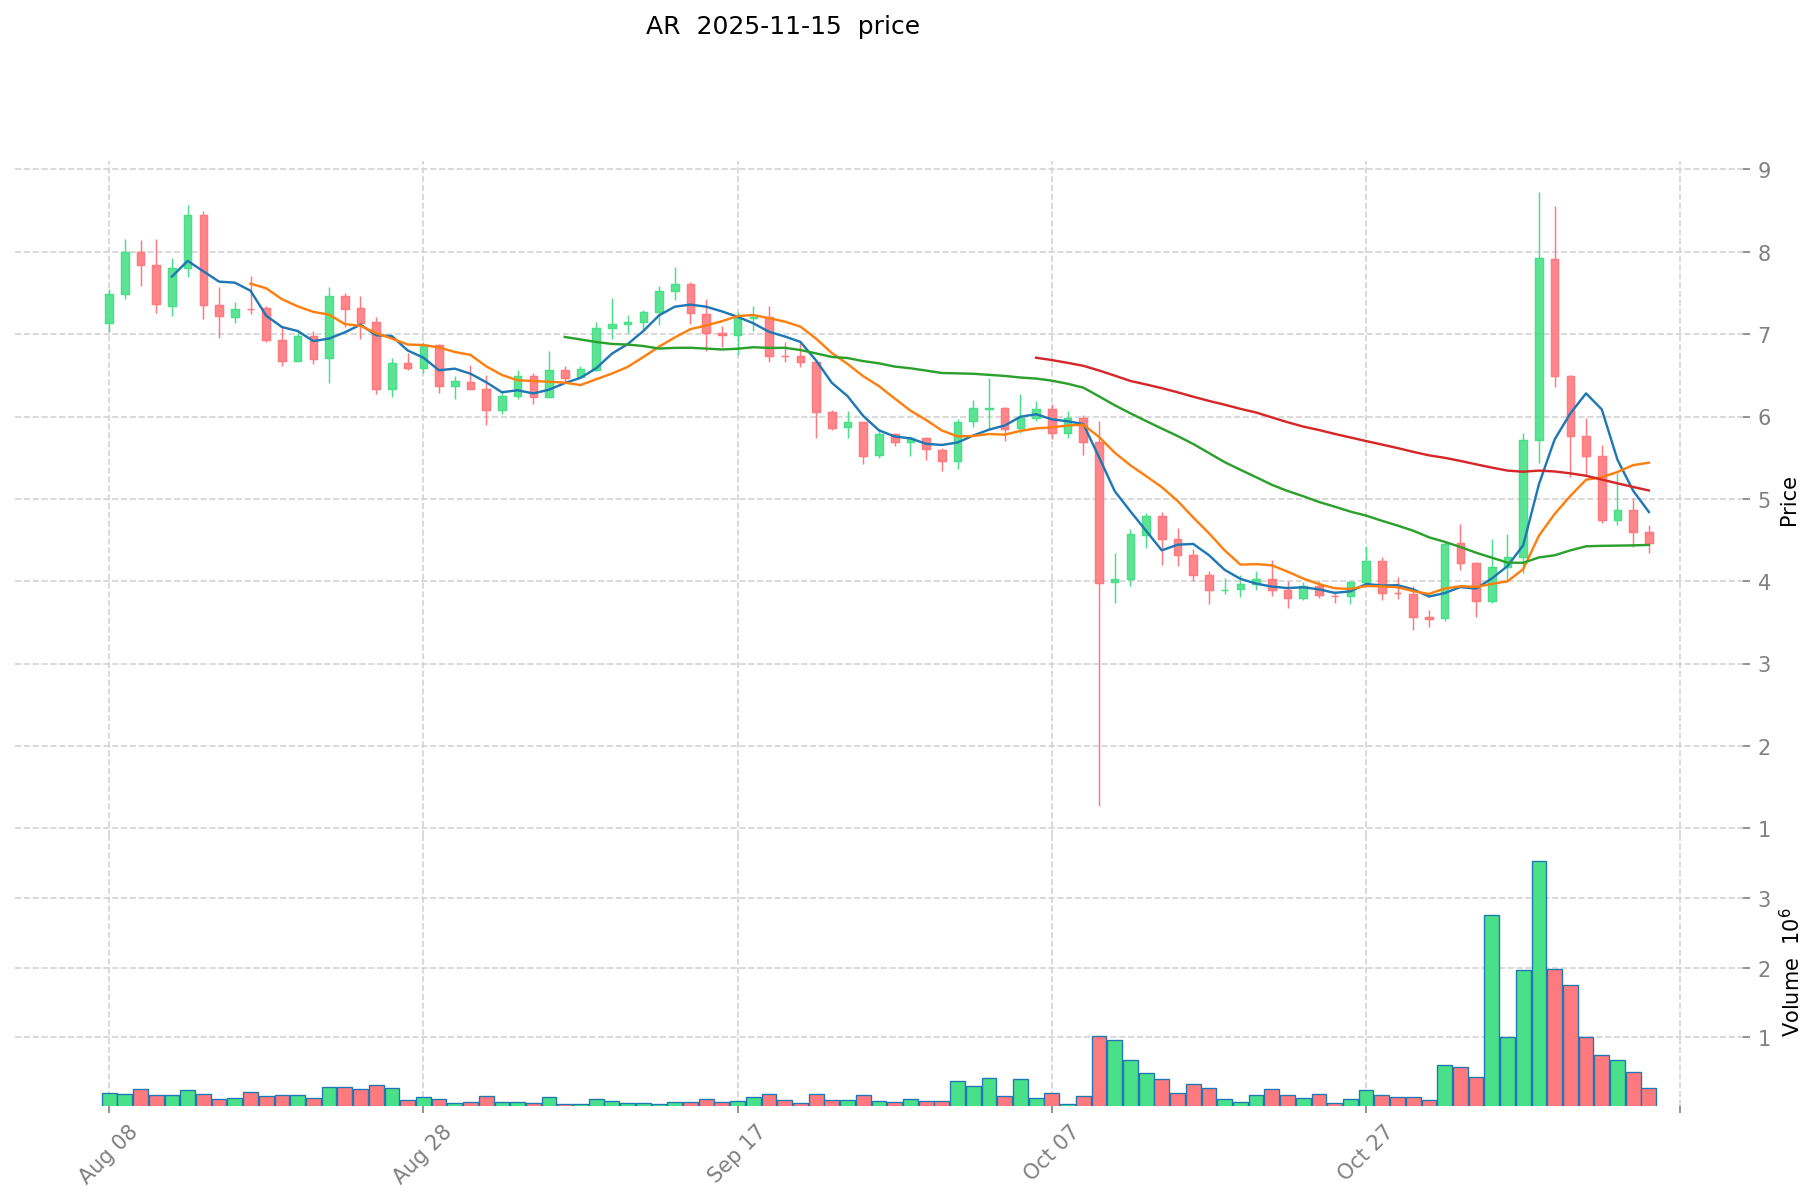
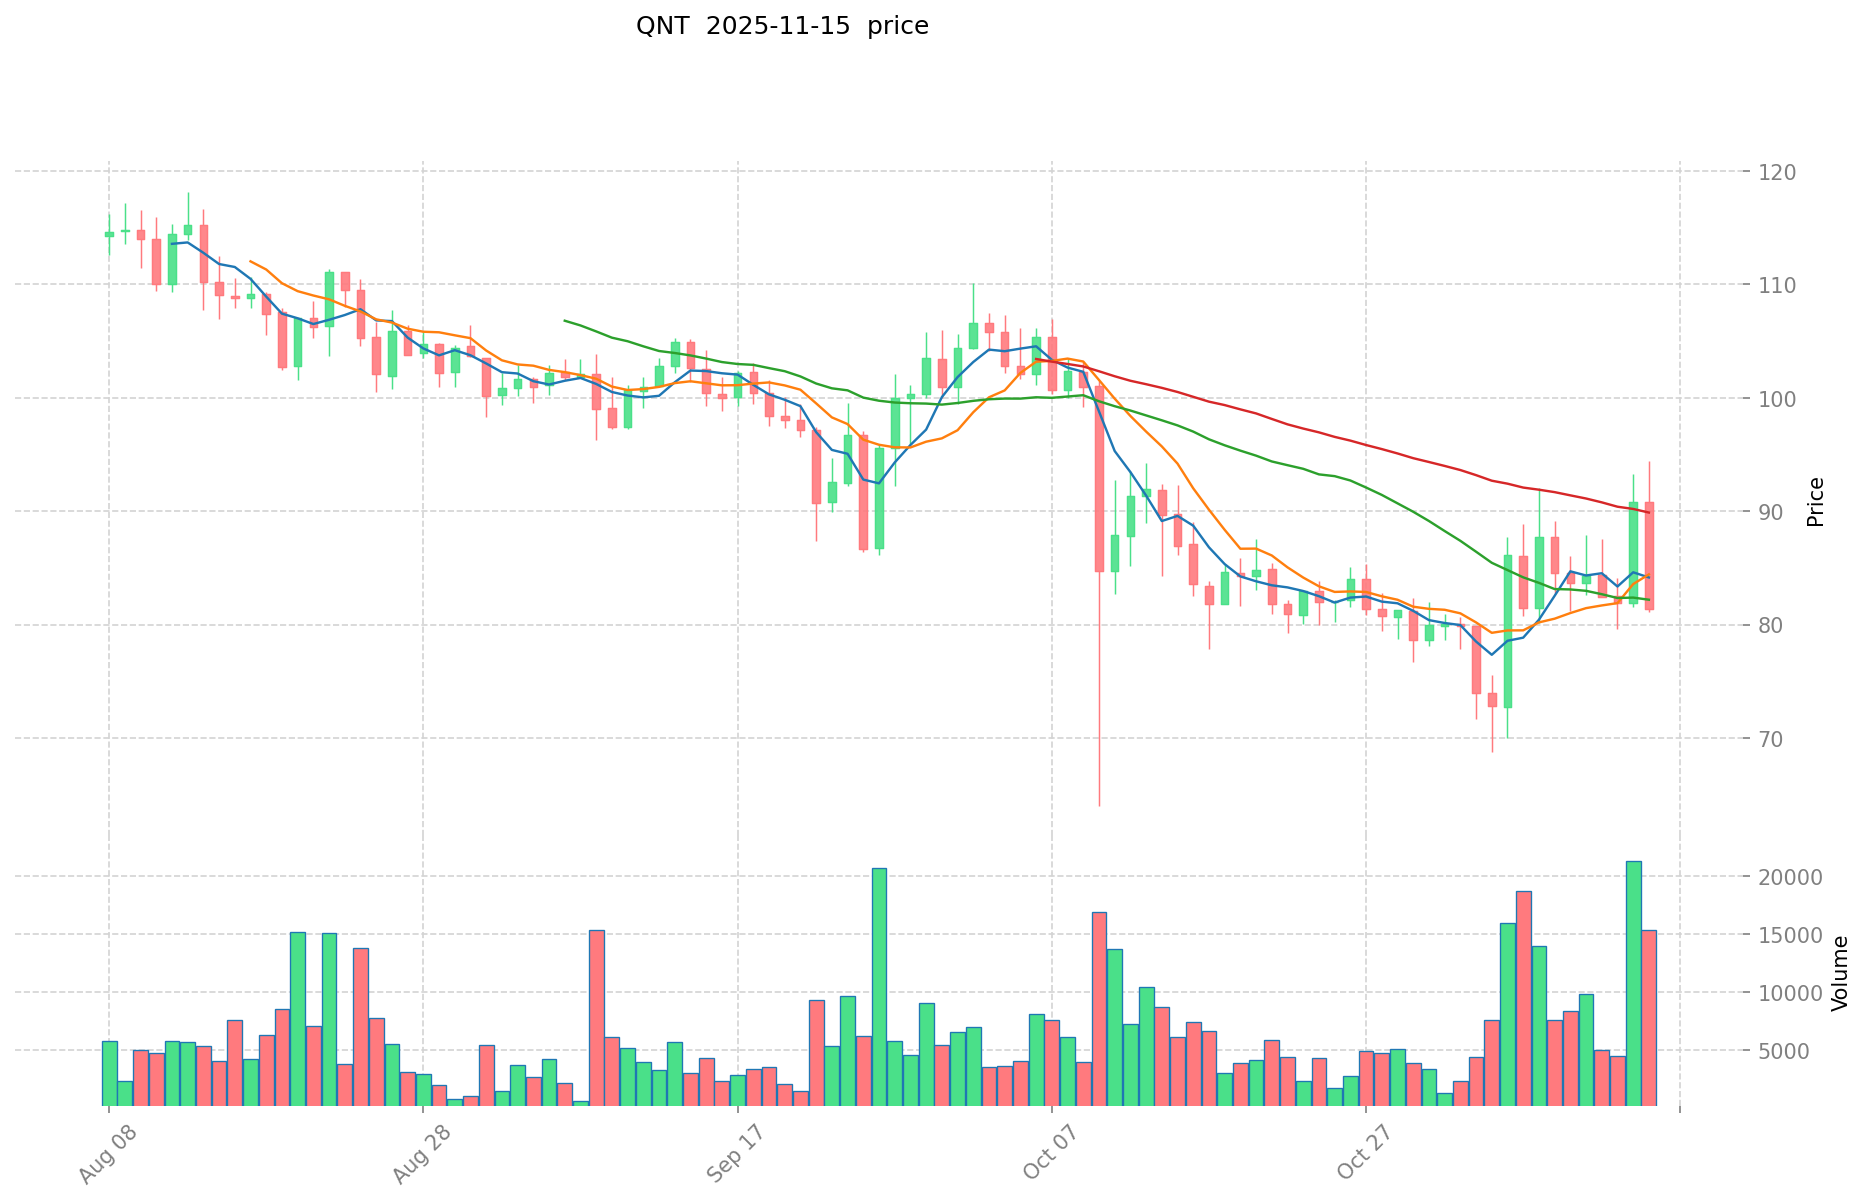
- Comparative analysis: In the recent market cycle, AR has fallen from its all-time high of $89.24 to a current price of $4.534, while QNT has dropped from $427.42 to $81.06.
Current Market Situation (2025-11-15)
- AR current price: $4.534
- QNT current price: $81.06
- 24-hour trading volume: AR $1,529,710.19 vs QNT $674,439.57
- Market Sentiment Index (Fear & Greed Index): 10 (Extreme Fear)
Click to view real-time prices:
- Check AR current price Market Price
- Check QNT current price Market Price
II. Core Factors Influencing Investment Value of AR vs QNT
Supply Mechanisms Comparison (Tokenomics)
- AR: Limited supply mechanism with a maximum cap of 66 million tokens; follows a logarithmic release schedule that slows over time
- QNT: Fixed supply of 14.6 million tokens with no additional issuance; deflationary model where tokens are removed from circulation when used for license payments
- 📌 Historical Pattern: Limited supply models typically create price pressure during adoption phases, with QNT's smaller supply potentially creating stronger scarcity effects during market rallies.
Institutional Adoption and Market Applications
- Institutional Holdings: QNT has gained significant enterprise interest through Overledger's connection to major financial networks and payment systems, while AR's institutional backing focuses on data permanence use cases
- Enterprise Adoption: QNT shows stronger enterprise integration through banking partnerships and payment systems, while AR focuses on data storage applications across various industries
- Regulatory Attitudes: QNT appears positioned more favorably within traditional financial regulation frameworks due to its enterprise focus and compliance design
Technical Development and Ecosystem Building
- AR Technical Upgrades: Continuous development of permanent storage solutions with bundling mechanism improvements and gateway optimizations
- QNT Technical Development: Overledger system connecting multiple blockchains with interoperability solutions for enterprise integration
- Ecosystem Comparison: QNT focuses primarily on enterprise blockchain interoperability and financial applications, while AR has broader development across data permanence, NFTs, and decentralized storage solutions
Macroeconomic Factors and Market Cycles
- Performance During Inflation: AR's data storage utility potentially offers inflation protection through practical utility value, while QNT's enterprise adoption provides stability during market volatility
- Monetary Policy Impact: Both assets show sensitivity to broader crypto market conditions influenced by Federal Reserve policies
- Geopolitical Factors: QNT's cross-border payment capabilities position it well for international financial infrastructure needs, while AR addresses global data sovereignty concerns
III. 2025-2030 Price Prediction: AR vs QNT
Short-term Prediction (2025)
- AR: Conservative $3.13 - $4.54 | Optimistic $4.54 - $4.72
- QNT: Conservative $57.63 - $81.17 | Optimistic $81.17 - $115.26
Mid-term Prediction (2027)
- AR may enter a growth phase, with estimated prices of $3.16 - $6.02
- QNT may enter a strong uptrend, with estimated prices of $108.24 - $154.79
- Key drivers: Institutional investment inflow, ETF developments, ecosystem growth
Long-term Prediction (2030)
- AR: Base scenario $3.65 - $6.88 | Optimistic scenario $6.88 - $8.12
- QNT: Base scenario $124.28 - $188.31 | Optimistic scenario $188.31 - $271.16
Disclaimer: These predictions are based on historical data and market analysis. Cryptocurrency markets are highly volatile and subject to change. This information should not be considered as financial advice. Always conduct your own research before making investment decisions.
AR:
| 年份 | 预测最高价 | 预测平均价格 | 预测最低价 | 涨跌幅 |
|---|---|---|---|---|
| 2025 | 4.7164 | 4.535 | 3.12915 | 0 |
| 2026 | 5.412069 | 4.6257 | 2.544135 | 2 |
| 2027 | 6.0226614 | 5.0188845 | 3.161897235 | 10 |
| 2028 | 7.3426280235 | 5.52077295 | 3.754125606 | 21 |
| 2029 | 7.332138554895 | 6.43170048675 | 6.2387494721475 | 41 |
| 2030 | 8.12066503457055 | 6.8819195208225 | 3.647417346035925 | 51 |
QNT:
| 年份 | 预测最高价 | 预测平均价格 | 预测最低价 | 涨跌幅 |
|---|---|---|---|---|
| 2025 | 115.2614 | 81.17 | 57.6307 | 0 |
| 2026 | 134.555509 | 98.2157 | 71.697461 | 21 |
| 2027 | 154.792853985 | 116.3856045 | 108.238612185 | 43 |
| 2028 | 168.1306442607 | 135.5892292425 | 105.75959880915 | 67 |
| 2029 | 224.752706392368 | 151.8599367516 | 89.597362683444 | 87 |
| 2030 | 271.16110306365696 | 188.306321571984 | 124.28217223750944 | 132 |
IV. Investment Strategy Comparison: AR vs QNT
Long-term vs Short-term Investment Strategies
- AR: Suitable for investors focusing on decentralized storage solutions and data permanence
- QNT: Suitable for investors interested in enterprise blockchain adoption and interoperability
Risk Management and Asset Allocation
- Conservative investors: AR: 30% vs QNT: 70%
- Aggressive investors: AR: 60% vs QNT: 40%
- Hedging tools: Stablecoin allocation, options, cross-currency portfolios
V. Potential Risk Comparison
Market Risks
- AR: Volatility due to relatively lower trading volume and market cap
- QNT: Dependence on enterprise adoption rates and market cycles
Technical Risks
- AR: Scalability, network stability
- QNT: Interoperability challenges, potential security vulnerabilities
Regulatory Risks
- Global regulatory policies may impact AR and QNT differently, with QNT potentially facing more scrutiny due to its focus on financial applications
VI. Conclusion: Which Is the Better Buy?
📌 Investment Value Summary:
- AR advantages: Innovative decentralized storage solution, limited token supply
- QNT advantages: Strong enterprise adoption, interoperability focus, fixed supply tokenomics
✅ Investment Advice:
- New investors: Consider a balanced approach, leaning towards QNT for its enterprise adoption
- Experienced investors: Explore AR for its growth potential in decentralized storage
- Institutional investors: Focus on QNT for its enterprise-grade solutions and regulatory compatibility
⚠️ Risk Warning: Cryptocurrency markets are highly volatile. This article does not constitute investment advice. None
VII. FAQ
Q1: What are the main differences between AR and QNT? A: AR focuses on decentralized storage solutions, while QNT specializes in blockchain interoperability. AR has a maximum supply of 66 million tokens, while QNT has a fixed supply of 14.6 million tokens. QNT has stronger enterprise adoption, particularly in the financial sector.
Q2: Which coin has performed better historically? A: Both coins reached their all-time highs in 2021, with AR peaking at $89.24 and QNT at $427.42. Since then, AR has fallen to $4.534, while QNT has dropped to $81.06. QNT has shown relatively better price retention.
Q3: What are the key factors influencing the investment value of AR and QNT? A: Key factors include supply mechanisms, institutional adoption, technical development, ecosystem building, and macroeconomic factors. QNT's enterprise focus and interoperability solutions give it an edge in institutional adoption, while AR's innovative storage solutions provide unique value in data permanence.
Q4: What are the price predictions for AR and QNT by 2030? A: By 2030, AR is predicted to reach between $3.65 and $8.12 in various scenarios, while QNT is expected to range from $124.28 to $271.16. These predictions are based on historical data and market analysis but should not be considered as financial advice.
Q5: How should investors allocate their portfolio between AR and QNT? A: Conservative investors might consider allocating 30% to AR and 70% to QNT, while aggressive investors might opt for 60% AR and 40% QNT. However, individual allocations should be based on personal risk tolerance and investment goals.
Q6: What are the main risks associated with investing in AR and QNT? A: Both face market risks such as volatility. AR has technical risks related to scalability and network stability, while QNT faces interoperability challenges and potential security vulnerabilities. Regulatory risks may affect both, with QNT potentially facing more scrutiny due to its focus on financial applications.
Q7: Which coin is considered the better buy overall? A: The better buy depends on individual investment goals. QNT may be more suitable for those interested in enterprise blockchain adoption and interoperability, while AR might appeal to investors focusing on decentralized storage solutions. New investors might lean towards QNT for its enterprise adoption, while experienced investors could explore AR for its growth potential in decentralized storage.
Share
Content
Introduction: AR vs QNT Investment Comparison
I. Price History Comparison and Current Market Status
II. Core Factors Influencing Investment Value of AR vs QNT
III. 2025-2030 Price Prediction: AR vs QNT
IV. Investment Strategy Comparison: AR vs QNT
V. Potential Risk Comparison
VI. Conclusion: Which Is the Better Buy?
VII. FAQ

