2025 ZAP Price Prediction: Expert Analysis and Market Forecast for the Coming Year

Introduction: ZAP's Market Position and Investment Value
ZAP (ZAP) is a platform that effectively connects capital and community through socialized and gamified mechanisms. Since its launch in October 2024, ZAP has introduced innovative approaches to democratize early-stage investing by leveraging on-chain data. As of January 2026, ZAP maintains a market capitalization of $57,661.88 with a circulating supply of approximately 63.75 million tokens, trading at around $0.0009045 per token. This distinctive asset, recognized for its community-driven investment platform model, is playing an increasingly significant role in reshaping how founders and investors participate in early-stage project ecosystems.
This article will comprehensively analyze ZAP's price trajectory from 2026 through 2031, integrating historical price patterns, market supply-demand dynamics, ecosystem development, and macroeconomic factors to provide investors with professional price forecasts and actionable investment strategies.
ZAP Market Analysis Report
I. ZAP Price History Review and Current Market Status
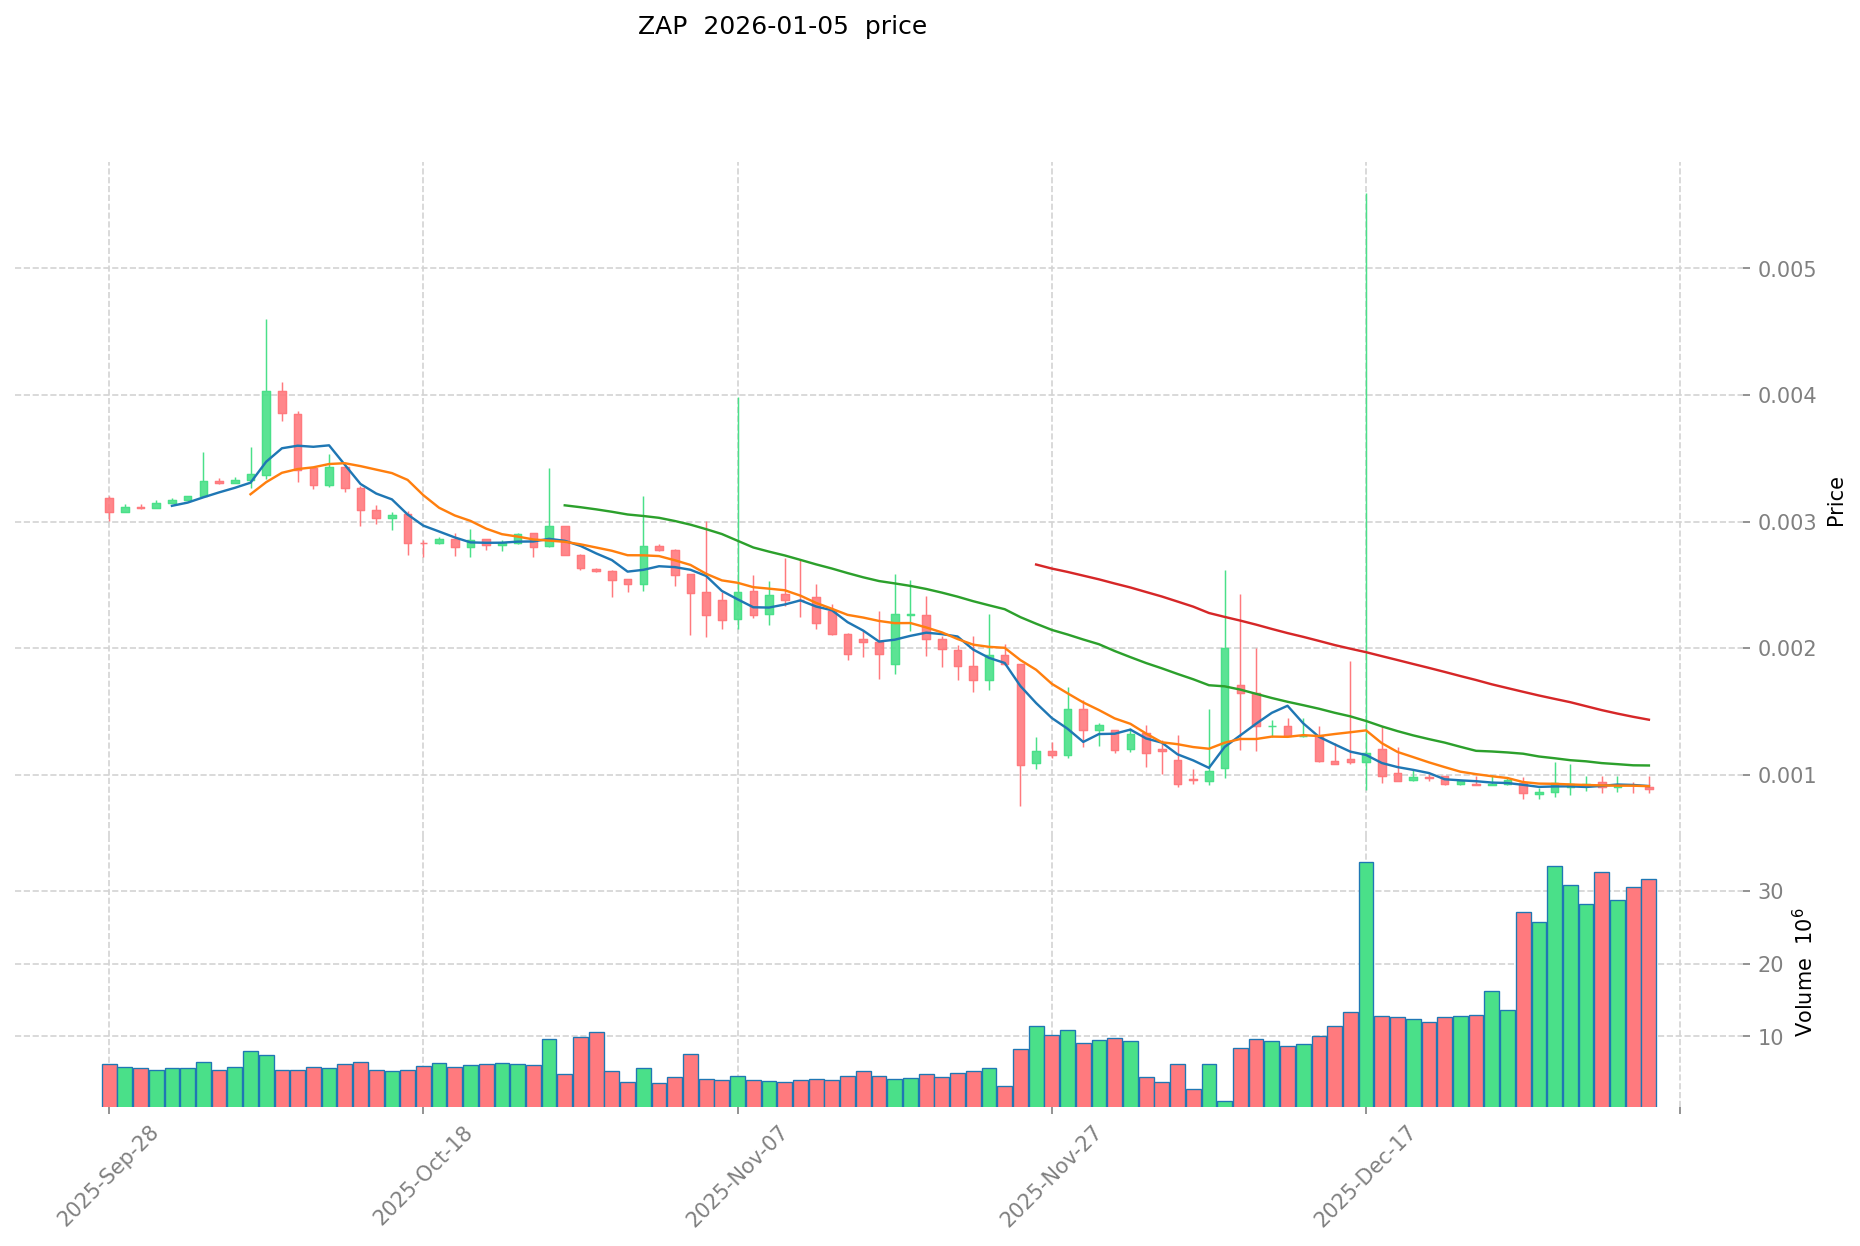
ZAP Historical Price Evolution
-
October 2024: ZAP reached its all-time high (ATH) of $0.8375 on October 9, 2024, marking the peak of the token's market performance.
-
November 2025: ZAP hit its all-time low (ATL) of $0.00075 on November 25, 2025, representing a significant decline from historical highs.
-
2024-2025 Period: The token experienced a severe depreciation of approximately 96.92% over the one-year period, declining from higher valuations to current levels.
ZAP Current Market Posture
As of January 5, 2026, ZAP is trading at $0.0009045 with a 24-hour trading volume of $28,375.05. The token demonstrates mixed short-term momentum with a -1.099% decline in the past hour, a -0.73% decrease over 24 hours, yet shows a positive 3.93% gain over the 7-day period. The 30-day performance reflects a -7.12% downturn.
The token's market capitalization stands at $57,661.88 with a fully diluted valuation (FDV) of $316,575.00, positioning ZAP at a market capitalization rank of 5,576. The circulating supply consists of 63,750,000 ZAP tokens out of a total and maximum supply of 350,000,000 tokens, representing an 18.21% circulation ratio.
ZAP maintains a market dominance of 0.0000095%, with 7,155 token holders and a presence on the BASE blockchain. The token is currently listed on Gate.com for trading, with market sentiment indicators showing a "Fear" reading (VIX of 26), reflecting cautious market conditions.
Click to view current ZAP market price
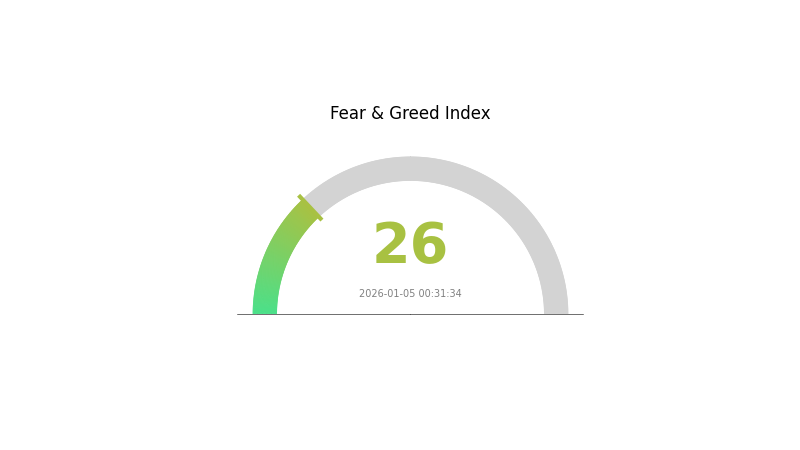
ZAP Market Sentiment Indicator
2026-01-05 Fear and Greed Index: 26 (Fear)
Click to view current Fear & Greed Index
The crypto market is currently experiencing a fear sentiment with an index reading of 26. This indicates heightened market anxiety and risk aversion among investors. During such periods, market volatility typically increases as participants become more cautious. This environment presents both challenges and opportunities - conservative investors may adopt a wait-and-see approach, while experienced traders might identify potential entry points. Monitoring market fundamentals and maintaining a disciplined trading strategy remain essential during periods of market fear. Consider diversifying your portfolio and avoid making impulsive decisions based on short-term market fluctuations on Gate.com.
ZAP Holdings Distribution
The address holdings distribution represents the concentration of ZAP tokens across blockchain addresses, serving as a critical indicator of token ownership structure and market decentralization. By analyzing the proportion of tokens held by individual addresses, investors and analysts can assess potential market risks, governance dynamics, and the likelihood of coordinated selling pressure or price manipulation.
Current data reveals a pronounced concentration pattern in ZAP's holder distribution. The top address commands 56.26% of total holdings, while the combined top four addresses control 83.65% of the circulating supply. This extreme concentration suggests significant centralization risk, as a relatively small number of entities exercise disproportionate control over token distribution. The second-largest holder maintains a 10.42% stake, followed by three addresses holding approximately 8-9% each. The remaining 11.97% distribution among other addresses indicates a fragmented base of smaller holders with minimal individual influence.
Such concentrated holdings present material implications for market structure and price dynamics. The dominant position of the leading address creates potential vulnerability to sudden liquidation events or coordinated exits that could exert substantial downward pressure on token valuation. The top-heavy distribution also raises governance concerns, as token-weighted decision-making mechanisms could be heavily influenced by a handful of entities. Additionally, the gradual distribution from major holders to the broader community base suggests the token remains in a relatively early stage of maturity, with ongoing need for improved holder diversification to establish more robust market resilience and authentic decentralization.
Click to view current ZAP Holdings Distribution
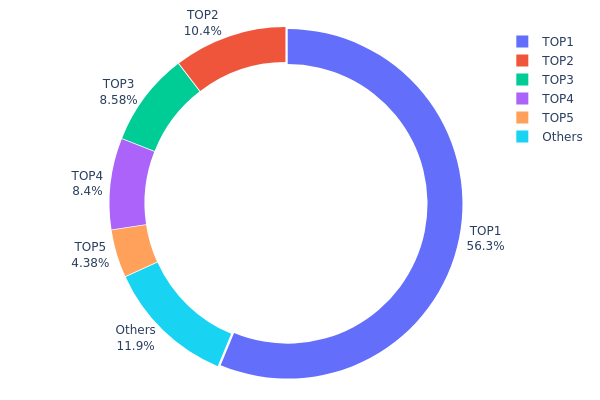
| Top | Address | Holding Qty | Holding (%) |
|---|---|---|---|
| 1 | 0x4cb1...f378d8 | 196941.97K | 56.26% |
| 2 | 0xf9e9...d36742 | 36475.39K | 10.42% |
| 3 | 0xc7cb...d836fc | 30036.37K | 8.58% |
| 4 | 0x1366...cc544d | 29395.12K | 8.39% |
| 5 | 0x3fa1...72ded4 | 15334.60K | 4.38% |
| - | Others | 41816.55K | 11.97% |
II. Core Factors Affecting ZAP's Future Price
Macroeconomic Environment
-
Monetary Policy Impact: Federal Reserve rate cuts, geopolitical tensions, and central bank buying activity influence cryptocurrency price movements. Market sentiment is also a key driver of price fluctuations.
-
Market Demand and Acceptance: Cryptocurrency prices are influenced by market demand, adoption levels, and overall market sentiment. Investor interest and confidence in the asset class directly impact price trajectories.
Regulatory Changes
- Regulatory Environment: Changes in cryptocurrency regulations significantly affect price movements. Investors should monitor policy developments and compliance requirements that may impact the ZAP ecosystem.
III. 2026-2031 ZAP Price Forecast
2026 Outlook
- Conservative Forecast: $0.0005 - $0.00088
- Neutral Forecast: $0.00088
- Bearish Forecast: $0.00097 (requires market correction)
2027-2029 Medium-term Outlook
- Market Phase Expectation: Recovery and consolidation phase with gradual upward momentum
- Price Range Forecast:
- 2027: $0.00049 - $0.001
- 2028: $0.00055 - $0.00141
- 2029: $0.00082 - $0.00167
- Key Catalysts: Increased adoption of ZAP protocol, expansion of ecosystem partnerships, growing demand for decentralized data solutions, and improved market sentiment in the broader crypto sector
2030-2031 Long-term Outlook
- Base Case Scenario: $0.0017 - $0.00143 (assuming steady ecosystem development and moderate market growth)
- Optimistic Scenario: $0.00175 - $0.00157 (contingent on widespread protocol adoption and increased institutional interest)
- Transformative Scenario: $0.00175+ (under conditions of breakthrough technological advancements and significant mainstream adoption acceleration)
- 2031-12-31: ZAP reaches $0.00175 (peak price milestone achieved with sustained momentum)
| 年份 | 预测最高价 | 预测平均价格 | 预测最低价 | 涨跌幅 |
|---|---|---|---|---|
| 2026 | 0.00097 | 0.00088 | 0.0005 | -2 |
| 2027 | 0.001 | 0.00093 | 0.00049 | 2 |
| 2028 | 0.00141 | 0.00097 | 0.00055 | 6 |
| 2029 | 0.00167 | 0.00119 | 0.00082 | 31 |
| 2030 | 0.0017 | 0.00143 | 0.00094 | 58 |
| 2031 | 0.00175 | 0.00157 | 0.00147 | 73 |
ZAP Investment Strategy and Risk Management Report
IV. ZAP Professional Investment Strategy and Risk Management
ZAP Investment Methodology
(1) Long-term Holding Strategy
- Suitable Investors: Community-focused participants and early-stage ecosystem believers
- Operational Recommendations:
- Accumulate ZAP tokens during market downturns to average your entry cost, given the current 96.92% annual decline indicating potential oversold conditions
- Participate actively in ZAP's gamified and socialized mechanisms to gain deeper ecosystem engagement and potential rewards
- Hold tokens through multiple market cycles to benefit from long-term ecosystem participation incentives
(2) Active Trading Strategy
- Technical Analysis Indicators:
- 24-hour Price Action: Monitor the current -0.73% decline within the $0.000856-$0.00099 range to identify support and resistance levels
- 7-day Momentum: Track the positive 3.93% weekly gain as a potential trend reversal indicator
- Wave Trading Key Points:
- Enter positions during short-term dips, supported by positive weekly momentum signals
- Exit when facing sustained downward pressure aligned with the broader one-year declining trend
ZAP Risk Management Framework
(1) Asset Allocation Principles
- Conservative Investors: 2-3% portfolio allocation maximum
- Active Investors: 5-8% portfolio allocation
- Professional Investors: 10-15% portfolio allocation for specialized trading strategies
(2) Risk Hedging Solutions
- Position Sizing: Implement strict position limits given the extreme volatility (down 96.92% annually) to protect capital
- Diversification Strategy: Balance ZAP holdings with stable, established cryptocurrencies to mitigate concentration risk
(3) Secure Storage Solutions
- Exchange Custody: Store actively-traded ZAP on Gate.com for convenient access and liquidity
- Personal Security: Transfer long-term holdings to self-custodial solutions for enhanced security control
- Security Precautions: Enable all available security features on Gate.com, use strong authentication methods, and never share private keys or recovery phrases
V. ZAP Potential Risks and Challenges
ZAP Market Risks
- Extreme Volatility: The token has declined 96.92% over one year and peaked at $0.8375 (October 2024), indicating severe price instability unsuitable for risk-averse investors
- Low Trading Volume: Daily volume of $28,375 reflects limited market liquidity, potentially resulting in significant slippage for large orders
- Market Capitalization Concentration: With only 7,155 token holders and a market cap of $57,661.88, the token exhibits centralization risks and potential whale manipulation vulnerability
ZAP Regulatory Risks
- Emerging Platform Status: As a relatively new platform connecting capital and community, ZAP faces uncertain regulatory treatment across different jurisdictions
- Compliance Uncertainty: The tokenomics structure and investment democratization model may face future regulatory scrutiny regarding securities classification
ZAP Technical Risks
- Smart Contract Exposure: Operations on BASE Chain require constant monitoring of contract security and potential blockchain-level vulnerabilities
- Platform Dependency: The ZAP ecosystem relies on continued development and maintenance of its socialized and gamified mechanisms
VI. Conclusions and Action Recommendations
ZAP Investment Value Assessment
ZAP presents a high-risk, speculative investment opportunity centered on connecting capital and community through innovative gamified mechanisms. The 96.92% annual decline, limited liquidity, and small holder base suggest a project in early market discovery phase. While the long-term vision of democratizing early-stage investing holds theoretical merit, the current market metrics indicate substantial downside risk and volatility. The 7-day positive momentum (3.93%) may represent tactical buying opportunities, but this should not overshadow the pronounced long-term bearish trend.
ZAP Investment Recommendations
✅ Beginners: Consider minimal allocation (1-2% of speculative portfolio) only after thorough research into ZAP's ecosystem mechanics and community participation models
✅ Experienced Investors: Use ZAP as a tactical trading vehicle focused on short-term momentum reversals and wave trading around identified support levels, while maintaining strict position size discipline
✅ Institutional Investors: Conduct comprehensive due diligence on platform mechanics, tokenomics sustainability, and regulatory compliance before considering allocation
ZAP Trading Participation Methods
- Direct Trading on Gate.com: Access ZAP spot trading pairs to execute buy, sell, or position management strategies
- Community Participation: Engage with ZAP's gamified and socialized mechanisms to understand platform utility and potential reward mechanisms
- Strategic Accumulation: Dollar-cost averaging during extended downtrends to potentially benefit from future ecosystem growth
Cryptocurrency investment carries extreme risk. This report does not constitute investment advice. Investors should make decisions based on their individual risk tolerance and financial situation. Consult with professional financial advisors before investing. Never invest more capital than you can afford to lose completely.
FAQ
What is ZAP token? What are its uses and application scenarios?
ZAP is a utility token designed for creating and managing smart contracts. It enables developers to build decentralized applications, publish smart contracts, and integrate real-world data onto the blockchain. ZAP facilitates automation and protocol execution in blockchain ecosystems.
What is the historical price performance of ZAP token? What are the main factors affecting price fluctuations?
ZAP token's price has fluctuated based on market demand, scarcity, and technical utility. Key factors include overall crypto market trends, technology development, community engagement, and network adoption. Price movements reflect broader market sentiment and ZAP's evolving use cases.
What are expert predictions for ZAP token's future price? What is the price outlook for 2024-2025?
Experts predict ZAP token may experience significant growth in 2024-2025, driven by AI sector momentum. However, specific price targets remain uncertain. Monitor market dynamics and protocol adoption rates for clearer price direction.
What are the risks of investing in ZAP tokens? How should I evaluate its investment value?
ZAP investment risks include market volatility and technical factors. Evaluate value through historical price trends, trading volume analysis, and market momentum. Strong fundamentals and growing ecosystem adoption indicate positive long-term potential for ZAP.
What are the advantages and disadvantages of ZAP token compared to similar projects?
ZAP's main advantages include strong investment functionality supporting multiple decentralized trading platforms like Uniswap, Balancer, and Curve. Disadvantages may include market complexity and intense competition in the DeFi aggregator space.
How to predict ZAP price trends through technical analysis? What are the key technical indicators?
Predict ZAP price trends using key indicators: Moving Averages (MA), RSI, MACD, and CCI. These tools help identify trend direction, momentum, and potential reversal points for price movements.
Share
Content
Introduction: ZAP's Market Position and Investment Value
I. ZAP Price History Review and Current Market Status
II. Core Factors Affecting ZAP's Future Price
III. 2026-2031 ZAP Price Forecast
IV. ZAP Professional Investment Strategy and Risk Management
V. ZAP Potential Risks and Challenges
VI. Conclusions and Action Recommendations
FAQ
How to Buy Cryptocurrency


Where to Find Alpha in the 2025 Crypto Spot Market

why is crypto crashing and will it recover ?

Gate Launchpad Welcomes Ika (IKA): The Future of Privacy Computing on Sui

Pi to GBP: Price and Prediction
2025 CHZ Price Prediction: Will Chiliz Soar to New Heights in the Crypto Sports Market?
2025 BRETTPrice Prediction: Analyzing Future Market Trends, Challenges, and Growth Potential

TradFi Opens the Door to Cryptocurrencies: What It Means for Markets in 2026

TradFi Embraces Digital Assets as Japan Signals a New Era of Financial Integration

Is cryptocurrency mining legal in Germany?

Fear Market in Cryptocurrency: How to Navigate Extreme Sentiment and Find Opportunities

Coincheck: A Japan-Based Digital Currency Exchange