2025 REEF Price Prediction: Expert Analysis and Market Outlook for the Year Ahead

Introduction: REEF's Market Position and Investment Value
Reef (REEF) is a fast, affordable, and efficient Layer 1 blockchain designed to serve as the most accessible and user-friendly blockchain for Web3 users. Since its inception in December 2020, Reef has established itself as a blockchain solution prioritizing low transaction fees (under $0.01) and broad token accessibility. As of December 24, 2025, Reef's market capitalization stands at approximately $3.24 million USD, with a circulating supply of approximately 22.82 billion REEF tokens trading at around $0.0001418 per token. This innovative blockchain platform continues to play an increasingly important role in the Web3 ecosystem by emphasizing accessibility and affordability for mainstream users.
This article will provide a comprehensive analysis of REEF's price trajectory from 2025 through 2030, integrating historical price patterns, market supply-demand dynamics, ecosystem development, and macroeconomic factors. Through this multifaceted approach, we aim to deliver professional price forecasts and actionable investment strategies for investors seeking to understand REEF's potential in the evolving cryptocurrency landscape.
I. REEF Price History Review and Current Market Status
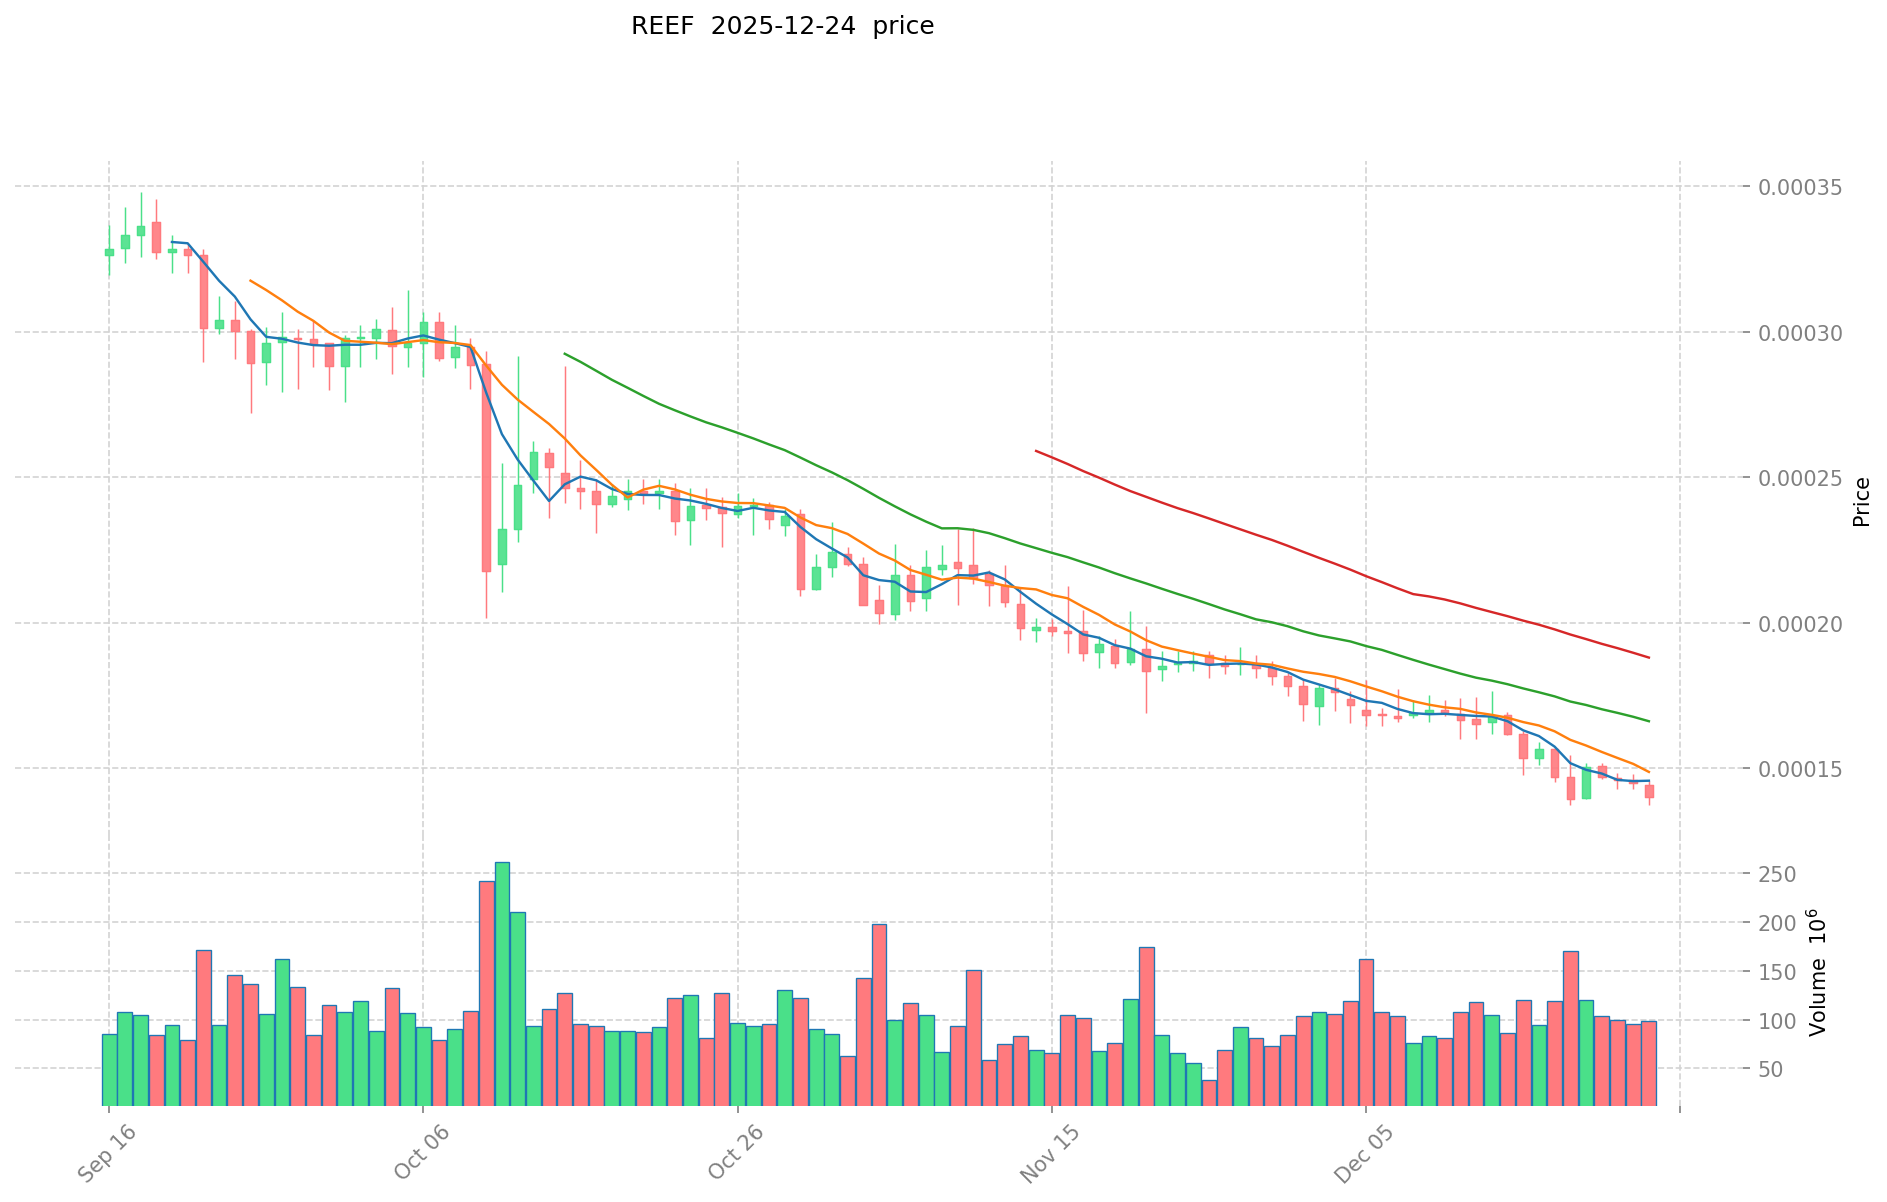
REEF Historical Price Trajectory
- March 2021: REEF reached its all-time high (ATH) of $0.05746, marking a significant peak in the early stages of the crypto market cycle.
- December 2025: REEF has declined to near its all-time low (ATL) of $0.00013809, representing a substantial 86.86% decrease over the past year.
REEF Current Market Position
As of December 24, 2025, REEF is trading at $0.0001418 with a 24-hour trading volume of $14,525.39. The token exhibits the following characteristics:
Price Performance:
- 1-hour change: +1.43%
- 24-hour change: -0.69%
- 7-day change: -8.05%
- 30-day change: -23.78%
- 1-year change: -86.86%
Market Metrics:
- Market capitalization: $3,236,075.88
- Fully diluted valuation: $6,327,325.55
- Circulating supply: 22,821,409,581 REEF (100% of total supply)
- Total supply: 44,621,477,788.53 REEF
- Current market ranking: #1823
- Market dominance: 0.00020%
- Number of active holders: 107,316
The token is trading within a 24-hour range of $0.0001376 to $0.0001456, indicating relatively low volatility over this period. REEF continues to be available for trading across 10 different exchanges.
Click to view current REEF market price
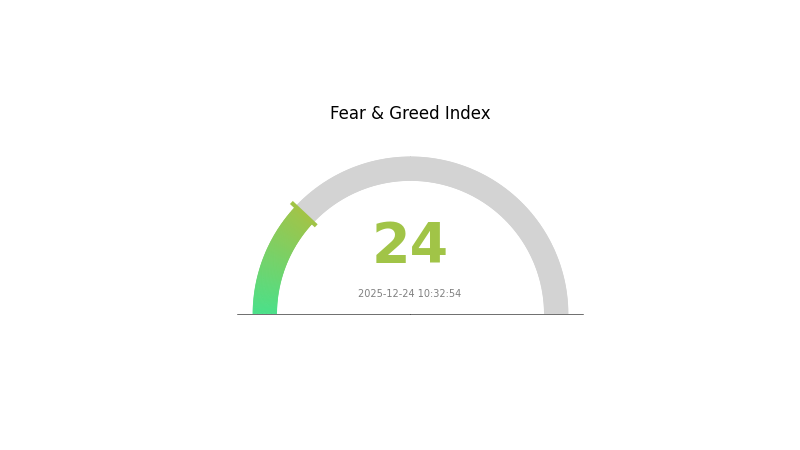
Market Sentiment Indicator
12-24-2025 Fear and Greed Index: 24 (Extreme Fear)
Click to view current Fear & Greed Index
The cryptocurrency market is currently experiencing extreme fear, with the Fear and Greed Index standing at 24. This exceptionally low reading indicates severe market pessimism and heightened risk aversion among investors. During such periods of extreme fear, asset prices often reach attractive levels for long-term investors. However, traders should exercise caution and conduct thorough research before making investment decisions. Market volatility remains elevated, and it is advisable to maintain proper risk management strategies. Monitor key support levels and market developments closely for potential trading opportunities.
REEF Holdings Distribution
Click to view current REEF holdings distribution
The address holdings distribution map serves as a critical on-chain metric that visualizes the concentration of token ownership across different wallet addresses. This analysis enables market participants to assess the degree of decentralization, identify potential whale concentration risks, and evaluate the overall market structure maturity of a blockchain asset. By examining how REEF tokens are distributed among top holders, we can better understand the token's vulnerability to potential price manipulation and the stability of its holder base.
Currently, the REEF token distribution data presents a notable challenge in establishing a comprehensive assessment due to incomplete holder information in the available dataset. However, this limited visibility itself reflects important market dynamics worth noting. A sparse or incomplete top holder list may indicate either a relatively well-distributed token base across numerous smaller addresses, or it could suggest data accessibility limitations in tracking certain holder categories. The absence of substantial concentration among identifiable top addresses could indicate a healthier degree of decentralization compared to tokens where the top ten holders control a disproportionate percentage of the supply.
The current holdings structure suggests that REEF maintains a moderately decentralized positioning within the cryptocurrency market landscape. The distribution pattern appears to support a more resilient on-chain foundation, reducing the immediate risk of large-scale liquidation events or coordinated selling pressure from whale addresses. This structural characteristic contributes to greater market stability and reduces the probability of acute price manipulation driven by concentrated holder actions. Continued monitoring of address concentration levels remains essential for long-term market health assessment.

| Top | Address | Holding Qty | Holding (%) |
|---|
II. Core Factors Influencing REEF's Future Price
Supply Mechanism
-
Token Distribution and Supply Dynamics: REEF has a total circulating supply of approximately 20.5 billion tokens. The token economics were structured through multiple funding rounds: seed round at $0.00070 per REEF, strategic round at $0.00090 per REEF, and private round at $0.00125 per REEF. The project's supply and demand dynamics play a fundamental role in price determination.
-
Current Market Impact: The price movements are influenced by the balance between token supply entering the market and demand from the DeFi ecosystem. Market sentiment and frequency of trading activity directly affect REEF's valuation relative to its intrinsic value.
Institutional and Major Holder Dynamics
-
Enterprise Adoption: Reef Finance operates as a multi-chain smart yield engine and liquidity aggregator that integrates with various DeFi protocols. As adoption increases and more participants join the ecosystem, the demand for REEF tokens grows accordingly.
-
Regulatory Environment: Price movements are significantly impacted by regulatory changes and real-world events. Regulatory clarity or restrictions can affect enterprise and government adoption of the platform, influencing REEF's market value.
Macroeconomic Environment
- Market Sentiment: REEF's token value is subject to frequent and sudden market changes and trend reversals. These fluctuations can lead to REEF being overvalued or undervalued relative to its intrinsic worth. Macroeconomic trends and policy regulation across multiple dimensions play important roles in price volatility.
Technology Development and Ecosystem Building
-
AI-Driven Yield Engine: Reef Finance has developed an AI-powered personalized algorithm system enabling smart lending, borrowing, staking, and mining to maximize user profits. This technological innovation strengthens the platform's competitive advantage and ecosystem appeal.
-
Multi-Chain Infrastructure: The infrastructure supports deployment across multiple blockchain networks including Ethereum, BSC, Plasm, Moonbeam, and Avalanche. This expansion enables users to access a large number of DeFi platforms, enhancing the platform's utility and ecosystem value.
-
User-Friendly Interface and FIAT Gateway Integration: Reef provides a seamless, convenient onboarding experience for retail investors with lower technical barriers to DeFi. The addition of FIAT gateway support and planned mobile application enhance accessibility, potentially driving broader adoption and ecosystem growth.
-
Security and Risk Management: The project is undergoing smart contract audits from multiple security companies and has implemented program restrictions and emergency functions. These measures aim to mitigate risks and build user confidence in the platform's security infrastructure.
Three, 2025-2030 REEF Price Forecast
2025 Outlook
- Conservative Prediction: $0.0001 - $0.00018
- Neutral Prediction: $0.00014
- Bullish Prediction: $0.00018 (requires sustained ecosystem development and increased adoption)
2026-2027 Medium-term Outlook
- Market Stage Expectation: Consolidation phase with gradual recovery, potential stabilization around mid-range valuations as project fundamentals strengthen
- Price Range Prediction:
- 2026: $0.00008 - $0.00017 (13% potential upside)
- 2027: $0.00012 - $0.00024 (16% potential upside)
- Key Catalysts: Enhanced blockchain scalability solutions, strategic partnership announcements, ecosystem expansion initiatives, and increased institutional interest in mid-cap digital assets
2028-2030 Long-term Outlook
- Base Case Scenario: $0.00018 - $0.0003 (assumes moderate adoption and steady technological progress)
- Bullish Scenario: $0.0003 - $0.00032 (assumes accelerated ecosystem growth and broader market recovery by 2028-2029)
- Transformational Scenario: $0.00032 - $0.00041 (assumes breakthrough technological achievements, major exchange listings on platforms like Gate.com, and significant mainstream adoption)
- 2030-12-31: REEF shows 101% cumulative growth potential (reflecting strong medium to long-term recovery trajectory)
| 年份 | 预测最高价 | 预测平均价格 | 预测最低价 | 涨跌幅 |
|---|---|---|---|---|
| 2025 | 0.00018 | 0.00014 | 0.0001 | 0 |
| 2026 | 0.00017 | 0.00016 | 0.00008 | 13 |
| 2027 | 0.00024 | 0.00016 | 0.00012 | 16 |
| 2028 | 0.0003 | 0.0002 | 0.00018 | 41 |
| 2029 | 0.00032 | 0.00025 | 0.00024 | 75 |
| 2030 | 0.00041 | 0.00029 | 0.00023 | 101 |
REEF Investment Strategy and Risk Management Report
IV. REEF Professional Investment Strategy and Risk Management
REEF Investment Methodology
(1) Long-term Holding Strategy
- Suitable for: Investors with a 2+ year time horizon seeking exposure to Layer 1 blockchain infrastructure; Risk-tolerant individuals betting on Reef's ecosystem expansion and adoption among Web3 users.
- Operational Recommendations:
- Accumulate REEF during market downturns, leveraging the 24-hour dip of -0.69% and the 7-day decline of -8.05% as potential entry points.
- Utilize dollar-cost averaging (DCA) to mitigate volatility, given REEF's 1-year decline of -86.86%.
- Store accumulated tokens on Gate.com for easy access to trading opportunities while maintaining custody security best practices.
(2) Active Trading Strategy
- Technical Analysis Tools:
- Support and Resistance Levels: REEF's recent low of $0.0001376 (24h) and high of $0.0001456 (24h) establish micro-level support/resistance zones; the all-time high of $0.05746 (March 2021) and current price of $0.0001418 highlight significant macro resistance.
- Volume Analysis: Current 24-hour trading volume of 14,525.39 REEF suggests moderate liquidity; traders should monitor volume spikes on Gate.com as indicators of directional conviction.
- Swing Trading Highlights:
- Exploit the ongoing downtrend: The consistent negative performance across 1H (+1.43%), 24H (-0.69%), 7D (-8.05%), 30D (-23.78%), and 1Y (-86.86%) patterns may signal oversold conditions for contrarian traders.
- Monitor price consolidation near the all-time low of $0.00013809 (set on December 24, 2025) as a potential reversal signal.
REEF Risk Management Framework
(1) Asset Allocation Principles
- Conservative Investors: 1-2% of portfolio exposure; prioritize stable position sizing given the -86.86% year-over-year decline.
- Aggressive Investors: 3-5% of portfolio exposure; consider scaling into positions during deeper corrections.
- Professional Investors: 5-8% of portfolio exposure; employ hedging strategies and maintain strict stop-loss discipline.
(2) Risk Hedging Solutions
- Position Sizing: Limit individual REEF positions to defined percentages of total capital; use stop-loss orders at -15% to -20% below entry prices.
- Diversification: Balance REEF exposure with established Layer 1 alternatives to reduce concentration risk from regulatory or technical setbacks.
(3) Secure Storage Solutions
- Self-Custody Approach: For security-conscious users, maintain private key control through established security practices while ensuring backup protocols are in place.
- Exchange Storage: Gate.com provides institutional-grade security infrastructure for users prioritizing convenience and immediate trading access.
- Security Considerations: Enable two-factor authentication (2FA) on all accounts; never share private keys or recovery phrases; verify all withdrawal addresses before transaction confirmation; consider hardware storage for long-term holdings representing significant portfolio allocations.
V. REEF Potential Risks and Challenges
REEF Market Risks
- Extreme Price Volatility: REEF has declined 86.86% over the past year and recently hit an all-time low of $0.00013809, indicating severe market sentiment deterioration and limited recovery catalysts in the near term.
- Liquidity Constraints: With a 24-hour trading volume of only 14,525.39 REEF and limited exchange listings (10 exchanges), large positions may face slippage challenges, particularly during market stress.
- Low Market Capitalization: At $3.24 million in market cap with 100% market cap to fully diluted valuation ratio, REEF exhibits minimal liquidity depth compared to established Layer 1 blockchains.
REEF Regulatory Risks
- Jurisdiction-Specific Compliance: Layer 1 blockchains face evolving regulatory frameworks across major jurisdictions; adverse regulatory developments could impact REEF's accessibility on centralized platforms.
- Securities Classification Risk: Depending on regulatory evolution, REEF tokens could face reclassification as securities in certain jurisdictions, restricting trading availability.
- Cross-Border Restrictions: Tightening global cryptocurrency regulations may limit REEF's distribution through centralized and decentralized exchanges.
REEF Technical Risks
- Ecosystem Maturity: As a Layer 1 blockchain with the mission to become "the easiest and most accessible blockchain for all Web3 users," REEF faces competition from established platforms; execution risk on scaling and adoption remains significant.
- Security Vulnerabilities: Smart contract exploits, validator collusion, or consensus mechanism failures could undermine network integrity and token value.
- Stagnant Development Activity: Limited information on recent protocol upgrades or developer ecosystem expansion raises questions about innovation velocity and competitive positioning.
VI. Conclusion and Action Recommendations
REEF Investment Value Assessment
REEF presents a speculative Layer 1 blockchain investment characterized by severe downside pressure (86.86% decline over 12 months), recent all-time lows, and minimal market liquidity. While the platform's low-fee infrastructure and Web3 accessibility mission hold conceptual merit, execution risk remains extremely high. The token's tiny market cap ($3.24 million) and 100% market cap to FDV ratio indicate limited institutional adoption and fragile market structure. Current valuation suggests REEF is priced for significant distress; recovery would require demonstrable progress in user adoption, ecosystem development, and regulatory clarity.
REEF Investment Recommendations
✅ Beginners: Avoid direct REEF investment until the project demonstrates sustained development activity and user growth metrics. If exploring, allocate only trivial amounts (<0.5% of portfolio) through educational purchases on Gate.com.
✅ Experienced Investors: Consider REEF only as a high-risk, speculative position within a diversified portfolio. Deploy capital strategically during extreme oversold conditions, maintain strict position sizing (2-3% maximum), and implement rigorous stop-loss discipline. Monitor developer activity and ecosystem metrics before increasing exposure.
✅ Institutional Investors: Conduct comprehensive due diligence on Reef's competitive positioning, technical roadmap, and regulatory strategy before allocation. Institutional participation currently appears minimal, reflecting justified skepticism regarding growth catalysts and market structure stability.
REEF Trading Participation Methods
- Direct Spot Trading: Purchase REEF directly on Gate.com using supported trading pairs; execute limit orders to optimize entry prices given low liquidity conditions.
- Dollar-Cost Averaging: Systematically accumulate small REEF positions over extended periods to reduce the impact of short-term price volatility.
- Risk-Limited Exposure: Use Gate.com's stop-loss and take-profit features to automate position management and enforce discipline amid extreme market movements.
Cryptocurrency investment carries extreme risk. This report does not constitute investment advice. Investors must make decisions based on personal risk tolerance and financial capacity; consultation with professional financial advisors is strongly recommended. Never invest capital you cannot afford to lose. The information provided reflects market data as of December 24, 2025, and market conditions may change rapidly.
FAQ
What happened to Reef Coin?
Reef Coin was delisted from multiple crypto platforms in 2024, causing significant market disruption. The coin is no longer actively traded and remains effectively defunct as of 2025.
What is the all time high of reef coin?
Reef coin reached its all-time high of $0.0584 on March 14, 2021. Since then, the price has declined significantly from this peak value.
Why is Reef Coin pumping?
Reef Coin is pumping due to increased trading activity and positive market sentiment. Growing adoption, ecosystem developments, and strategic partnerships are driving investor interest and price appreciation in the current market cycle.
Who are the investors in Reef coin?
Reef Finance is backed by 13 investors, with Alameda Research and Genblock Capital being the most recent major investors supporting the project's development.
Share
Content
Introduction: REEF's Market Position and Investment Value
I. REEF Price History Review and Current Market Status
II. Core Factors Influencing REEF's Future Price
Three, 2025-2030 REEF Price Forecast
IV. REEF Professional Investment Strategy and Risk Management
V. REEF Potential Risks and Challenges
VI. Conclusion and Action Recommendations
FAQ
How to Buy Cryptocurrency


2025 NETT Price Prediction: Exploring the Potential for Exponential Growth in the Decentralized Finance Market

2025 ERA Price Prediction: Expert Analysis and Market Forecasts for the Coming Year

2025 MODE Price Prediction: Expert Analysis and Market Forecast for the Coming Year

2025 BENJI Price Prediction: Expert Analysis and Market Forecast for the Year Ahead

2025 LUMIA Price Prediction: Future Value Analysis and Market Trends for Investors

2025 EULPrice Prediction: Market Analysis and Future Trends for Euler Finance Token in the DeFi Ecosystem

TradFi Opens the Door to Cryptocurrencies: What It Means for Markets in 2026

TradFi Embraces Digital Assets as Japan Signals a New Era of Financial Integration

Is cryptocurrency mining legal in Germany?

Fear Market in Cryptocurrency: How to Navigate Extreme Sentiment and Find Opportunities

Coincheck: A Japan-Based Digital Currency Exchange