2025 MYRIA Price Prediction: Expert Analysis and Market Forecast for the Upcoming Year

Introduction: Market Position and Investment Value of MYRIA
Myria (MYRIA) stands as an Ethereum Layer 2 expansion solution specifically designed for gaming, enabling the deployment of blockchain games and NFT development. Since its inception, Myria has established itself through strategic collaboration with StarkWare, leveraging cutting-edge ZK-Rollup technology to deliver instant transaction confirmation and gas-free transactions while maintaining robust asset security. As of December 2025, Myria's market capitalization stands at approximately $4.62 million, with a circulating supply of approximately 28.29 billion tokens, currently trading at $0.00009233 per token.
This innovative Layer 2 solution, recognized for its high-throughput architecture supporting up to 9,000 transactions per block, is playing an increasingly vital role in enabling scalable blockchain gaming experiences. MYRIA serves as the functional token of the Myria chain, powering ecosystem activities and governance.
This article will provide a comprehensive analysis of MYRIA's price trajectory through 2030, examining historical price patterns, market supply and demand dynamics, ecosystem development, and macroeconomic factors to deliver professional price forecasts and practical investment strategies for investors.
I. MYRIA Price History Review and Market Current Status
MYRIA Historical Price Evolution Trajectory
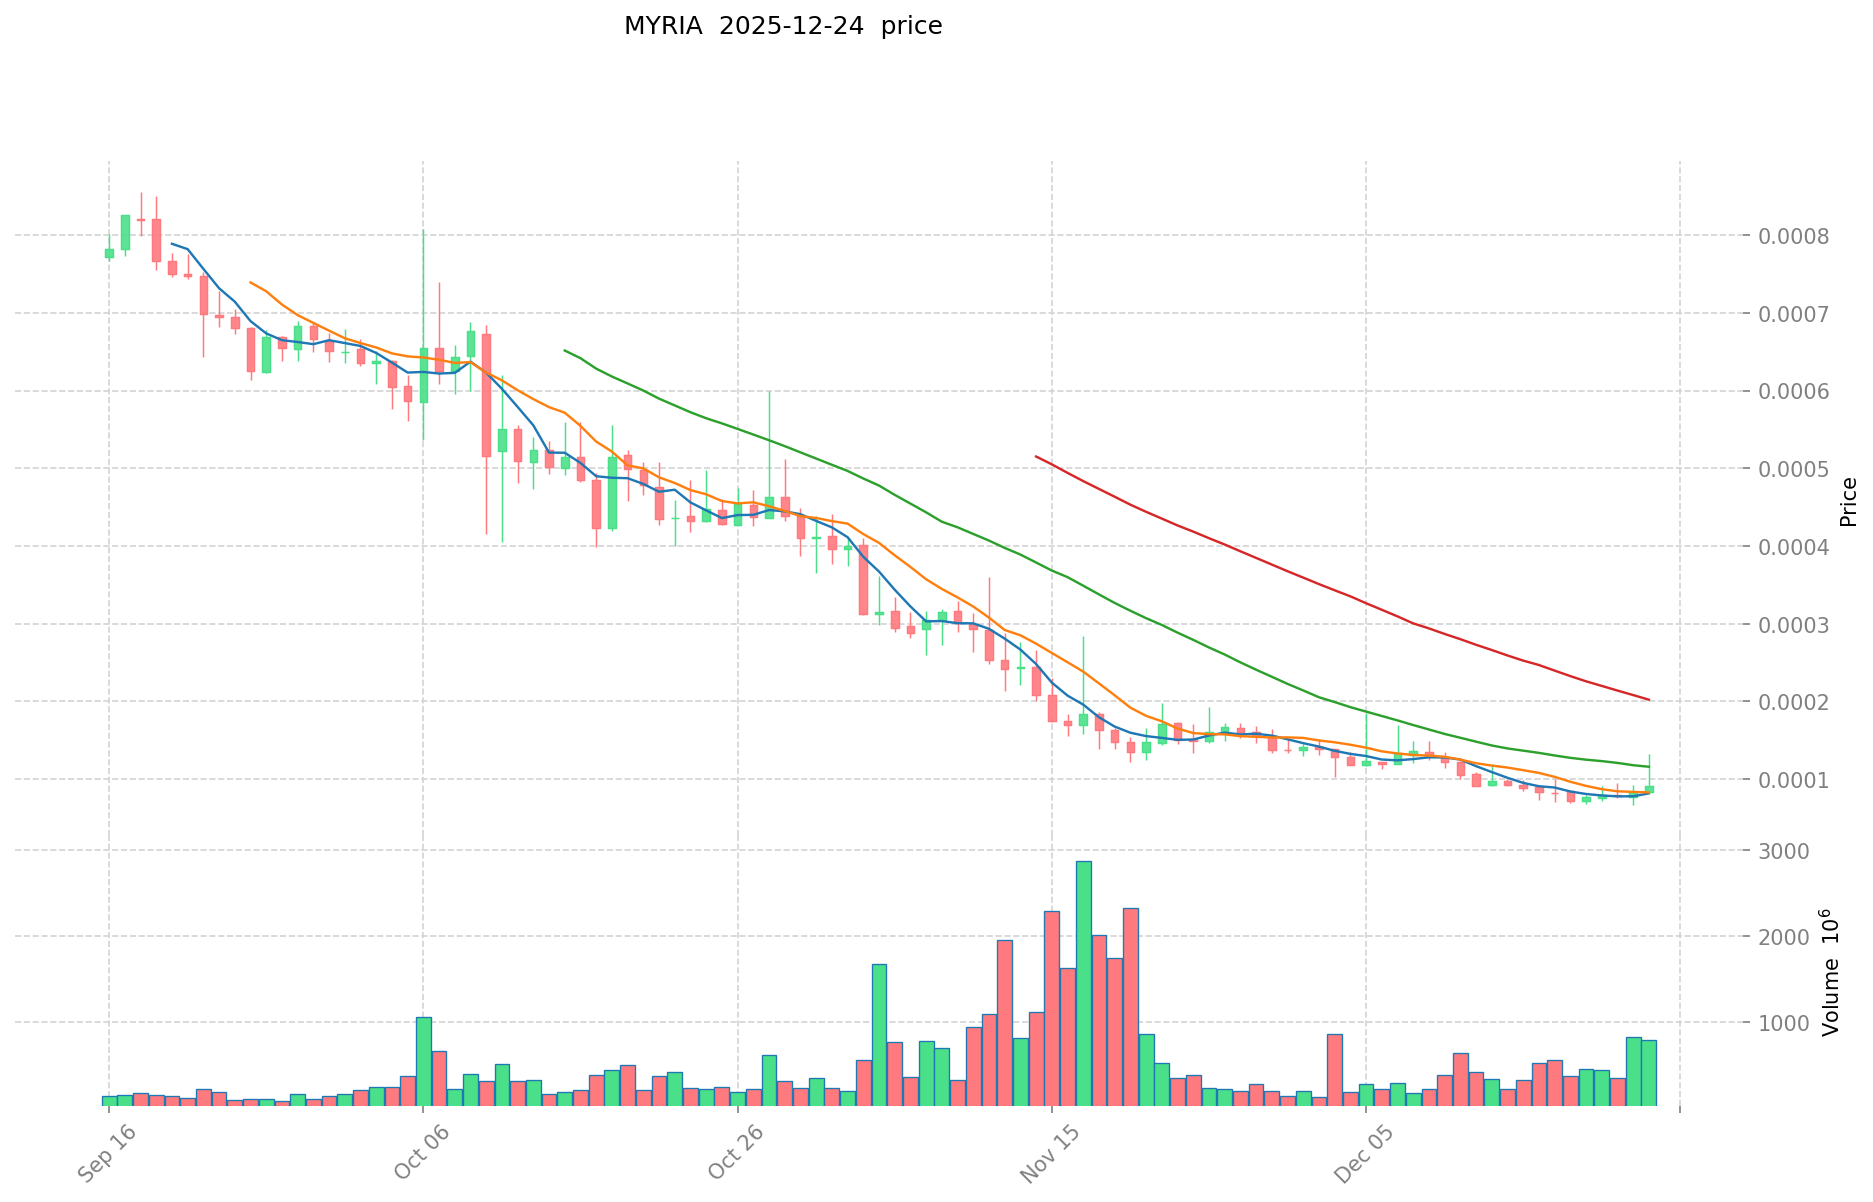
- December 2023: MYRIA reached its all-time high of $0.018239 on December 14, 2023, representing a significant peak in the token's market performance.
- 2024-2025: Extended bear market period, with MYRIA experiencing a sustained decline of approximately 96.2% over the past year, dropping from its historical highs to current levels.
- December 2025: MYRIA hit a new all-time low of $0.00006611 on December 22, 2025, marking the lowest point in the token's trading history.
MYRIA Current Market Status
As of December 25, 2025, MYRIA is trading at $0.00009233, with a 24-hour trading volume of $92,220.63. The token exhibits a market capitalization of $2,612,293.78 based on circulating supply, while its fully diluted valuation stands at $4,616,500.00.
Short-term price momentum shows a mixed picture: MYRIA declined 1.47% in the past hour but recovered with a 1.71% gain over the last 24 hours. Over a 7-day period, the token demonstrated stronger performance with a 7.66% increase. However, longer-term trends remain challenging, with MYRIA down 41.98% over the past 30 days and continuing its severe downtrend of 96.2% over the past year.
The token maintains a circulating supply of approximately 28.29 billion MYRIA out of a total and maximum supply of 50 billion tokens, representing a circulation ratio of 56.59%. With 35,975 token holders and a ranking of 1,964 by market capitalization, MYRIA maintains a market dominance of 0.00014%, reflecting its position as a relatively smaller cap asset in the broader cryptocurrency ecosystem.
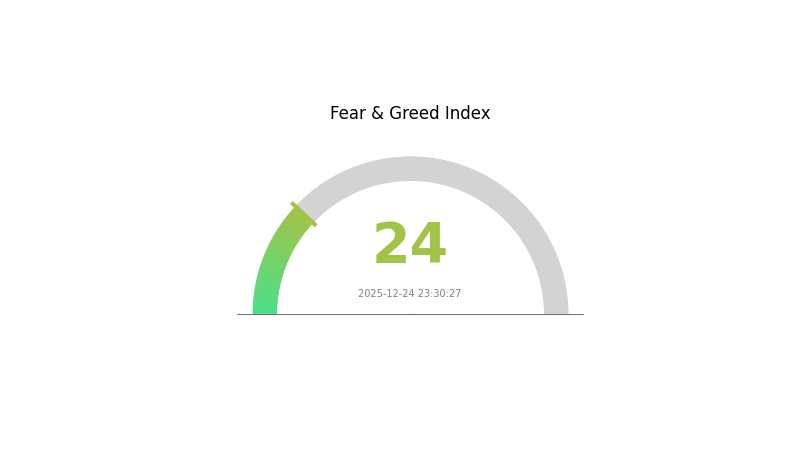
Market sentiment currently reflects "Extreme Fear" conditions, indicating elevated volatility and risk perception in the broader market environment.
Visit Gate.com to check current MYRIA market price
MYRIA Market Sentiment Indicator
2025-12-24 Fear & Greed Index: 24 (Extreme Fear)
Click to view current Fear & Greed Index
The crypto market is experiencing extreme fear with the index at 24, signaling a potential capitulation phase. During such periods, panic selling often reaches its peak as investors rush to exit positions. However, historically, extreme fear levels have presented accumulation opportunities for contrarian traders. MYRIA and other digital assets may be trading significantly below fair value. On Gate.com, you can monitor real-time market sentiment and identify potential entry points. Consider dollar-cost averaging during high fear phases to mitigate timing risks. Remember that extreme fear often precedes market reversals, making it crucial to maintain a long-term investment perspective.
MYRIA Holdings Distribution
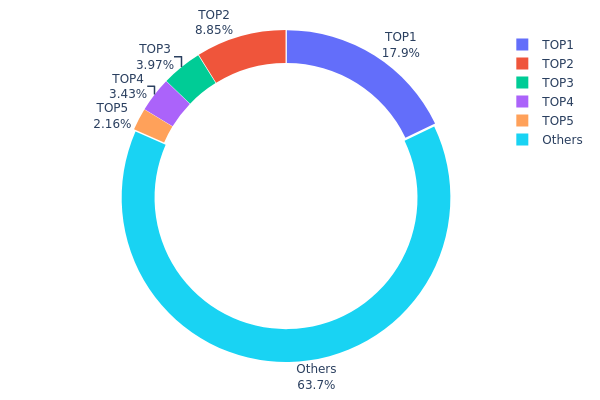
The address holdings distribution map illustrates the concentration of token ownership across blockchain addresses, revealing the decentralization level and potential market structure dynamics of MYRIA. By analyzing the top holders' positions relative to total circulating supply, this metric provides critical insights into wealth concentration, liquidity patterns, and vulnerability to large-scale price manipulation.
The current MYRIA holdings data exhibits moderate concentration characteristics. The top five addresses collectively control approximately 36.29% of the token supply, with the largest holder commanding 17.88% of all MYRIA tokens. While this concentration level is not extreme by cryptocurrency standards, it warrants attention as the leading address alone possesses sufficient capital to influence short-term price movements and market sentiment. The remaining 63.71% distributed among other addresses suggests a reasonably fragmented ownership structure, though this aggregate category may still contain several substantial holders whose individual positions fall below the top-five threshold.
The distribution pattern reflects certain market structure implications. The presence of concentrated holdings among the top addresses indicates potential liquidity risks during periods of elevated selling pressure, as these large positions could trigger cascading price declines if suddenly liquidated or transferred to exchanges. However, the substantial participation of smaller holders in the broader MYRIA ecosystem provides a degree of stabilization and suggests organic community engagement. The current configuration suggests MYRIA maintains moderate decentralization characteristics, with sufficient distribution depth to support sustainable market operations while retaining identifiable whale positions that merit ongoing monitoring.
Click to view current MYRIA holdings distribution
| Top | Address | Holding Qty | Holding (%) |
|---|---|---|---|
| 1 | 0x782b...f962ed | 8940277.78K | 17.88% |
| 2 | 0x3071...2714e7 | 4425304.25K | 8.85% |
| 3 | 0x58ed...a36a51 | 1985775.60K | 3.97% |
| 4 | 0x2677...ccb975 | 1716683.33K | 3.43% |
| 5 | 0x6368...14d6c5 | 1082348.98K | 2.16% |
| - | Others | 31849610.06K | 63.71% |
II. Core Factors Influencing MYRIA's Future Price
Supply Mechanism
-
Token Allocation: MYRIA has a maximum supply of 50,000,000,000 tokens, with a current circulating supply of 39,226,900,000 MYRIA tokens. This represents approximately 78.45% of total supply currently in circulation.
-
Historical Price Impact: The substantial circulating supply relative to maximum supply indicates ongoing token emission. Past price volatility has been driven by trading volume fluctuations and open interest (OI) changes, with 24-hour trading volumes ranging from approximately 1.7 to 2.05 million USD.
-
Current Supply Dynamics: Recent market observations show that MYRIA price movements have been closely tied to open interest adjustments and trader position shifts rather than fundamental supply-side catalysts. Over a 48-hour period in November 2025, aggregated OI increased by 26.32% (approximately 900,000 USD in new capital inflow), followed by an 11.5% decrease (approximately 400,000 USD outflow), directly correlating with price fluctuations.
Macroeconomic Environment
-
Monetary Policy Impact: MYRIA's price performance is influenced by broader cryptocurrency market trends and macroeconomic conditions. Federal Reserve interest rate expectations and monetary policy shifts affect overall market liquidity and risk appetite toward alternative assets.
-
Market Sentiment and Liquidity: Current market sentiment remains neutral to cautious. The cryptocurrency market's overall performance, particularly Bitcoin's price movements, significantly influences MYRIA as a mid-cap altcoin. When Bitcoin breaks key resistance levels (such as the 62,000 USD barrier observed in recent periods), MYRIA experiences corresponding upward pressure alongside other altcoins showing 5-30% sectoral gains.
-
Capital Flow Dynamics: Stablecoin issuance and exchange-traded fund (ETF) inflows serve as indicators of market liquidity. Recent observations show sustained stablecoin supply expansion and continued ETF capital inflows, supporting liquidity conditions for mid-tier tokens like MYRIA.
Market Sentiment and Trading Dynamics
-
Price Volatility Patterns: MYRIA exhibits significant short-term price volatility, with 24-hour price swings ranging from 30-36% amplitude. Within a 24-hour period, prices have fluctuated between 0.000213 USD and 0.000281 USD, indicating active trading but with considerable uncertainty.
-
Community and Trader Behavior: Social media discussions on X platform suggest community members view current price volatility as potential accumulation opportunities. However, discussions focus primarily on technical price action rather than fundamental ecosystem developments, with no recent official announcements confirmed regarding major project updates.
-
Whale and Institutional Positioning: Open interest fluctuations indicate significant position adjustments by large traders. Short-term OI volatility serves as a key driver of price pressure, with derivative market activity on major platforms creating cascading effects on spot prices.
III. 2025-2030 MYRIA Price Forecast
2025 Outlook
- Conservative Forecast: $0.00005 - $0.00009
- Base Case Forecast: $0.00009
- Bullish Forecast: $0.00012 (requires sustained ecosystem development and increased institutional adoption)
2026-2028 Medium-term Outlook
- Market Stage Expected: Recovery and consolidation phase with gradual adoption expansion
- Price Range Forecast:
- 2026: $0.00008 - $0.00013
- 2027: $0.00006 - $0.00014
- 2028: $0.00012 - $0.00017
- Key Catalysts: Growth in gaming ecosystem partnerships, expansion of enterprise solutions, increased trading volume on Gate.com and other major venues, and strengthened developer community engagement
2029-2030 Long-term Outlook
- Base Case Scenario: $0.00009 - $0.00019 (assumes steady adoption of MYRIA gaming infrastructure and moderate market growth)
- Bullish Scenario: $0.00015 - $0.00025 (assumes significant breakthrough in metaverse gaming adoption and mainstream institutional interest)
- Transformative Scenario: $0.00025+ (extreme conditions including mass-market adoption of Web3 gaming, major enterprise partnerships, and exponential user base expansion)
- 2030-12-31: MYRIA reaches $0.00025 (highest annual projection indicating strong long-term value creation potential)
| 年份 | 预测最高价 | 预测平均价格 | 预测最低价 | 涨跌幅 |
|---|---|---|---|---|
| 2025 | 0.00012 | 0.00009 | 0.00005 | -1 |
| 2026 | 0.00013 | 0.00011 | 0.00008 | 14 |
| 2027 | 0.00014 | 0.00012 | 0.00006 | 28 |
| 2028 | 0.00017 | 0.00013 | 0.00012 | 42 |
| 2029 | 0.00019 | 0.00015 | 0.00009 | 64 |
| 2030 | 0.00025 | 0.00017 | 0.00011 | 83 |
MYRIA Professional Investment Strategy and Risk Management Report
IV. MYRIA Professional Investment Strategy and Risk Management
MYRIA Investment Methodology
(1) Long-term Holding Strategy
- Suitable for: Investors with high risk tolerance seeking exposure to gaming-focused Layer 2 solutions
- Operation Recommendations:
- Accumulate MYRIA during market downturns when prices stabilize, given the project's focus on blockchain gaming infrastructure
- Hold through market cycles to benefit from potential adoption growth as gaming applications scale on the Myria network
- Dollar-cost averaging (DCA) approach to reduce timing risk during periods of high volatility
(2) Active Trading Strategy
- Technical Analysis Tools:
- Moving Averages: Monitor 20-day and 50-day moving averages to identify trend reversals and support/resistance levels
- Relative Strength Index (RSI): Use RSI indicators to identify overbought (>70) and oversold (<30) conditions for entry and exit points
- Wave Operation Key Points:
- Trade the 24-hour and 7-day price movements, taking advantage of recent upward momentum (+7.66% over 7 days)
- Set strict stop-loss orders at 5-10% below entry points given the significant 30-day decline (-41.98%)
MYRIA Risk Management Framework
(1) Asset Allocation Principles
- Conservative Investors: 1-2% of portfolio allocation
- Active Investors: 2-5% of portfolio allocation
- Professional Investors: 5-10% of portfolio allocation
(2) Risk Hedging Solutions
- Diversification Strategy: Balance MYRIA holdings with other established Layer 2 solutions to reduce single-project risk
- Position Sizing: Never allocate more than 5% of total crypto portfolio to any single gaming-focused token
(3) Secure Storage Solutions
- Hardware wallet Approach: For holdings exceeding $1,000 USD equivalent, consider using non-custodial security solutions with offline storage capability
- Exchange Custody: For active trading, maintain MYRIA on Gate.com with two-factor authentication (2FA) enabled and whitelisted withdrawal addresses
- Security Considerations: Protect private keys at all times; never share seed phrases; verify contract addresses before transfers to prevent phishing attacks
V. MYRIA Potential Risks and Challenges
MYRIA Market Risk
- Extreme Price Volatility: MYRIA has experienced a -96.2% decline over 12 months (from ATH of $0.018239 to current $0.00009233), indicating severe bearish pressure and potential for further downside
- Low Liquidity Events: With 24-hour trading volume of $92,220.63 and market cap of only $2.61 million, large trades could trigger significant slippage
- Market Sentiment Deterioration: The token's near all-time low (ATL at $0.00006611 reached recently on 2025-12-22) signals weakening investor confidence
MYRIA Regulatory Risk
- Gaming Industry Regulation: Blockchain gaming faces increasing regulatory scrutiny globally; changes in gaming tokenization rules could impact MYRIA utility
- Securities Classification: Regulators in major jurisdictions may reclassify gaming tokens, affecting trading and custody options
- Compliance Requirements: Myria network operations may face compliance challenges as governments implement stricter digital asset frameworks
MYRIA Technical Risk
- Layer 2 Competition: Multiple competing Ethereum Layer 2 solutions could fragment gaming adoption and reduce MYRIA network utilization
- Smart Contract Vulnerabilities: Despite StarkWare partnership, ZK-Rollup implementations remain relatively new technology with potential undiscovered security flaws
- Adoption Uncertainty: Critical dependency on ecosystem developers choosing Myria platform; slow gaming application adoption could limit token utility growth
VI. Conclusions and Action Recommendations
MYRIA Investment Value Assessment
MYRIA presents a high-risk, speculative investment opportunity focused on gaming infrastructure. While the project benefits from StarkWare partnership and innovative ZK-Rollup technology supporting up to 9,000 transactions per block, the token has experienced catastrophic value destruction (-96.2% annually). The current extreme bearish sentiment, combined with low liquidity and market cap concentration, suggests this is primarily suitable for risk-tolerant investors with conviction in long-term gaming adoption on Layer 2 networks. The substantial gap between all-time high and current price indicates either severe overvaluation at peak or potential accumulation opportunity, depending on project development progress.
MYRIA Investment Recommendations
✅ Beginners: Avoid direct MYRIA investment; instead, research the gaming ecosystem through educational resources before considering any position
✅ Experienced Investors: Consider small-scale positions (1-3% of crypto portfolio) only after thorough technical analysis; monitor developer activity and gaming partnerships closely before increasing exposure
✅ Institutional Investors: Conduct comprehensive due diligence on Myria network adoption metrics, developer engagement, and competitive positioning before consideration; evaluate through venture-stage project framework rather than mature token standards
MYRIA Trading Participation Methods
- Gate.com Spot Trading: Purchase MYRIA directly through Gate.com's spot market for long-term holding or active trading with real-time market data and competitive spreads
- Technical Analysis Trading: Execute short-term trades based on support/resistance levels; recent 7-day +7.66% rally may present consolidation opportunities for experienced traders
- Staking or Ecosystem Participation: Monitor Myria network for future staking opportunities or gaming platform integration rewards
Cryptocurrency investment carries extreme risk. This report does not constitute investment advice. Investors should make decisions based on individual risk tolerance and consult professional financial advisors. Never invest funds you cannot afford to lose completely.
FAQ
Why is myria dropping?
Myria's price decline stems from market-wide risk-off sentiment and elevated Bitcoin dominance, reducing capital allocation to altcoins. Additionally, technical breakdowns and ongoing supply inflation pressure the token's price downward.
What are the risks of investing in Myria?
Myria carries significant volatility risks as a newer Web3 coin with limited trading history. The project remains largely untested with relatively light trading volume. Investors should be prepared for potential substantial losses and market fluctuations typical of emerging blockchain tokens.
What does myria crypto do?
Myria is an Ethereum Layer 2 network designed for Web3 gaming, supporting over 250 projects. It distributes MYRIA tokens to developers and participants, fostering community ownership and accelerating ecosystem growth through a circular economy model.
Share
Content
Introduction: Market Position and Investment Value of MYRIA
I. MYRIA Price History Review and Market Current Status
Supply Mechanism
Macroeconomic Environment
Market Sentiment and Trading Dynamics
III. 2025-2030 MYRIA Price Forecast
IV. MYRIA Professional Investment Strategy and Risk Management
V. MYRIA Potential Risks and Challenges
VI. Conclusions and Action Recommendations
FAQ
How to Buy Cryptocurrency


What is XAI: Exploring the World of Explainable Artificial Intelligence

What is XAI: Exploring the World of Explainable Artificial Intelligence and Its Impact on Decision-Making Systems

What is B3: Understanding the Essential Vitamin for Metabolism and Skin Health

What is B3: Understanding the Essential Vitamin for Metabolic Health

2025 MORE Price Prediction: Analyzing Market Trends and Potential Growth Factors
2025 TRALA Price Prediction: Analyzing Market Trends and Growth Potential for the Emerging Cryptocurrency

TradFi Opens the Door to Cryptocurrencies: What It Means for Markets in 2026

TradFi Embraces Digital Assets as Japan Signals a New Era of Financial Integration

Is cryptocurrency mining legal in Germany?

Fear Market in Cryptocurrency: How to Navigate Extreme Sentiment and Find Opportunities

Coincheck: A Japan-Based Digital Currency Exchange