2025 MDT Price Prediction: Analyzing Market Trends and Growth Potential for Measurable Data Token
Introduction: MDT's Market Position and Investment Value
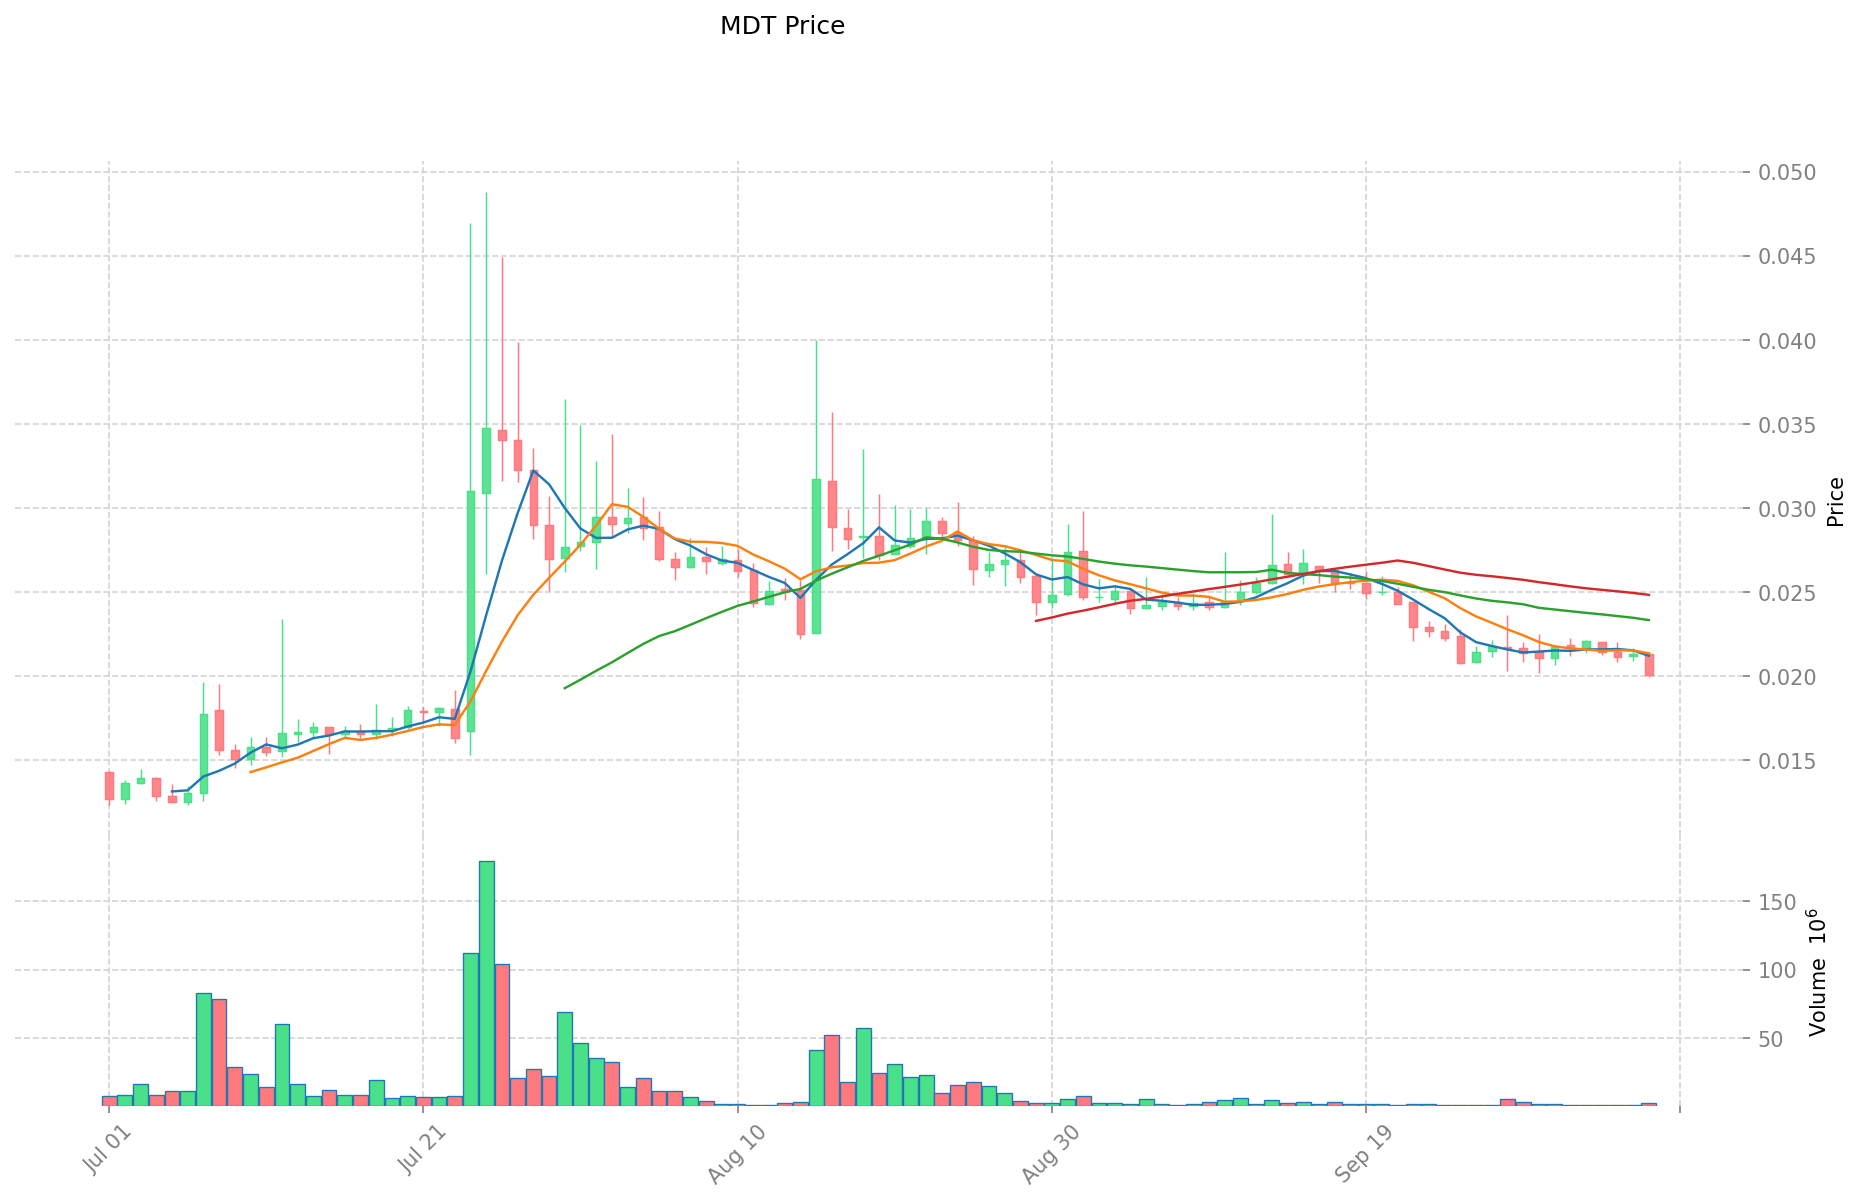
MeasurableDataToken (MDT), as a decentralized big data value economic ecosystem based on blockchain technology, has been quantifying data value and facilitating transactions between users, data buyers, and data providers since its inception in 2017. As of 2025, MDT's market capitalization has reached $12,273,124, with a circulating supply of approximately 606,319,736 tokens, and a price hovering around $0.020242. This asset, known as the "data value quantifier," is playing an increasingly crucial role in the fields of big data trading and user data rights protection.
This article will comprehensively analyze MDT's price trends from 2025 to 2030, combining historical patterns, market supply and demand, ecosystem development, and macroeconomic factors to provide professional price predictions and practical investment strategies for investors.
I. MDT Price History Review and Current Market Status
MDT Historical Price Evolution
- 2018: MDT reached its all-time low of $0.00173261 on December 18, marking a challenging period for the token
- 2021: MDT hit its all-time high of $0.168053 on December 26, showcasing significant growth
- 2025: The token experienced a substantial decline, with the price dropping by 53.82% over the past year
MDT Current Market Situation
As of October 8, 2025, MDT is trading at $0.020242. The token has seen a 4.97% decrease in the last 24 hours, with a trading volume of $47,078.71. MDT's market capitalization stands at $12,273,124, ranking it 1322nd in the cryptocurrency market. The circulating supply is 606,319,736.12 MDT, representing 60.63% of the total supply of 1,000,000,000 tokens. Despite the recent downtrend, MDT has shown a slight recovery in the past hour, with a 0.65% increase.
Click to view the current MDT market price
MDT Market Sentiment Indicator
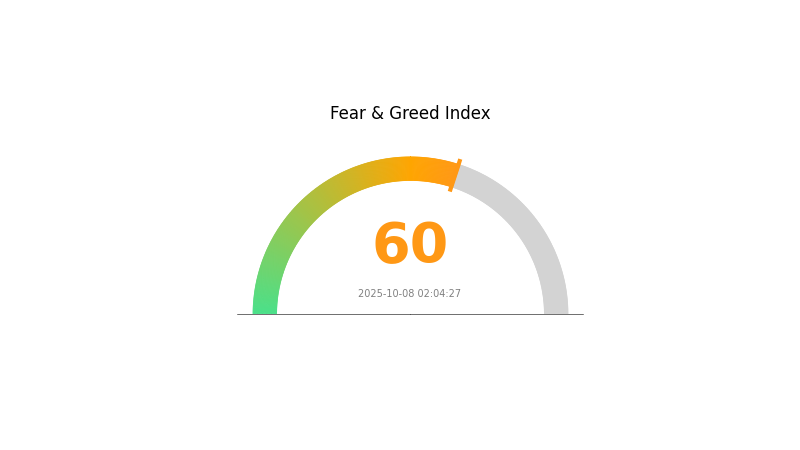
2025-10-08 Fear and Greed Index: 60 (Greed)
Click to view the current Fear & Greed Index
The crypto market is showing signs of greed, with the Fear and Greed Index at 60. This indicates growing optimism among investors, potentially driven by positive market trends or favorable news. However, caution is advised as excessive greed can lead to overvaluation and increased volatility. Traders should consider diversifying their portfolios and setting clear risk management strategies. Remember, market sentiment can shift quickly, so stay informed and make decisions based on thorough research and analysis.
MDT Holdings Distribution
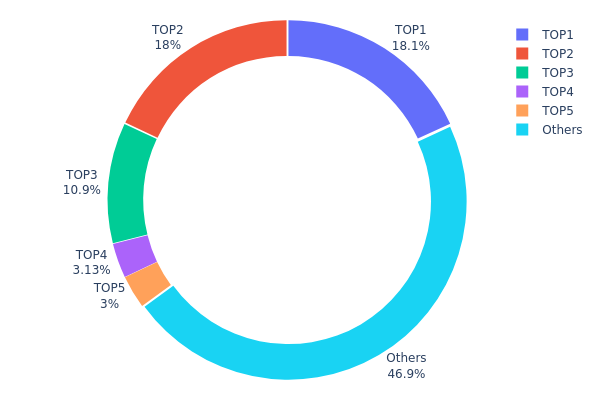
The address holdings distribution data reveals significant concentration in MDT token ownership. The top three addresses collectively hold 47% of the total supply, with the largest two addresses each controlling approximately 18%. This high concentration raises concerns about potential market manipulation and price volatility.
The distribution pattern indicates a relatively centralized structure, with over 53% of tokens held by just five addresses. This concentration could lead to increased market volatility if large holders decide to sell their positions. Additionally, it may impact the token's liquidity and overall market stability. The remaining 46.88% distributed among other addresses suggests some level of broader participation, but the dominance of top holders remains a key consideration for investors and market analysts.
This concentration level reflects a market structure that may be susceptible to significant price swings based on the actions of a few major holders. It also indicates a lower degree of decentralization compared to more evenly distributed tokens, potentially affecting MDT's resilience and long-term stability in the crypto ecosystem.
Click to view the current MDT Holdings Distribution
| Top | Address | Holding Qty | Holding (%) |
|---|---|---|---|
| 1 | 0xa145...70c5b3 | 181000.00K | 18.09% |
| 2 | 0x5a52...70efcb | 180000.00K | 18.00% |
| 3 | 0xf977...41acec | 109169.37K | 10.91% |
| 4 | 0x28c6...f21d60 | 31297.28K | 3.12% |
| 5 | 0x2eb0...45ae2a | 30000.00K | 3.00% |
| - | Others | 468533.35K | 46.88% |
II. Key Factors Affecting MDT's Future Price
Supply Mechanism
- Data Freshness: The freshness of data (Time) is a key factor influencing MDT's value.
- Current Impact: MDT wallet is planned to have more features in the future, including new ways to receive MDT.
Institutional and Whale Dynamics
- Corporate Adoption: MDT's core products include RewardMe and Measurable AI, which are consumer-facing applications.
Macroeconomic Environment
- Inflation Hedging Properties: As a cryptocurrency, MDT may be viewed as a potential hedge against inflation, though its effectiveness in this role is not explicitly stated.
Technological Development and Ecosystem Building
- Ecosystem Applications: RewardMe and Measurable AI are the main applications in MDT's ecosystem.
III. MDT Price Prediction for 2025-2030
2025 Outlook
- Conservative prediction: $0.01802 - $0.02024
- Neutral prediction: $0.02024 - $0.02095
- Optimistic prediction: $0.02095 - $0.02166 (requires positive market sentiment)
2027-2028 Outlook
- Market phase expectation: Potential growth phase
- Price range forecast:
- 2027: $0.02344 - $0.0359
- 2028: $0.02525 - $0.03467
- Key catalysts: Increased adoption and technological advancements
2029-2030 Long-term Outlook
- Base scenario: $0.02799 - $0.03515 (assuming steady market growth)
- Optimistic scenario: $0.03515 - $0.04534 (assuming strong market performance)
- Transformative scenario: $0.04534+ (under extremely favorable conditions)
- 2030-12-31: MDT $0.03515 (potential year-end valuation)
| 年份 | 预测最高价 | 预测平均价格 | 预测最低价 | 涨跌幅 |
|---|---|---|---|---|
| 2025 | 0.02166 | 0.02024 | 0.01802 | 0 |
| 2026 | 0.02891 | 0.02095 | 0.01173 | 3 |
| 2027 | 0.0359 | 0.02493 | 0.02344 | 23 |
| 2028 | 0.03467 | 0.03042 | 0.02525 | 50 |
| 2029 | 0.03775 | 0.03255 | 0.02799 | 60 |
| 2030 | 0.04534 | 0.03515 | 0.02812 | 73 |
IV. MDT Professional Investment Strategies and Risk Management
MDT Investment Methodology
(1) Long-term Holding Strategy
- Suitable for: Long-term value investors
- Operation suggestions:
- Accumulate MDT during market dips
- Set price targets and stick to them
- Store in secure hardware wallets or reputable exchanges
(2) Active Trading Strategy
- Technical analysis tools:
- Moving Averages: Use to identify trends and potential entry/exit points
- RSI (Relative Strength Index): Helps determine overbought/oversold conditions
- Key points for swing trading:
- Monitor trading volume for confirmation of price movements
- Set stop-loss orders to manage risk
MDT Risk Management Framework
(1) Asset Allocation Principles
- Conservative investors: 1-3% of portfolio
- Aggressive investors: 5-10% of portfolio
- Professional investors: Up to 15% of portfolio
(2) Risk Hedging Solutions
- Diversification: Spread investments across multiple cryptocurrencies
- Stop-loss orders: Implement to limit potential losses
(3) Secure Storage Solutions
- Hardware wallet recommendation: Gate Web3 Wallet
- Cold storage solution: Paper wallets for long-term holdings
- Security precautions: Enable two-factor authentication, use strong passwords
V. Potential Risks and Challenges for MDT
MDT Market Risks
- High volatility: Cryptocurrency markets are known for rapid price fluctuations
- Market sentiment: Influenced by news, regulations, and overall crypto market trends
- Liquidity risk: Lower trading volumes may impact ability to enter/exit positions
MDT Regulatory Risks
- Changing regulations: Potential for new laws affecting cryptocurrency operations
- Cross-border restrictions: Varying legal status in different countries
- Tax implications: Evolving tax laws for cryptocurrency transactions
MDT Technical Risks
- Smart contract vulnerabilities: Potential for exploits in the underlying code
- Network congestion: Ethereum network issues could affect MDT transactions
- Technological obsolescence: Risk of being outpaced by newer blockchain technologies
VI. Conclusion and Action Recommendations
MDT Investment Value Assessment
MDT presents a unique value proposition in the data economy sector, but faces significant short-term volatility and regulatory uncertainties. Long-term potential exists if the project successfully navigates challenges and achieves widespread adoption.
MDT Investment Recommendations
✅ Beginners: Start with small, regular investments to build position over time ✅ Experienced investors: Consider a balanced approach with defined entry and exit points ✅ Institutional investors: Conduct thorough due diligence and consider MDT as part of a diversified crypto portfolio
MDT Trading Participation Methods
- Spot trading: Buy and sell MDT on reputable exchanges like Gate.com
- Staking: Participate in staking programs if available to earn passive income
- DeFi integration: Explore decentralized finance options that support MDT
Cryptocurrency investments carry extremely high risks. This article does not constitute investment advice. Investors should make decisions carefully based on their own risk tolerance, and it is recommended to consult a professional financial advisor. Never invest more than you can afford to lose.
FAQ
What is the price target for MDT 2025?
Based on analyst forecasts, the price target for MDT in 2025 is $99, with the highest target being $115.
Is MDT a buy, sell, or hold?
Based on current market analysis and investor sentiment, MDT is considered a buy. This recommendation reflects positive outlook for the token as of 2025-10-08.
What is the price prediction for Mana 2025?
The price prediction for Mana (MANA) in 2025 is between $0.31784676 (minimum) and $0.32821117 (average), based on historical data analysis.
What is the analyst rating for MDT?
The analyst rating for MDT is a Buy consensus of 74%. Analysts have set a mean price target of $98.36. The latest rating is Outperform.
Share
Content