2025 HAT Price Prediction: Expert Analysis and Market Forecast for the Year Ahead

Introduction: HAT's Market Position and Investment Value
Top Hat (HAT) serves as the infrastructure platform for creating multi-purpose AI agents on Solana. Since its launch in October 2024, the project has established itself within the AI-driven agent ecosystem. As of January 2026, HAT maintains a market capitalization of approximately $91,317.45, with a circulating supply of around 989,998,000 tokens, currently trading at $0.00009224.
This emerging asset is increasingly playing a critical role in on-chain and off-chain task automation through autonomous AI agents that leverage live-data tracking and knowledge retrieval capabilities.
This article will comprehensively analyze HAT's price trajectory from 2026 through 2031, integrating historical patterns, market supply and demand dynamics, ecosystem development, and macroeconomic factors to provide investors with professional price forecasts and actionable investment strategies.
Top Hat (HAT) Market Analysis Report
I. HAT Price History Review and Current Market Status
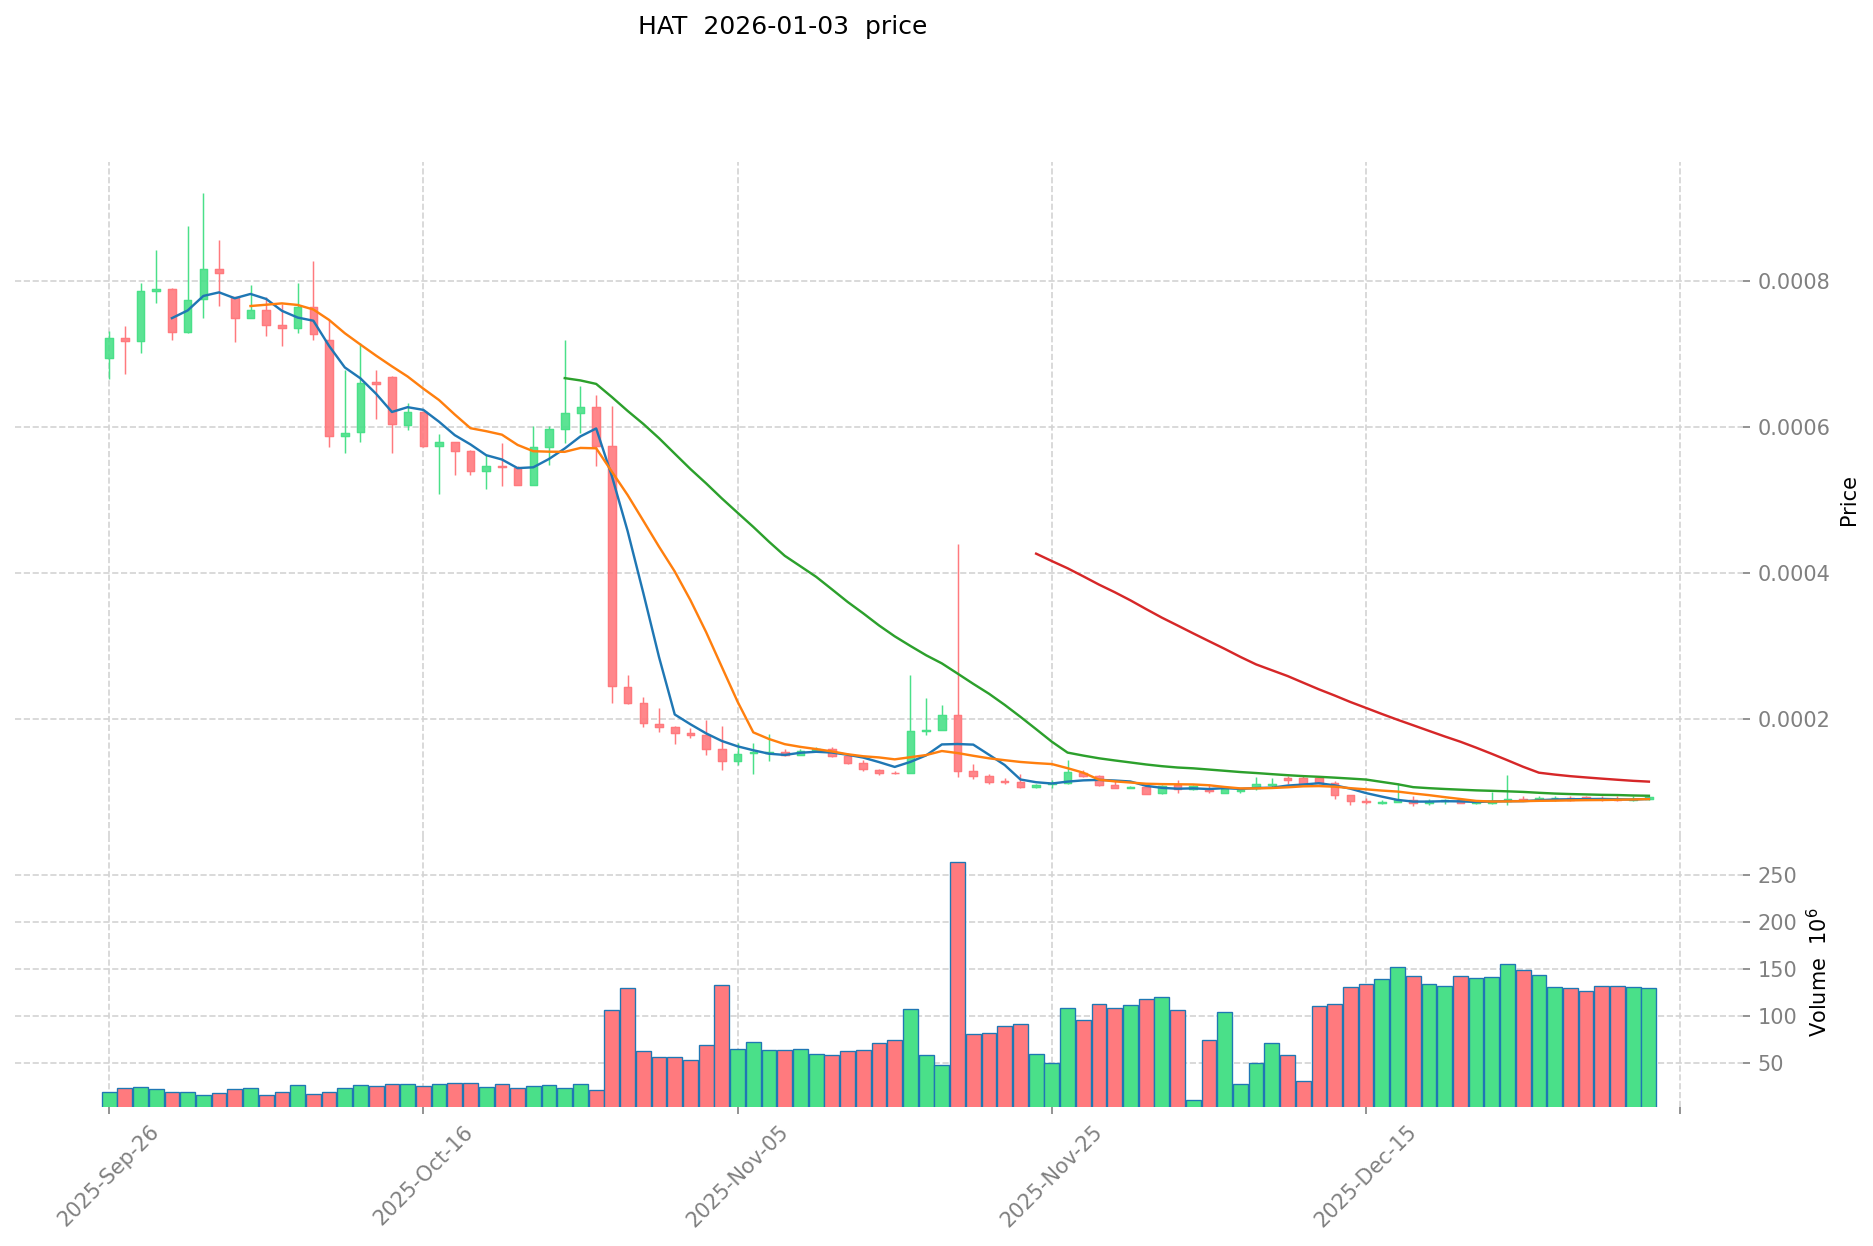
HAT Historical Price Evolution
Based on available data, Top Hat (HAT) has experienced significant volatility since its launch:
- January 26, 2025: All-time high (ATH) of $0.0444 was reached, marking the peak of the token's value
- December 18, 2025: All-time low (ATL) of $0.00008054 was recorded, representing a substantial decline from previous peaks
- Current Period (2026): The token has stabilized at lower levels, trading significantly below historical highs
The token has experienced a dramatic decline of approximately 99.88% over the one-year period, indicating a severe bear market cycle for this particular asset.
HAT Current Market Status
As of January 4, 2026, HAT is trading at $0.00009224, reflecting minimal daily movement with a 24-hour change of -0.2%. The token demonstrates:
- Price Range (24H): Trading between $0.00009204 and $0.00009347
- Market Capitalization: $91,317.42 USD
- Fully Diluted Valuation: $91,317.45 USD
- 24-Hour Trading Volume: $12,591.90 USD
- Circulating Supply: 989,998,000 HAT tokens (98.99% of total supply)
- Total Supply: 989,998,348 tokens
- Maximum Supply: 1,000,000,000 tokens
- Active Holders: 12,588 addresses
The token maintains a minimal market share of 0.0000027% in the broader cryptocurrency market. Recent price trends show a slight recovery with 1-hour gains of 0.21%, while 7-day performance reflects modest growth of 2.71%, contrasting sharply with the 30-day decline of -10.72%.
Click to view current HAT market price
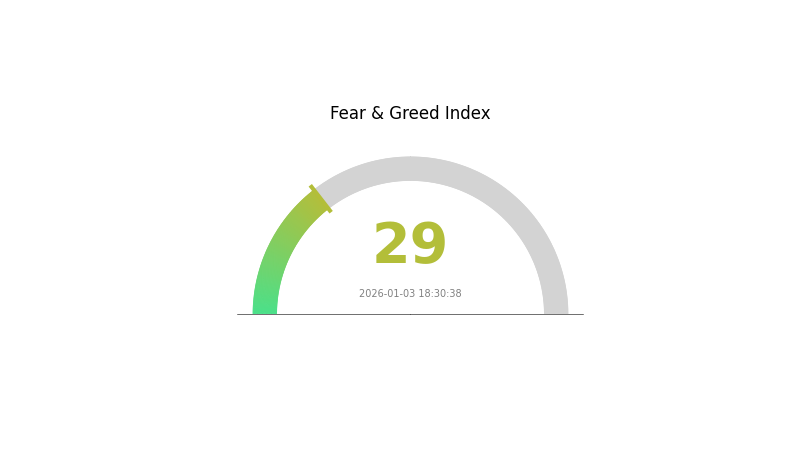
HAT Market Sentiment Indicator
2026-01-03 Fear and Greed Index: 29 (Fear)
Click to view current Fear & Greed Index
The crypto market is currently dominated by fear sentiment with an index reading of 29. This indicates that investors are experiencing heightened anxiety and caution in their trading decisions. During periods of fear, market volatility typically increases as participants become more risk-averse. Such conditions often present opportunities for long-term investors to accumulate assets at potentially lower valuations. However, traders should exercise prudent risk management and avoid making impulsive decisions based on short-term market movements. Monitor market developments closely on Gate.com for better trading insights and real-time data.
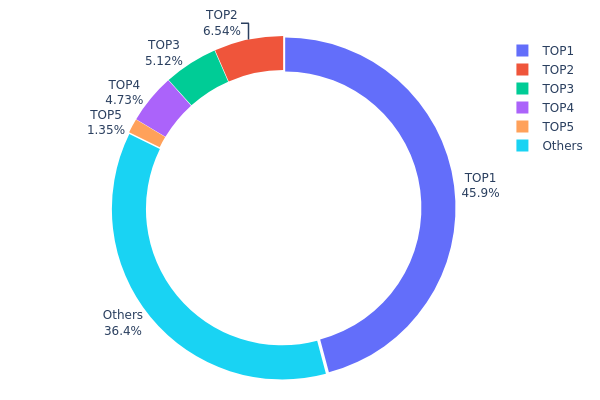
HAT Holdings Distribution
The address holdings distribution map illustrates the concentration of HAT tokens across different wallet addresses on the blockchain. This metric serves as a critical indicator of token decentralization, market structure integrity, and potential vulnerability to large-scale liquidation events or coordinated market manipulation.
HAT's current holdings distribution reveals a notably concentrated structure, with the top address controlling 45.86% of the total supply. The cumulative holdings of the top four addresses account for 62.24% of all HAT tokens in circulation, indicating substantial centralization risk. While the "Others" category represents 36.42% of holdings across dispersed addresses, the dominant position of the leading wallet creates a significant imbalance in token distribution. The second-tier holders (addresses 2-4) maintain relatively modest stakes ranging from 4.72% to 6.54%, suggesting a multi-tiered concentration pattern rather than a gradual distribution curve.
This concentration level presents notable implications for market dynamics and stability. A single address controlling nearly 46% of the token supply presents elevated counterparty risk and potential volatility catalysts should this holder execute substantial transfers or liquidations. The concentration also raises considerations regarding governance structures, as voting power in protocol decisions may be disproportionately distributed. However, the meaningful allocation to dispersed addresses (36.42%) provides some degree of distributional diversity. For investors and stakeholders, monitoring changes in these top address holdings remains essential for assessing evolving decentralization trends and potential shifts in market structure.
Visit HAT Holdings Distribution on Gate.com for real-time data.
| Top | Address | Holding Qty | Holding (%) |
|---|---|---|---|
| 1 | 5Q544f...pge4j1 | 454005.56K | 45.86% |
| 2 | u6PJ8D...ynXq2w | 64750.56K | 6.54% |
| 3 | 9ZPsRW...ZgE4Y4 | 50704.24K | 5.12% |
| 4 | AC5RDf...CWjtW2 | 46792.16K | 4.72% |
| 5 | VzurNC...YhEj32 | 13335.04K | 1.34% |
| - | Others | 360250.10K | 36.42% |
II. Core Factors Affecting HAT's Future Price
Supply Mechanism
- Token Scarcity: HAT's total supply approaches its upper limit, directly impacting scarcity and market valuation. The constrained token supply creates upward pressure on price through limited availability in the market.
- Market Impact: Supply pressure is identified as one of the primary factors influencing HAT's price trajectory, with limited token circulation affecting overall market dynamics.
Ecosystem and Market Dynamics
- Product Appeal: Future development is driven by multiple factors including product attractiveness, researcher economics, and network effects that determine the token's utility and adoption.
- Key Risks to Monitor: Low liquidity, token vesting schedules, and competitive pressures represent significant risks that investors should evaluate when assessing HAT's long-term value potential.
Market Competition and Liquidity
- Competitive Environment: HAT operates within a competitive market landscape where multiple projects vie for similar use cases and user adoption.
- Liquidity Concerns: Low liquidity presents a notable challenge for price stability and market efficiency, requiring attention from both current and prospective token holders when making investment decisions.
III. HAT Price Forecast 2026-2031
2026 Outlook
- Conservative Forecast: $0.00006 - $0.00009
- Base Case Forecast: $0.00009
- Optimistic Forecast: $0.0001 (requires sustained market interest and positive ecosystem developments)
2027-2029 Medium-term Outlook
- Market Phase Expectation: Gradual accumulation and consolidation phase with incremental growth trajectory
- Price Range Forecast:
- 2027: $0.00005 - $0.0001 (5% upside potential)
- 2028: $0.00007 - $0.00011 (7% upside potential)
- 2029: $0.00009 - $0.00014 (14% upside potential)
- Key Catalysts: Enhanced protocol adoption, strategic partnerships, improved market liquidity on platforms such as Gate.com, and positive regulatory developments
2030-2031 Long-term Outlook
- Base Scenario: $0.00008 - $0.00014 (assumes moderate ecosystem growth and stable market conditions)
- Optimistic Scenario: $0.00012 - $0.00019 (assumes accelerated adoption and strong community expansion)
- Transformational Scenario: $0.00019+ (assumes major breakthrough innovations, institutional adoption, and significant market capitalization expansion)
- 2031-12-31: HAT reaching $0.00019 (cumulative growth of 44% from baseline, reflecting sustained positive market momentum)
| 年份 | 预测最高价 | 预测平均价格 | 预测最低价 | 涨跌幅 |
|---|---|---|---|---|
| 2026 | 0.0001 | 0.00009 | 0.00006 | 0 |
| 2027 | 0.0001 | 0.0001 | 0.00005 | 5 |
| 2028 | 0.00011 | 0.0001 | 0.00007 | 7 |
| 2029 | 0.00014 | 0.00011 | 0.00009 | 14 |
| 2030 | 0.00014 | 0.00012 | 0.00008 | 34 |
| 2031 | 0.00019 | 0.00013 | 0.00012 | 44 |
Top Hat (HAT) Professional Investment Strategy and Risk Management Report
IV. HAT Professional Investment Strategy and Risk Management
HAT Investment Methodology
(1) Long-Term Holding Strategy
- Target Investors: Blockchain technology believers and AI agent ecosystem supporters with medium to long-term investment horizons
- Operational Recommendations:
- Establish a diversified entry strategy by accumulating HAT tokens gradually over 3-6 months to reduce timing risk
- Hold tokens for a minimum of 12-24 months to participate in potential ecosystem growth as AI agents gain adoption on Solana
- Monitor project milestones including major platform updates, partnerships with Solana applications, and increases in active AI agent deployments
(2) Active Trading Strategy
- Technical Analysis Tools:
- Moving Averages (MA 20/50/200): Use crossovers to identify trend reversals; buy signals emerge when shorter-term MAs cross above longer-term MAs
- Relative Strength Index (RSI): Monitor oversold conditions (RSI below 30) for potential entry points and overbought conditions (RSI above 70) for profit-taking opportunities
- Wave Operation Key Points:
- Execute entry orders near identified support levels during market corrections with position sizing of 2-3% per trade
- Set profit-taking targets at 15-25% gains and maintain stop-losses at 8-10% below entry prices to protect against adverse volatility
HAT Risk Management Framework
(1) Asset Allocation Principles
- Conservative Investors: 1-2% of total crypto portfolio allocation, focusing on dollar-cost averaging accumulation
- Aggressive Investors: 3-5% of total crypto portfolio allocation, allowing for periodic tactical rebalancing based on market conditions
- Professional Investors: 5-10% of total crypto portfolio allocation, with dynamic hedging strategies and derivative positions
(2) Risk Hedging Solutions
- Portfolio Diversification: Balance HAT holdings with established Layer 1 protocols and stablecoins to reduce concentration risk
- Position Sizing: Limit any single entry to no more than 3% of total investment capital to manage downside exposure
(3) Secure Storage Solutions
- Hot Wallet Strategy: Gate.com Web3 Wallet offers convenient access for active traders with built-in security features and direct trading integration
- Cold Storage Approach: Transfer long-term holdings to secure offline storage solutions to eliminate smart contract and exchange counterparty risks
- Security Considerations: Enable multi-factor authentication across all accounts, never share private keys, verify contract addresses on official documentation, and use hardware security keys for enhanced protection
V. HAT Potential Risks and Challenges
HAT Market Risk
- Extreme Volatility: HAT has experienced a -99.88% decline over the past year and is trading significantly below its historical high of $0.0444, indicating severe price instability and potential liquidity challenges
- Market Liquidity Constraints: With only $12,591.89 in 24-hour trading volume and a market cap of $91,317.41, the token faces challenges with slippage during larger transactions
- Adoption Uncertainty: The success of the Top Hat platform depends on widespread developer adoption and user engagement with AI agents on Solana, which remains unproven at scale
HAT Regulatory Risk
- Emerging Technology Classification: AI agents and autonomous systems may face evolving regulatory scrutiny as governments establish frameworks for algorithmic trading and autonomous agents
- Solana Ecosystem Dependency: Regulatory actions targeting Solana or decentralized autonomous systems could disproportionately impact HAT token valuation
- Securities Classification Concerns: Depending on regulatory jurisdiction, HAT tokens could be reclassified as securities, requiring compliance registration and limiting trading venues
HAT Technology Risk
- Smart Contract Vulnerabilities: As an infrastructure platform for AI agents, any critical vulnerabilities in the core smart contracts could expose user-created agents and data to exploitation
- Solana Network Dependency: Technical failures, congestion, or security incidents on the Solana blockchain directly impact platform functionality and user confidence
- Integration Complexity: Seamless integration between on-chain and off-chain AI agent operations requires sophisticated infrastructure that may encounter unforeseen technical obstacles
VI. Conclusion and Action Recommendations
HAT Investment Value Assessment
Top Hat represents a speculative investment opportunity in the emerging AI agent infrastructure sector on Solana. While the platform addresses a theoretically important use case—enabling autonomous AI agents to perform complex tasks—significant uncertainties persist regarding market adoption, regulatory treatment, and technical execution. The token's extreme price decline (-99.88% annually) and minimal trading liquidity suggest the project remains in early, highly volatile stages. Investors should view HAT as a high-risk, high-potential-return opportunity suitable only for capital they can afford to lose completely.
HAT Investment Recommendations
✅ Beginners: Start with micro-positions (0.5-1% of crypto portfolio) through dollar-cost averaging, focus on understanding the AI agent ecosystem on Solana before increasing exposure, and treat HAT as a speculative allocation only
✅ Experienced Investors: Establish 2-4% portfolio positions with disciplined entry protocols using technical support levels, maintain strict stop-losses at 10% below entry prices, and actively rebalance quarterly based on project development milestones
✅ Institutional Investors: Consider HAT as part of broader Solana ecosystem exposure with 5-10% allocation limits, conduct due diligence on governance structures and development team credentials, and implement derivatives hedging strategies to manage tail risks
HAT Trading Participation Methods
- Gate.com Trading: Access HAT spot trading with competitive fees, leverage platform liquidity for efficient position entry and exit
- Limit Order Strategy: Use limit buy orders at 10-15% below current market price to maximize entry efficiency during market volatility
- Risk-Managed Accumulation: Implement automatic position sizing based on portfolio percentage allocation rules to prevent emotional decision-making
Cryptocurrency investments carry extreme risk. This report does not constitute investment advice. All investors must carefully assess their individual risk tolerance before committing capital. We strongly recommend consulting with professional financial advisors. Never invest more than you can afford to lose completely.
FAQ
What is the historical price trend of HAT?
HAT reached its all-time high of 97,301 VND on November 2, 2016, and its all-time low of 9,798 VND on August 14, 2011. The token has demonstrated significant volatility across its trading history, reflecting market dynamics and adoption cycles within the cryptocurrency ecosystem.
What is the HAT price prediction for 2024?
Based on market trends, HAT's 2024 price prediction is estimated around $0.000000409. Future price predictions carry inherent uncertainty and market volatility.
What are the main factors affecting HAT price fluctuations?
HAT price fluctuations are primarily driven by market demand, trading volume, ecosystem development, regulatory changes, and overall cryptocurrency market sentiment. Technical upgrades and community adoption also significantly impact price movements.
What is the investment value of HAT compared to other similar tokens?
HAT offers competitive advantages through its buyback and burn mechanism, which enhances scarcity and value. Token holders receive purchase discounts, and 10% of platform revenue supports HAT repurchases and burns. With stable market value growth and unique tokenomics, HAT demonstrates stronger investment potential than comparable tokens.
What are the technical analysis and support levels for HAT price prediction?
HAT support levels are key price points where buying pressure prevents further decline. Resistance levels mark where selling pressure may halt upward movement. Technical analysis uses these levels combined with trading volume, moving averages, and chart patterns to forecast price direction and potential reversal points.
What are the risks to note when investing in HAT?
HAT investment carries market volatility risk, technology risk, and regulatory risk. Investors should assess their risk tolerance, conduct thorough research, and monitor market developments before investing.
Share
Content
Introduction: HAT's Market Position and Investment Value
I. HAT Price History Review and Current Market Status
II. Core Factors Affecting HAT's Future Price
III. HAT Price Forecast 2026-2031
IV. HAT Professional Investment Strategy and Risk Management
V. HAT Potential Risks and Challenges
VI. Conclusion and Action Recommendations
FAQ
How to Buy Cryptocurrency


VAI vs SOL: The Battle for Dominance in the Decentralized Finance Ecosystem

Is aiPUMP (AIPUMP) a good investment?: Analyzing the Potential and Risks of this AI-Powered Cryptocurrency
Is Tate Terminal (TATE) a good investment?: Analyzing the potential and risks of this emerging cryptocurrency

Is TOKAI (TOK) a good investment?: Analyzing the potential and risks of this emerging cryptocurrency

2025 TOK Price Prediction: Bullish Outlook as Adoption and Utility Grow

How Does Zerebro's Market Cap of $8.17M Compare to Other Cryptocurrencies in 2025?

Is cryptocurrency mining legal in Germany?

Fear Market in Cryptocurrency: How to Navigate Extreme Sentiment and Find Opportunities

Coincheck: A Japan-Based Digital Currency Exchange
SEI Price Analysis: Technical Formation Indicating Potential Bullish Breakout

Is Polkadot Legit? A Look at Whether DOT Is Real or a Scam