2025 GT Price Prediction: Analyzing Market Trends and Future Prospects for the Luxury Sports Car
Introduction: GT's Market Position and Investment Value
GateToken (GT) as the native token of Gate.com, has made significant strides since its inception in 2019. As of 2025, GT's market capitalization has reached $1.1 billion, with a circulating supply of approximately 100,359,279 tokens, and a price hovering around $11.01. This asset, often referred to as the "Gate.com Ecosystem Fuel," is playing an increasingly crucial role in decentralized finance (DeFi) and exchange operations.
This article will provide a comprehensive analysis of GT's price trends from 2025 to 2030, considering historical patterns, market supply and demand, ecosystem development, and the macroeconomic environment to offer professional price predictions and practical investment strategies for investors.
I. GT Price History Review and Current Market Status
GT Historical Price Evolution
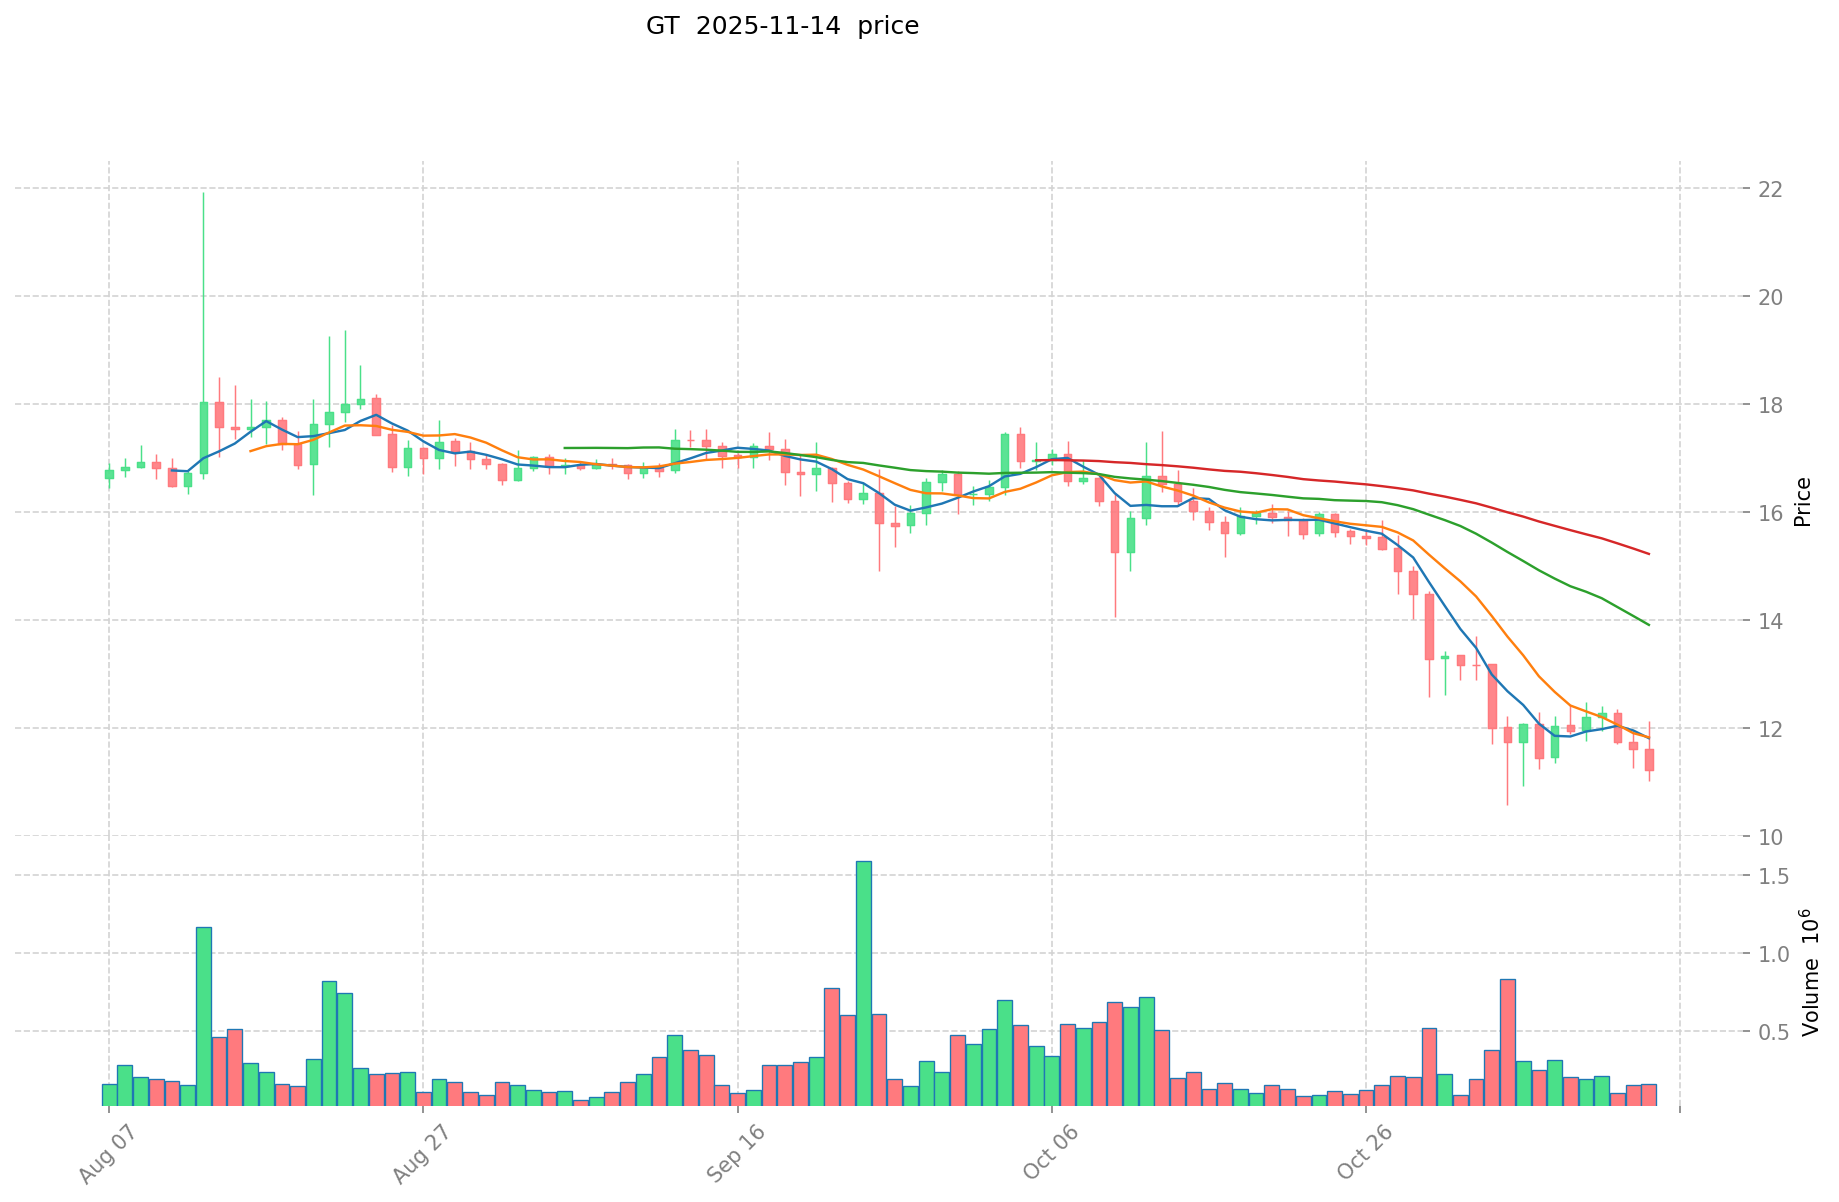
- 2020: GT launched, price reached a low of $0.25754 on March 13
- 2025: GT hit an all-time high of $25.94 on January 25
- 2025: Market cycle fluctuation, price dropped from the high to current $11.01
GT Current Market Situation
GT is currently trading at $11.01, down 8.26% in the last 24 hours. The token's market cap stands at $1,104,955,661.79, ranking 85th in the global cryptocurrency market. GT has seen a significant decline of 32.19% over the past 30 days, indicating a bearish trend in the short term. However, it's worth noting that GT still maintains a 15.25% increase over the past year, suggesting long-term growth potential. The current price is well below its all-time high of $25.94, but substantially higher than its all-time low of $0.25754. With a circulating supply of 100,359,279 GT out of a total supply of 300,000,000, the token has a circulation ratio of 33.45%.
Click to view the current GT market price
GT Market Sentiment Indicator
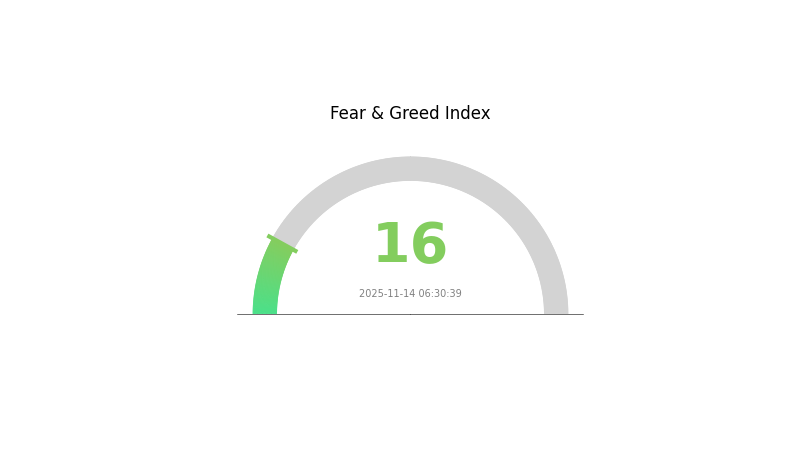
2025-11-14 Fear and Greed Index: 16 (Extreme Fear)
Click to view the current Fear & Greed Index
The crypto market is gripped by extreme fear today, with the sentiment index plummeting to 16. This suggests investors are highly cautious and risk-averse. Such periods of intense fear often precede potential buying opportunities, as assets may be undervalued. However, it's crucial to conduct thorough research and consider your risk tolerance before making any investment decisions. Remember, market sentiment can shift rapidly, and past performance doesn't guarantee future results.
GT Holdings Distribution
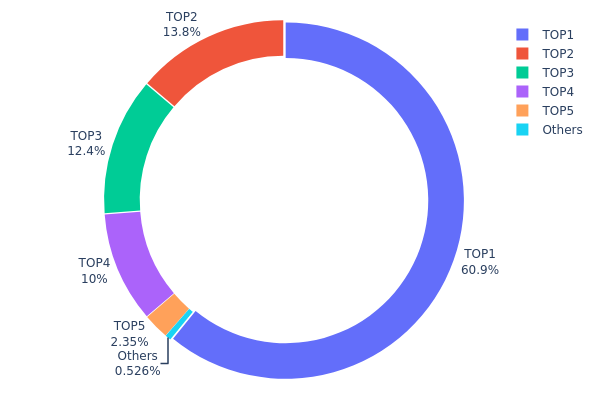
The address holdings distribution data provides crucial insights into the concentration of GT tokens across different addresses. Analysis of this data reveals a highly concentrated distribution pattern, with the top 5 addresses controlling 99.45% of the total GT supply.
The top address alone holds a significant 60.88% of all GT tokens, indicating a substantial centralization of ownership. This high concentration raises concerns about potential market manipulation and price volatility. The second to fourth largest holders possess 13.81%, 12.42%, and 10.00% respectively, further emphasizing the concentrated nature of GT holdings. Such a distribution structure suggests that a small number of entities have considerable influence over the GT market.
This level of concentration could impact market dynamics, potentially leading to increased price volatility and susceptibility to large-scale sell-offs or acquisitions. It also raises questions about the true level of decentralization within the GT ecosystem. While this concentration may provide some stability in terms of long-term holding, it also presents risks to the overall market structure and liquidity of GT tokens.
Click to view the current GT Holdings Distribution
| Top | Address | Holding Qty | Holding (%) |
|---|---|---|---|
| 1 | 0x2b8f...95f308 | 182655.53K | 60.88% |
| 2 | 0x1c4b...bb558c | 41459.93K | 13.81% |
| 3 | 0xc882...84f071 | 37267.47K | 12.42% |
| 4 | 0x9bbe...252b19 | 30000.00K | 10.00% |
| 5 | 0xaaac...3dca17 | 7038.97K | 2.34% |
| - | Others | 1578.10K | 0.55% |
II. Core Factors Affecting GT's Future Price
Supply Mechanism
- Deflationary Mechanism: GT implements a token burn mechanism to reduce supply over time.
- Historical Pattern: Previous token burns have generally had a positive impact on GT price.
- Current Impact: The ongoing burn mechanism is expected to continue supporting GT's value.
Institutional and Whale Dynamics
- Institutional Holdings: Several crypto investment firms have added GT to their portfolios.
- Corporate Adoption: Gate.com's partnerships with various blockchain projects have increased GT utility.
Macroeconomic Environment
- Monetary Policy Impact: Central bank policies regarding digital assets may influence GT's market position.
- Inflation Hedge Properties: GT has shown some potential as a store of value during inflationary periods.
Technological Development and Ecosystem Building
- GateChain Upgrades: Continuous improvements to GateChain enhance GT's utility and value proposition.
- Ecosystem Applications: Gate.com's expansion into DeFi and NFT markets creates new use cases for GT.
III. GT Price Prediction for 2025-2030
2025 Outlook
- Conservative prediction: $7.88 - $9.41
- Neutral prediction: $9.41 - $12.47
- Optimistic prediction: $12.47 - $15.10 (requires favorable market conditions and increased adoption)
2027 Mid-term Outlook
- Market stage expectation: Potential growth phase with increased volatility
- Price range forecast:
- 2026: $10.28 - $14.58
- 2027: $8.97 - $18.22
- Key catalysts: Expanding Gate.com ecosystem, broader crypto market trends, and regulatory developments
2030 Long-term Outlook
- Base scenario: $19.63 - $23.75 (assuming steady growth and adoption)
- Optimistic scenario: $23.75 - $28.76 (with accelerated market expansion and favorable regulations)
- Transformative scenario: $28.76+ (under extremely favorable conditions and breakthrough innovations)
- 2030-12-31: GT $21.62 (average price prediction for 2030)
| 年份 | 预测最高价 | 预测平均价格 | 预测最低价 | 涨跌幅 |
|---|---|---|---|---|
| 2025 | 15.0972 | 10.94 | 7.8768 | 0 |
| 2026 | 14.58083 | 13.0186 | 10.28469 | 18 |
| 2027 | 18.21563 | 13.79972 | 8.96982 | 25 |
| 2028 | 23.85143 | 16.00767 | 8.64414 | 45 |
| 2029 | 23.31757 | 19.92955 | 16.54153 | 81 |
| 2030 | 28.75934 | 21.62356 | 11.89296 | 96 |
IV. GT Professional Investment Strategy and Risk Management
GT Investment Methodology
(1) Long-term Holding Strategy
- Suitable for: Conservative investors seeking stable growth
- Operation suggestions:
- Accumulate GT during market dips
- Set up regular investment plans
- Store GT in secure wallets with private key control
(2) Active Trading Strategy
- Technical analysis tools:
- Moving Averages: Use to identify trends and support/resistance levels
- RSI: Monitor overbought/oversold conditions
- Key points for swing trading:
- Set clear entry and exit points
- Use stop-loss orders to manage risk
GT Risk Management Framework
(1) Asset Allocation Principles
- Conservative investors: 5-10%
- Aggressive investors: 10-20%
- Professional investors: 20-30%
(2) Risk Hedging Solutions
- Diversification: Spread investments across different cryptocurrencies and traditional assets
- Options strategies: Use put options for downside protection
(3) Secure Storage Solutions
- Hot wallet recommendation: Gate Web3 Wallet
- Cold storage solution: Hardware wallets for large holdings
- Security precautions: Enable 2FA, use strong passwords, and regularly update software
V. GT Potential Risks and Challenges
GT Market Risks
- Volatility: GT price can experience significant fluctuations
- Competition: Emergence of new tokens with similar functionalities
- Liquidity: Potential challenges in trading large volumes
GT Regulatory Risks
- Policy changes: Evolving cryptocurrency regulations may impact GT's usage and value
- Compliance requirements: Increased KYC/AML standards could affect adoption
- Cross-border restrictions: International regulations may limit GT's global accessibility
GT Technical Risks
- Smart contract vulnerabilities: Potential security issues in the underlying code
- Network congestion: High transaction volumes could lead to slower processing times
- Technological obsolescence: Rapid advancements in blockchain technology may require upgrades
VI. Conclusion and Action Recommendations
GT Investment Value Assessment
GT offers potential long-term value as a utility token within the Gate.com ecosystem, but short-term volatility and regulatory uncertainties pose risks.
GT Investment Recommendations
✅ Newcomers: Start with small, regular investments to understand market dynamics ✅ Experienced investors: Consider a balanced approach with both long-term holding and active trading ✅ Institutional investors: Explore GT as part of a diversified crypto portfolio, focusing on its utility within the Gate.com platform
GT Trading Participation Methods
- Spot trading: Direct purchase and sale of GT on Gate.com
- Staking: Participate in GT staking programs for potential rewards
- Ecosystem participation: Utilize GT for various services within the Gate.com platform
Cryptocurrency investments carry extremely high risks. This article does not constitute investment advice. Investors should make decisions carefully based on their own risk tolerance and are advised to consult professional financial advisors. Never invest more than you can afford to lose.
FAQ
What is the price prediction for GT coin in 2025?
Based on market trends and expert analysis, GT coin is predicted to reach $10-$12 by 2025, driven by Gate.com's growth and increased adoption in the crypto ecosystem.
What is the price target for GT?
Based on market trends and expert analysis, the price target for GT is projected to reach $10-$15 by the end of 2026, driven by Gate.com's expansion and increased adoption of the token in the crypto ecosystem.
Can grt coin reach $10?
Yes, GRT could potentially reach $10 in the long term, driven by increased adoption of The Graph protocol and overall growth in the Web3 ecosystem.
Does Rarible have a future?
Yes, Rarible has a promising future. As a leading NFT marketplace, it continues to innovate and adapt to the evolving Web3 landscape, attracting creators and collectors alike.
Share
Content
Introduction: GT's Market Position and Investment Value
I. GT Price History Review and Current Market Status
II. Core Factors Affecting GT's Future Price
III. GT Price Prediction for 2025-2030
IV. GT Professional Investment Strategy and Risk Management
V. GT Potential Risks and Challenges
VI. Conclusion and Action Recommendations
FAQ

