2025 GRT Price Prediction: Analyzing Graph Protocol's Future Value Trajectory and Market Potential
Introduction: GRT's Market Position and Investment Value
The Graph (GRT), as a decentralized protocol for indexing and querying blockchain data, has made significant strides since its inception in 2020. As of 2025, The Graph's market cap has reached $975,470,752, with a circulating supply of approximately 10,477,666,511 tokens, and a price hovering around $0.0931. This asset, often referred to as the "Google of blockchains," is playing an increasingly crucial role in the field of decentralized data indexing and querying.
This article will provide a comprehensive analysis of The Graph's price trends from 2025 to 2030, considering historical patterns, market supply and demand, ecosystem development, and macroeconomic factors to offer professional price predictions and practical investment strategies for investors.
I. GRT Price History Review and Current Market Status
GRT Historical Price Evolution Trajectory
- 2020: Initial launch in December, price opened at $0.03
- 2021: Reached all-time high of $2.84 on February 12th
- 2022: Market downturn, price dropped to all-time low of $0.052051 on November 22nd
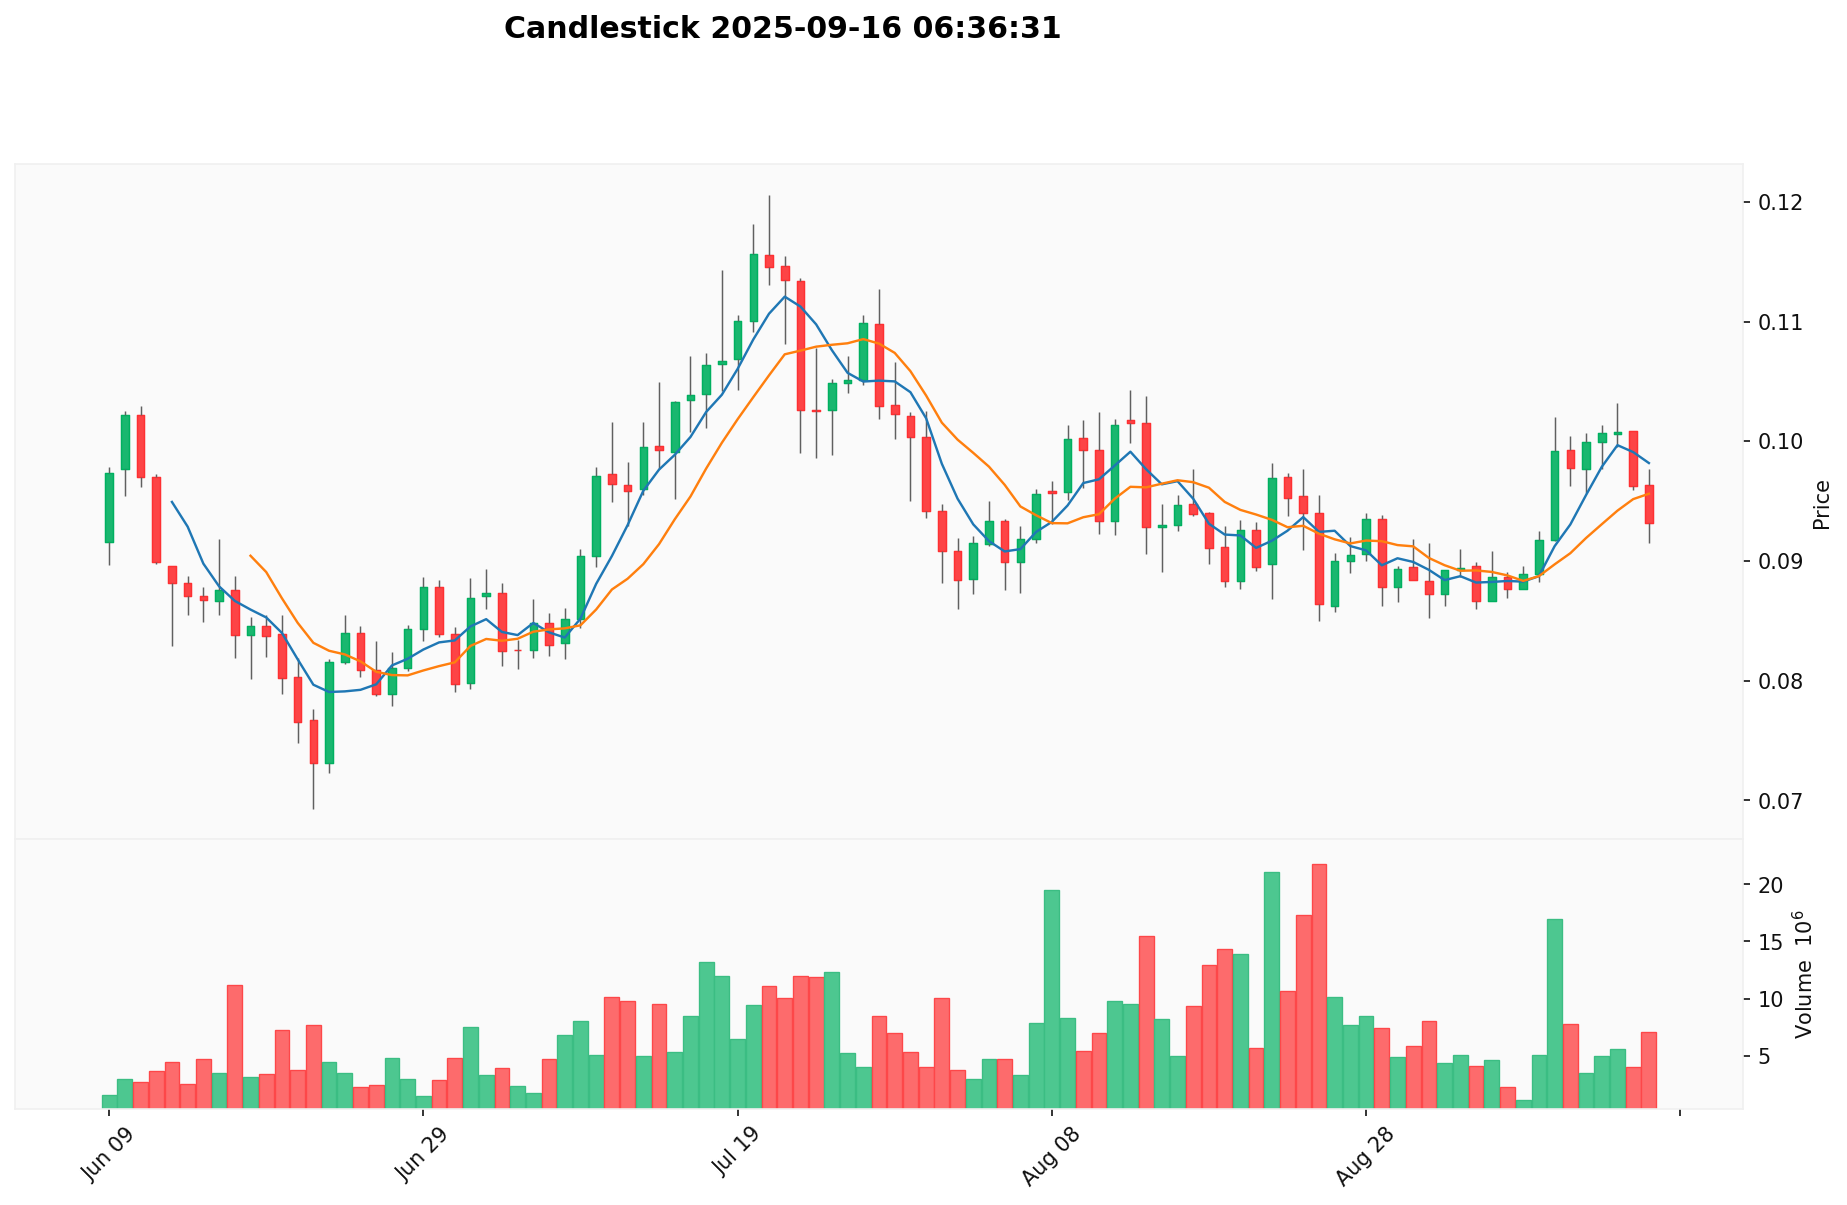
GRT Current Market Situation
As of September 16, 2025, GRT is trading at $0.0931, representing a 24-hour decline of 3.57%. The token's market capitalization stands at $975,470,752, ranking it 111th in the global cryptocurrency market. GRT has experienced a 1-hour gain of 0.4%, but shows losses across longer timeframes: -1.59% over 7 days, -2.36% over 30 days, and a significant -34.71% over the past year. The current price is considerably below its all-time high, suggesting a prolonged bearish trend. Trading volume in the last 24 hours amounts to $706,914, indicating moderate market activity.
Click to view the current GRT market price
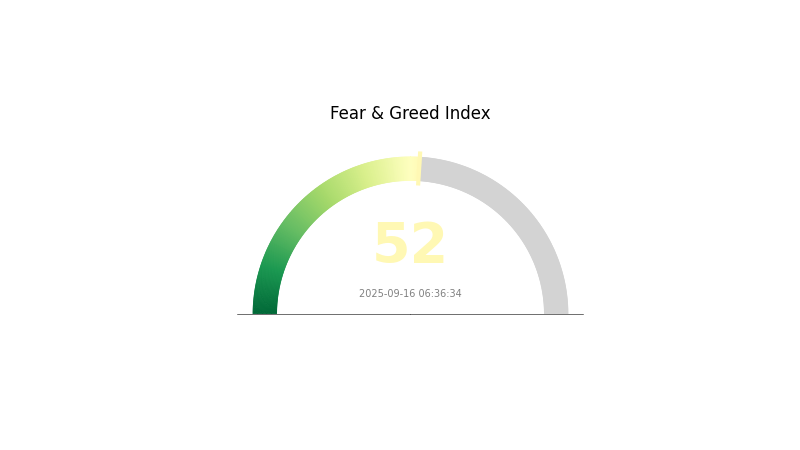
GRT Market Sentiment Indicator
2025-09-16 Fear and Greed Index: 52 (Neutral)
Click to view the current Fear & Greed Index
The crypto market sentiment remains balanced today, with the Fear and Greed Index standing at 52, indicating a neutral outlook. This suggests that investors are neither overly fearful nor excessively greedy. Such equilibrium often precedes significant market movements, as traders cautiously assess potential opportunities. While the neutral sentiment provides a stable foundation, it's crucial for investors to stay vigilant and conduct thorough research before making any investment decisions in the volatile crypto market.
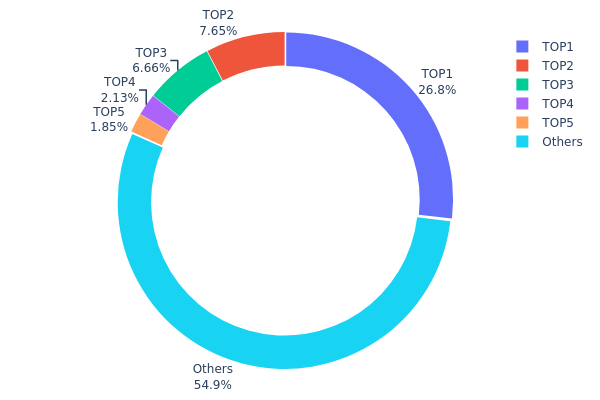
GRT Holdings Distribution
The address holdings distribution data provides insights into the concentration of GRT tokens across different addresses. Analysis of this data reveals a relatively high concentration of GRT tokens among the top holders. The top address holds a significant 26.82% of the total supply, while the top 5 addresses collectively control 45.1% of GRT tokens.
This level of concentration raises concerns about potential market manipulation and price volatility. With a single address holding over a quarter of the supply, there's a risk of large-scale sell-offs impacting market stability. However, it's worth noting that 54.9% of tokens are distributed among other addresses, indicating some level of decentralization.
The current distribution structure suggests a moderate level of centralization in GRT's on-chain ecosystem. While this concentration may provide some stability through large stakeholders, it also poses risks to market fairness and could potentially influence governance decisions if these addresses represent significant voting power in the network.
Click to view the current GRT Holdings Distribution
| Top | Address | Holding Qty | Holding (%) |
|---|---|---|---|
| 1 | 0x36af...77f090 | 2896878.98K | 26.82% |
| 2 | 0x32ec...7f2ca1 | 826666.67K | 7.65% |
| 3 | 0x823f...27396c | 719519.91K | 6.66% |
| 4 | 0x5a52...70efcb | 229640.32K | 2.12% |
| 5 | 0xf550...1263b9 | 200204.89K | 1.85% |
| - | Others | 5927352.06K | 54.9% |
II. Key Factors Affecting GRT's Future Price
Supply Mechanism
- Circulating Supply: The current circulating supply of GRT is 10,477,666,511.78 tokens.
- Total Supply: The total supply of GRT is 11,352,704,058.71 tokens.
- Current Impact: The difference between circulating and total supply suggests potential for future token releases, which may impact price.
Institutional and Whale Dynamics
- Enterprise Adoption: The Graph is being used by various enterprises for data indexing and querying on blockchain networks.
Macroeconomic Environment
- Inflation Hedging Properties: As a utility token in the blockchain data space, GRT may offer some protection against inflation.
Technological Development and Ecosystem Building
- Ecosystem Applications: The Graph serves as a crucial infrastructure for many DApps and blockchain projects, providing decentralized indexing and querying services.
- Multi-Chain Support: The Graph has expanded its ecosystem to support multiple blockchain platforms, including Ethereum, Avalanche, Solana, and Arbitrum.
III. GRT Price Prediction for 2025-2030
2025 Outlook
- Conservative prediction: $0.07727 - $0.0931
- Neutral prediction: $0.0931 - $0.10427
- Optimistic prediction: $0.10427 - $0.11 (requires positive market sentiment and project developments)
2027-2028 Outlook
- Market stage expectation: Potential growth phase with increased volatility
- Price range forecast:
- 2027: $0.09043 - $0.15384
- 2028: $0.06918 - $0.18447
- Key catalysts: Ecosystem expansion, technological advancements, and broader crypto market trends
2029-2030 Long-term Outlook
- Base scenario: $0.14405 - $0.16966 (assuming steady growth and adoption)
- Optimistic scenario: $0.16966 - $0.17804 (assuming strong market performance and project success)
- Transformative scenario: $0.17804 - $0.20 (assuming breakthrough innovations and mainstream adoption)
- 2030-12-31: GRT $0.16486 (potential stabilization after period of growth)
| 年份 | 预测最高价 | 预测平均价格 | 预测最低价 | 涨跌幅 |
|---|---|---|---|---|
| 2025 | 0.10427 | 0.0931 | 0.07727 | 0 |
| 2026 | 0.13619 | 0.09869 | 0.05329 | 5 |
| 2027 | 0.15384 | 0.11744 | 0.09043 | 25 |
| 2028 | 0.18447 | 0.13564 | 0.06918 | 45 |
| 2029 | 0.16966 | 0.16005 | 0.14405 | 71 |
| 2030 | 0.17804 | 0.16486 | 0.15826 | 76 |
IV. Professional GRT Investment Strategies and Risk Management
GRT Investment Methodology
(1) Long-term Holding Strategy
- Suitable for: Long-term investors and believers in The Graph's technology
- Operation suggestions:
- Accumulate GRT during market dips
- Stake GRT to participate in network governance and earn rewards
- Store GRT in secure non-custodial wallets
(2) Active Trading Strategy
- Technical analysis tools:
- Moving Averages: Use to identify trends and potential reversal points
- Relative Strength Index (RSI): Helps determine overbought or oversold conditions
- Key points for swing trading:
- Monitor The Graph's development milestones and partnerships
- Pay attention to overall crypto market sentiment
GRT Risk Management Framework
(1) Asset Allocation Principles
- Conservative investors: 1-3% of crypto portfolio
- Moderate investors: 3-7% of crypto portfolio
- Aggressive investors: 7-10% of crypto portfolio
(2) Risk Hedging Solutions
- Diversification: Spread investments across different blockchain projects
- Stop-loss orders: Set predetermined exit points to limit potential losses
(3) Secure Storage Solutions
- Hot wallet recommendation: Gate Web3 Wallet
- Cold storage solution: Hardware wallets for long-term holdings
- Security precautions: Enable two-factor authentication, use strong passwords
V. Potential Risks and Challenges for GRT
GRT Market Risks
- Volatility: Crypto market's inherent price fluctuations
- Competition: Emergence of rival blockchain indexing solutions
- Adoption: Slow integration by developers and projects
GRT Regulatory Risks
- Unclear regulations: Potential for stricter crypto regulations globally
- Token classification: Risk of GRT being classified as a security
- Cross-border restrictions: Limitations on GRT trading in certain jurisdictions
GRT Technical Risks
- Smart contract vulnerabilities: Potential for exploits in The Graph's code
- Scalability issues: Challenges in handling increased network demand
- Centralization concerns: Risks associated with a small group of large indexers
VI. Conclusion and Action Recommendations
GRT Investment Value Assessment
The Graph (GRT) presents a compelling long-term value proposition as a crucial infrastructure for the decentralized web. However, short-term volatility and adoption challenges pose significant risks.
GRT Investment Recommendations
✅ Newcomers: Start with small, regular investments to build a position over time ✅ Experienced investors: Consider a balanced approach of holding and active trading ✅ Institutional investors: Explore staking and governance participation opportunities
GRT Participation Methods
- Spot trading: Buy and sell GRT on Gate.com
- Staking: Participate in network security and earn rewards
- Indexer/Curator roles: For technical users, contribute to The Graph's ecosystem
Cryptocurrency investments carry extremely high risks. This article does not constitute investment advice. Investors should make decisions carefully based on their risk tolerance and are advised to consult professional financial advisors. Never invest more than you can afford to lose.
FAQ
Will GRT reach $10?
GRT has potential to reach $10. Market analysis suggests it could happen in the next few years, given its past performance and current trends.
Does grt crypto have a future?
GRT has potential for growth in the Web3 ecosystem. As blockchain data needs increase, The Graph's decentralized indexing could become more valuable, potentially driving GRT's future adoption and price appreciation.
What is the GRT forecast for 2025?
Based on current projections, The Graph (GRT) is forecast to reach a minimum price of $0.090 and an average price of $0.093 per token in 2025, showing significant growth potential.
Will The Graph reach $5?
While reaching $5 is ambitious, it's possible in a strong bull market. GRT's utility in Web3 and growing adoption could drive significant price appreciation by 2025-2026.
Share
Content
Introduction: GRT's Market Position and Investment Value
I. GRT Price History Review and Current Market Status
II. Key Factors Affecting GRT's Future Price
III. GRT Price Prediction for 2025-2030
IV. Professional GRT Investment Strategies and Risk Management
V. Potential Risks and Challenges for GRT
VI. Conclusion and Action Recommendations
FAQ

