2025 DOT Price Prediction: Polkadot's Potential for Exponential Growth in the Multi-Chain Era
Introduction: DOT's Market Position and Investment Value
Polkadot (DOT), as a leading blockchain interoperability platform, has achieved significant milestones since its inception in 2020. As of 2025, Polkadot's market capitalization has reached $4.66 billion, with a circulating supply of approximately 1.64 billion tokens, and a price hovering around $2.85. This asset, often referred to as the "Internet of Blockchains," is playing an increasingly crucial role in connecting various blockchain networks and enabling cross-chain communication.
This article will provide a comprehensive analysis of Polkadot's price trends from 2025 to 2030, considering historical patterns, market supply and demand, ecosystem development, and macroeconomic factors to offer professional price predictions and practical investment strategies for investors.
I. DOT Price History Review and Current Market Status
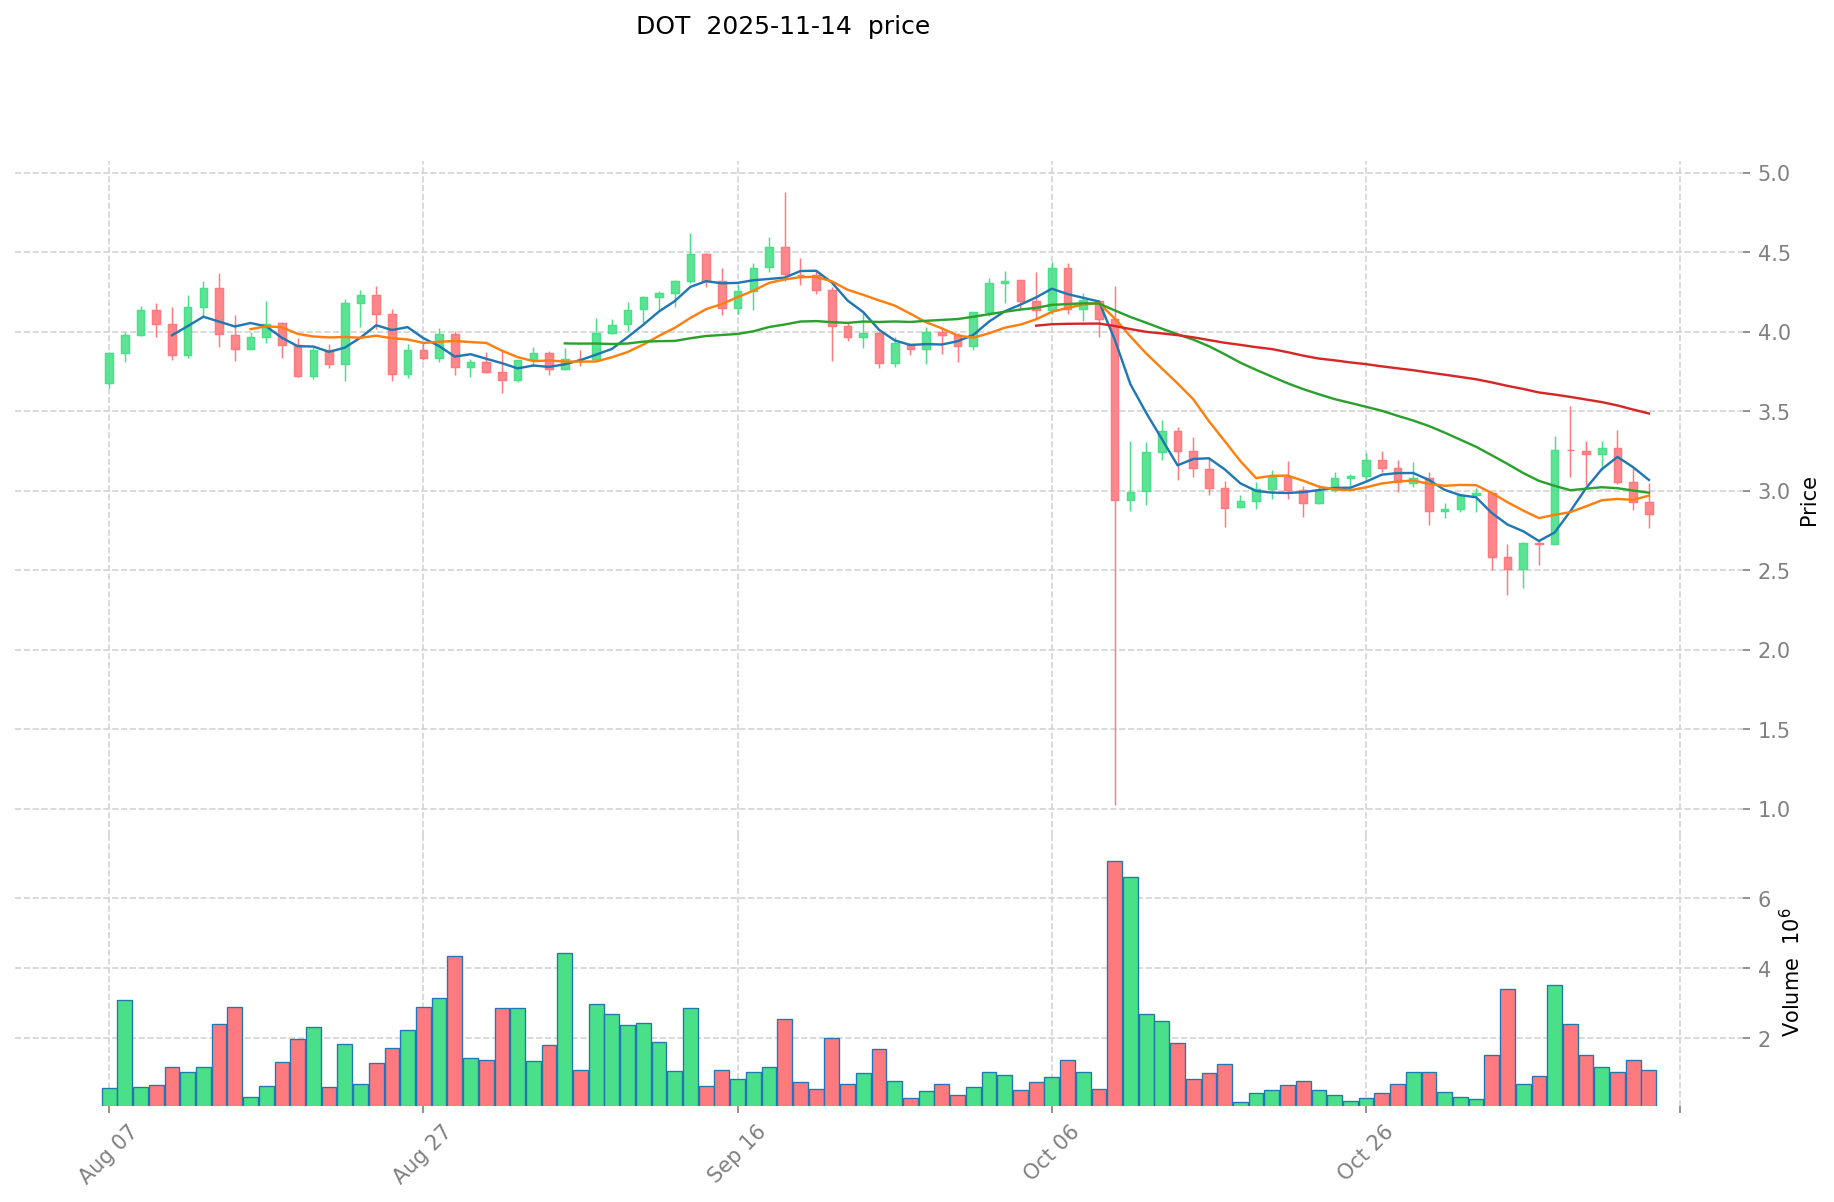
DOT Historical Price Evolution Trajectory
- 2020: DOT launched, price started around $2.69
- 2021: Bull market peak, price reached all-time high of $54.98 on November 4
- 2022-2023: Crypto winter, price declined to around $4-$6 range
- 2025: Current bear market, price dropped to all-time low of $2.13 on October 11
DOT Current Market Situation
As of November 14, 2025, DOT is trading at $2.85, down 4.96% in the last 24 hours. The current price represents a 94.81% decline from its all-time high of $54.98. DOT's market cap stands at $4.66 billion, ranking it 32nd among all cryptocurrencies. The 24-hour trading volume is $3.34 million, indicating moderate market activity. The circulating supply matches the total supply at 1,635,551,146.79 DOT, with no maximum supply limit. Short-term price trends show a 1.05% decrease in the past hour and a 0.80% increase over the past week. However, longer-term trends remain bearish, with a 12.54% decline over the past month and a substantial 43.72% drop over the past year. The current market sentiment for DOT is characterized as "Extreme Fear" according to the VIX index, suggesting significant investor caution in the current market conditions.
Click to view the current DOT market price
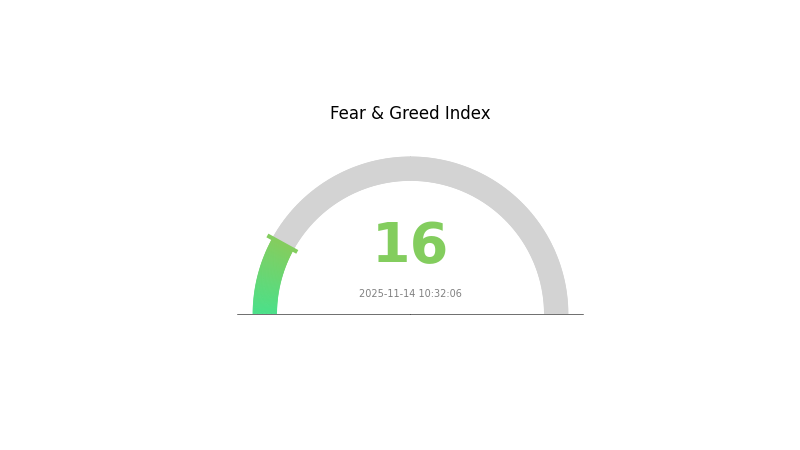
DOT Market Sentiment Indicator
2025-11-14 Fear and Greed Index: 16 (Extreme Fear)
Click to view the current Fear & Greed Index
The crypto market is gripped by extreme fear, with the sentiment index plummeting to 16. This level of pessimism often precedes potential buying opportunities, as historically, extreme fear has signaled market bottoms. However, investors should remain cautious and conduct thorough research before making any decisions. Gate.com offers comprehensive market data and analysis tools to help navigate these volatile conditions. Remember, market sentiment can shift rapidly, so stay informed and manage your risk wisely.
DOT Holdings Distribution
The address holdings distribution data provides insights into the concentration of DOT tokens among different wallet addresses. Analysis of this data reveals a moderate level of centralization in DOT holdings. The top address holds 11.73% of the total supply, while the top 5 addresses collectively control 25.79% of DOT tokens. This suggests a relatively concentrated distribution at the upper end.
However, it's noteworthy that 74.21% of DOT tokens are held by addresses outside the top 5, indicating a significant level of distribution among smaller holders. This balance between large holders and a broader base of smaller investors could contribute to market stability and reduce the risk of price manipulation by any single entity.
The current distribution structure implies a moderate level of decentralization for DOT. While there are some large holders with significant influence, the majority of tokens are spread across numerous addresses. This distribution pattern may help maintain a relatively stable on-chain structure and potentially mitigate extreme price volatility caused by the actions of a few major holders.
Click to view the current DOT Holdings Distribution
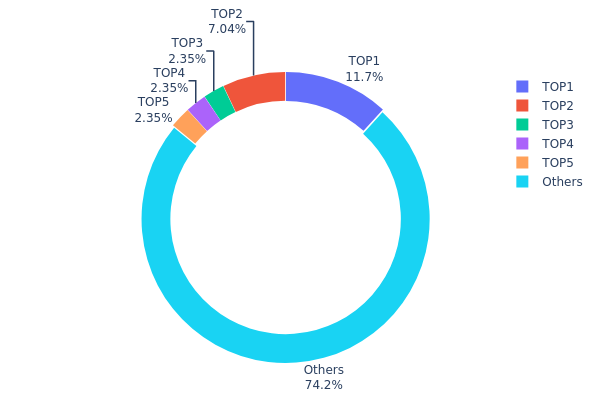
| Top | Address | Holding Qty | Holding (%) |
|---|---|---|---|
| 1 | 13MTX3...7UW36b | 16.23K | 11.73% |
| 2 | 15Mba2...w7RmMs | 9.74K | 7.04% |
| 3 | 1TpMim...2zHPDg | 3.25K | 2.34% |
| 4 | 16Uja2...tZ7Hhm | 3.25K | 2.34% |
| 5 | 14ckUe...pGpmpR | 3.25K | 2.34% |
| - | Others | 102.56K | 74.21% |
II. Core Factors Affecting DOT's Future Price
Technical Development and Ecosystem Building
- Parachain Auctions: Ongoing parachain auctions allow projects to secure slots on the Polkadot network, potentially increasing demand for DOT tokens.
- Cross-Chain Interoperability: Polkadot's focus on enabling seamless communication between different blockchain networks could drive adoption and value.
- Ecosystem Applications: Growing number of DApps and projects building on Polkadot, including DeFi protocols, NFT platforms, and Web3 infrastructure solutions.
III. DOT Price Prediction for 2025-2030
2025 Outlook
- Conservative prediction: $1.74 - $2.50
- Neutral prediction: $2.50 - $2.85
- Optimistic prediction: $2.85 - $3.05 (requires positive market sentiment and ecosystem growth)
2027-2028 Outlook
- Market stage expectation: Potential bull market phase
- Price range forecast:
- 2027: $3.09 - $4.52
- 2028: $2.99 - $5.33
- Key catalysts: Increased adoption of Polkadot ecosystem, successful parachain developments
2029-2030 Long-term Outlook
- Base scenario: $4.70 - $5.00 (assuming steady ecosystem growth and market stability)
- Optimistic scenario: $5.00 - $6.00 (assuming widespread adoption and favorable market conditions)
- Transformative scenario: $6.00 - $6.55 (assuming breakthrough technological advancements and mass adoption)
- 2030-12-31: DOT $5.00 (potential 75% increase from 2025 levels)
| 年份 | 预测最高价 | 预测平均价格 | 预测最低价 | 涨跌幅 |
|---|---|---|---|---|
| 2025 | 3.05485 | 2.855 | 1.74155 | 0 |
| 2026 | 4.40284 | 2.95493 | 1.65476 | 3 |
| 2027 | 4.52502 | 3.67888 | 3.09026 | 29 |
| 2028 | 5.33254 | 4.10195 | 2.99443 | 43 |
| 2029 | 5.28332 | 4.71725 | 2.50014 | 65 |
| 2030 | 6.55037 | 5.00028 | 3.35019 | 75 |
IV. DOT Professional Investment Strategies and Risk Management
DOT Investment Methodology
(1) Long-term Holding Strategy
- Suitable for: Risk-tolerant investors with a long-term perspective
- Operation suggestions:
- Accumulate DOT during market dips
- Stake DOT to earn passive income
- Store in Gate Web3 wallet for enhanced security
(2) Active Trading Strategy
- Technical analysis tools:
- Moving Averages: Identify trends and potential reversal points
- Relative Strength Index (RSI): Gauge overbought/oversold conditions
- Key points for swing trading:
- Monitor DOT's correlation with Bitcoin's price movements
- Pay attention to Polkadot ecosystem developments and upgrades
DOT Risk Management Framework
(1) Asset Allocation Principles
- Conservative investors: 1-3%
- Aggressive investors: 5-10%
- Professional investors: 10-20%
(2) Risk Hedging Solutions
- Diversification: Spread investments across multiple cryptocurrencies
- Stop-loss orders: Set predetermined exit points to limit potential losses
(3) Secure Storage Solutions
- Hot wallet recommendation: Gate Web3 wallet
- Cold storage solution: Hardware wallet for large holdings
- Security precautions: Enable two-factor authentication, use strong passwords
V. DOT Potential Risks and Challenges
DOT Market Risks
- High volatility: DOT price can experience significant fluctuations
- Competition: Emerging blockchain platforms may challenge Polkadot's market position
- Market sentiment: Broader crypto market trends can impact DOT's performance
DOT Regulatory Risks
- Unclear regulations: Evolving cryptocurrency regulations may affect DOT's adoption
- Compliance challenges: Increased scrutiny from regulators could impact Polkadot's operations
- Cross-border issues: Varying regulatory approaches in different jurisdictions
DOT Technical Risks
- Smart contract vulnerabilities: Potential security flaws in parachain implementations
- Scalability challenges: Ensuring network performance as the ecosystem grows
- Interoperability issues: Complexities in connecting diverse blockchain networks
VI. Conclusion and Action Recommendations
DOT Investment Value Assessment
DOT presents long-term potential as a key player in blockchain interoperability, but faces short-term volatility and competitive pressures. Its success depends on continued ecosystem growth and technological advancements.
DOT Investment Recommendations
✅ Beginners: Start with small, regular investments to understand the market
✅ Experienced investors: Consider a balanced approach of holding and strategic trading
✅ Institutional investors: Explore ecosystem investments and staking opportunities
DOT Trading Participation Methods
- Spot trading: Buy and sell DOT on Gate.com
- Staking: Participate in Polkadot's network security for passive income
- Parachain auctions: Support promising projects building on Polkadot
Cryptocurrency investments carry extremely high risks. This article does not constitute investment advice. Investors should make decisions based on their own risk tolerance and are advised to consult professional financial advisors. Never invest more than you can afford to lose.
FAQ
What will Polkadot be worth in 2025?
Based on market trends and adoption, Polkadot could reach $50-$60 per DOT by 2025, driven by its interoperability features and growing ecosystem.
Can Polkadot reach $50?
Yes, Polkadot could potentially reach $50 by 2025. With its innovative technology and growing ecosystem, DOT has the potential for significant price appreciation in the coming years.
Will Dot reach $100?
Yes, DOT could potentially reach $100 in the future. As the Polkadot ecosystem grows and adoption increases, the price may rise significantly. However, exact predictions are challenging in the volatile crypto market.
Does dot crypto have a future?
Yes, DOT crypto has a promising future. As a key player in the Web3 ecosystem, Polkadot's interoperability focus positions it well for long-term growth and adoption in the evolving blockchain landscape.
Share
Content
Introduction: DOT's Market Position and Investment Value
I. DOT Price History Review and Current Market Status
II. Core Factors Affecting DOT's Future Price
III. DOT Price Prediction for 2025-2030
IV. DOT Professional Investment Strategies and Risk Management
V. DOT Potential Risks and Challenges
VI. Conclusion and Action Recommendations
FAQ

