Trade
Basic
Futures
Futures
Hundreds of contracts settled in USDT or BTC
TradFi
Gold
Trade global traditional assets with USDT in one place
Options
Hot
Trade European-style vanilla options
Unified Account
Maximize your capital efficiency
Demo Trading
Futures Kickoff
Get prepared for your futures trading
Futures Events
Participate in events to win generous rewards
Demo Trading
Use virtual funds to experience risk-free trading
Earn
Launch
CandyDrop
Collect candies to earn airdrops
Launchpool
Quick staking, earn potential new tokens
HODLer Airdrop
Hold GT and get massive airdrops for free
Launchpad
Be early to the next big token project
Alpha Points
Trade on-chain assets and enjoy airdrop rewards!
Futures Points
Earn futures points and claim airdrop rewards
Investment
Simple Earn
Earn interests with idle tokens
Auto-Invest
Auto-invest on a regular basis
Dual Investment
Buy low and sell high to take profits from price fluctuations
Soft Staking
Earn rewards with flexible staking
Crypto Loan
0 Fees
Pledge one crypto to borrow another
Lending Center
One-stop lending hub
VIP Wealth Hub
Customized wealth management empowers your assets growth
Private Wealth Management
Customized asset management to grow your digital assets
Quant Fund
Top asset management team helps you profit without hassle
Staking
Stake cryptos to earn in PoS products
Smart Leverage
New
No forced liquidation before maturity, worry-free leveraged gains
GUSD Minting
Use USDT/USDC to mint GUSD for treasury-level yields
More
Zhang Yaoxi: Tariffs and ongoing geopolitical risks remain, and the outlook for gold prices continues to be bullish.
Zhang Yaoxi: Continued geopolitical risks keep tariffs in focus; gold price outlook remains bullish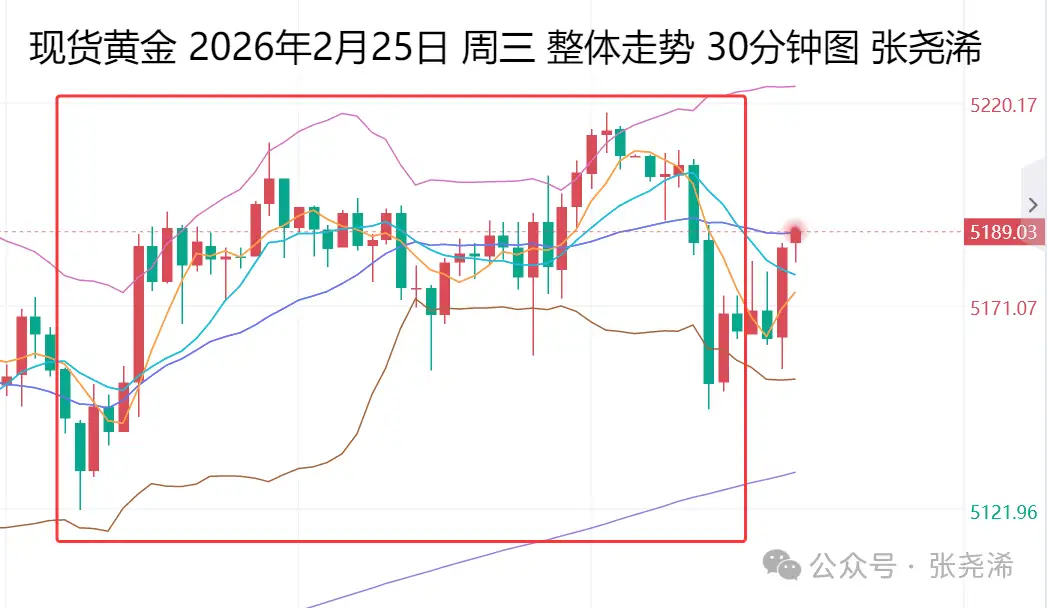
On the previous trading day, Wednesday (February 25): International gold prices initially rose then retraced, closing with a bullish line, but failed to hold steady and recover Tuesday’s decline, indicating short-term volatility and a potential downward adjustment. However, there are numerous support levels below, and the overall trend is gradually moving higher in a oscillating manner. Therefore, if a correction occurs and prices dip, touching support at various moving averages, it remains primarily a bullish setup.
Regarding the specific trend, gold opened in Asia at $5,143.28 per ounce, briefly hit a daily low of $5,120.96, then rebounded and continued to fluctuate. After the U.S. session, it reached a daily high of $5,217.39, but by the close, it dropped sharply again, ending at $5,165.06. The daily range was $96.43, with a net gain of $21.78, a 0.42% increase.
Influences include technical support buying, tensions ahead of Iran’s next nuclear negotiations, and U.S. military build-up, all supporting gold and silver prices. However, the prospect of the U.S. maintaining short-term interest rates could pose resistance to gold. Additionally, as risk appetite improves and stock markets rise, demand for safe-haven assets diminishes. U.S. Treasury yields continue to rise, limiting bullish momentum in gold, leading to a retreat and closing lower.
Looking ahead to Thursday (February 26): International gold opened stronger, supported by the 5-day moving average and ongoing U.S. trade policy uncertainties, as U.S. Trade Representative Grier indicated tariffs of 15% will be announced and implemented. This provides support for gold prices.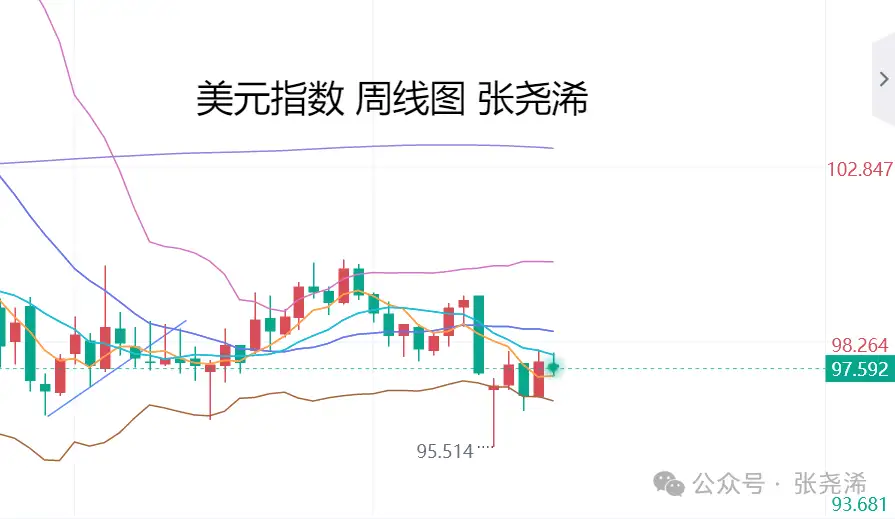
Thus, amid inflationary pressures from U.S. tariffs and geopolitical tensions before Iran’s nuclear talks, the gold outlook remains predominantly bullish.
Overall, given policymakers’ concerns over persistently high U.S. inflation, markets widely expect the Federal Reserve to keep interest rates unchanged at least until June. Federal funds futures imply only about a 53 basis point rate cut this year, roughly two 25-basis point reductions, with the first possibly in July or September. This indicates the easing cycle is still ongoing, just a matter of timing, supporting a bullish gold trend.
Additionally, PDR Gold ETF holdings as of February 25 increased to 1,097.62 tons, up 3.43 tons from the previous day, reaching a new high since February 2021. This accumulation signals strong institutional confidence in gold’s long-term value.
Therefore, this year’s gold market is in a window where tariffs, inflation, and Iran’s nuclear crisis intersect. In the short term, spring may see consolidation, but any declines or adjustments will likely be quickly offset by uncertainties. Amid ongoing global uncertainties, gold’s role as a safe-haven asset and trust anchor remains prominent. The overall trend for the year is bullish, and over the next year, with the Fed’s easing policies, a relatively weak dollar, and unresolved geopolitical risks, gold could push above $6,000.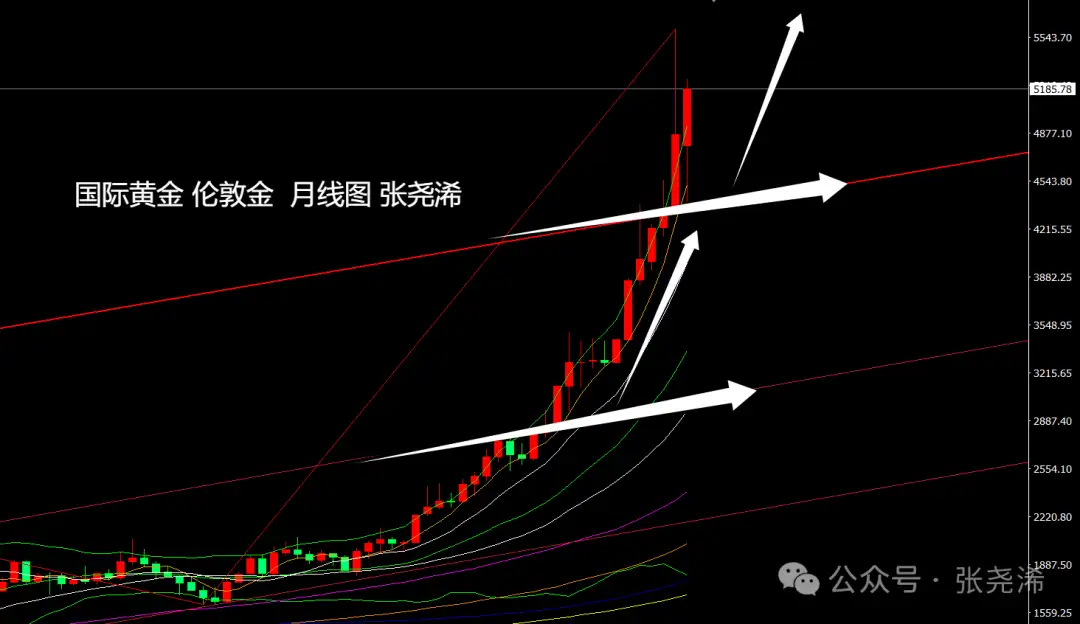
On a technical monthly basis, after continuing the bearish reversal in February following January’s decline, gold found support at the upward trendline that had been broken earlier this year, rebounded, and maintained within a new bull market space. It also remains above the 5-month moving average, indicating that the January correction has run its course and the new bullish outlook remains valid. The trend is expected to strengthen and rise again.
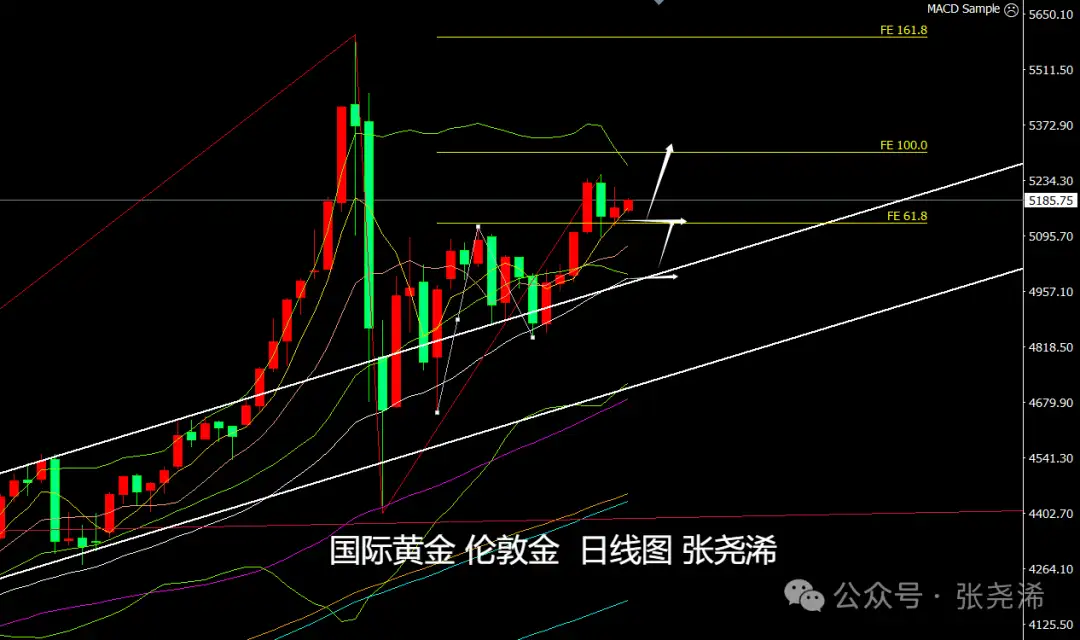
On the daily chart, bullish momentum has weakened today, but prices still stay above the 5-day moving average, with multiple support levels below. The technical indicators also lean bullish, suggesting a higher probability of continued strength. Therefore, trading should focus on buying dips, with support at various moving averages indicating potential for further gains.
Gold: Support levels around $5,130 or $5,080; resistance levels near $5,230 or $5,300.
Silver: Support levels around $87.30 or $85.00; resistance levels near $91.40 or $92.70.
Note:
Gold TD = (International gold price × exchange rate) / 31.1035
A $1 fluctuation in international gold prices roughly translates to a 0.25 yuan change in Gold TD (theoretical).
U.S. futures gold price = London spot price × (1 + gold swap rate × days to expiry / 365)
Follow me to clarify your gold trading ideas!
Reviewing historical cause and effect, interpreting current environments, and projecting future trends—adopting bold predictions with cautious trading principles. – Zhang Yaoxi
The above opinions and analyses are solely the author’s personal views, for reference only, not trading advice. Trade at your own risk.
You decide your own money.