Trade
Basic
Futures
Futures
Hundreds of contracts settled in USDT or BTC
TradFi
Gold
Trade global traditional assets with USDT in one place
Options
Hot
Trade European-style vanilla options
Unified Account
Maximize your capital efficiency
Demo Trading
Futures Kickoff
Get prepared for your futures trading
Futures Events
Participate in events to win generous rewards
Demo Trading
Use virtual funds to experience risk-free trading
Earn
Launch
CandyDrop
Collect candies to earn airdrops
Launchpool
Quick staking, earn potential new tokens
HODLer Airdrop
Hold GT and get massive airdrops for free
Launchpad
Be early to the next big token project
Alpha Points
Trade on-chain assets and enjoy airdrop rewards!
Futures Points
Earn futures points and claim airdrop rewards
Investment
Simple Earn
Earn interests with idle tokens
Auto-Invest
Auto-invest on a regular basis
Dual Investment
Buy low and sell high to take profits from price fluctuations
Soft Staking
Earn rewards with flexible staking
Crypto Loan
0 Fees
Pledge one crypto to borrow another
Lending Center
One-stop lending hub
VIP Wealth Hub
Customized wealth management empowers your assets growth
Private Wealth Management
Customized asset management to grow your digital assets
Quant Fund
Top asset management team helps you profit without hassle
Staking
Stake cryptos to earn in PoS products
Smart Leverage
New
No forced liquidation before maturity, worry-free leveraged gains
GUSD Minting
Use USDT/USDC to mint GUSD for treasury-level yields
More
2100NEWS WEEKLY CRYPTO REPORT Feb-13
The NWST1100 index fell 3.00% last week; Morpho (MORPHO), a large-cap Ethereum-based Token, has made the most significant leap in rank within the NWSL100 crypto index on a biweekly basis.
*Below, we present a standardized weekly report and next week’s outlook, prepared based on the Theory Swingtum of intelligent finance. We gauge the crypto market’s breadth and direction by showing the 2100NEWS Digital Assets Total Index (NWST1100), which measures the performance of 1100 (by market capitalization) significant crypto assets. The information-dense chart is initially complex to read, but it clearly displays essential price information, key decision-making levels, momentum, trading volumes, and crypto market breadth. Monitoring Market Sentiment and Breadth is necessary to detect early signs of trend reversals or continued strength.
Our detailed analysis of the NWST1100 chart and related market indicators reveals essential insights into the current market conditions:
The NWST1100 index declined 3.00% over the week. Still, that headline masks a meaningful internal transition: the market moved from high-volatility reversal attempts to base-building, then into a late-week breakout impulse. Early in the week (Feb 7–10), price action was dominated by intraday whipsaws and rebound failures—classic “sell the rally” behavior following a liquidation shock. Mid-week (Feb 11–12), downside pressure began to fade, and the tape started printing higher lows, signaling that sellers were losing control. The inflection arrived on Feb 13, when the market broke upward from consolidation and closed strongly, shifting the tone from panic management to repair and tactical re-engagement.
According to the chart on the right, across all major segments (NWST1100, NWSET100, NWSL100, NWSCo100), A50R readings have remained depressed, keeping the market in an early-repair footprint. A50R levels were in the low teens overall, with the weakest cohorts still struggling. This confirms that the week’s breakout is best viewed as a relief/repair rally unless breadth expands meaningfully. Large caps (NWSL100) were the structurally weakest segment.
*This breadth indicator is essential in measuring the internal strength or weakness of the underlying index. Looking at the chart on the right side, we can see the A50R lines for four different categories of digital assets:
📉 Summary
This was a transition week: the market shifted from unstable rebound attempts into base-building, and finally into a late-week breakout that improved short-term momentum. However, the bigger structure remains damaged: PPO is still negative, breadth is still impaired, and leadership is uneven (with Ether notably lagging). The market is repairing, not yet trending.
Outlook for the Week Ahead
This section provides a probabilistic assessment of the cryptocurrency market’s short-term trajectory. While markets remain inherently unpredictable, cyclical patterns in price behavior and momentum often reveal recurring structures that help identify the next likely phase of development.
📌 Target and Scenario Considerations:
Most likely scenario: the market continues in a repair-rally mode—choppy but biased upward—provided the breakout holds, and pullbacks remain contained above the most recent support shelf. In that path, NWST1100 is likely to probe and work into the 4,720–4,780 resistance zone, with overlapping candles and short pullbacks typical of early repair. Importantly, given the current slope of the PPO histogram, the market’s “decision point” (confirmation vs stall) is more likely to become clear later in the week, not immediately—i.e., the histogram needs time to either complete the push toward zero or show a rejection pattern.
📍 Key Levels to Watch:
Investors and traders often rely on historical performance data to make informed decisions about their cryptocurrency holdings. After analyzing the table data, it is evident that the crypto market declined; the overall index fell by 3.00% over the last week.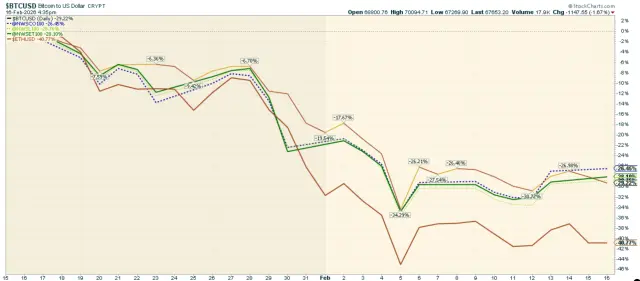 The accompanying chart highlights the performance of key cryptocurrencies, including Bitcoin and Ether, alongside the 2100NEWS Indices, which track Ethereum-based tokens (NWSET100), large caps (NWSL100), and coins (NWSCo100). Among these, coins (NWSCo100) stood out, outperforming other segments with the lowest decline of 26.45% over the past thirty days.
While the broader market has advanced, different segments and individual cryptocurrencies exhibit different performance dynamics.
Performance Trends by Market Segment:
✔ NWSCo100 (Coins) led,
✔ NWSET100 (Ethereum-based tokens) has been improving,
✔ Bitcoin and NWSBE weakened,
✔ Ether, NWS30, and NWSL100 (Large Caps) shifted into the lagging quadrant, suggesting early potential for renewed relative strength.
Investors and traders may use this information to adjust their portfolios, shifting focus toward assets with stronger relative momentum while remaining cautious about those in the Weakening quadrant.
*RRG® charts show the relative strength and momentum of groups of digital assets. Those with strong relative strength and momentum appear in the green Leading quadrant. As relative momentum fades, they typically move into the yellow Weakening quadrant. If relative strength then fades, they move into the red Lagging quadrant. Finally, when momentum picks up again, they shift into the blue Improving quadrant.
Crypto (Digital Assets) compared with global equity
This report offers a comprehensive analysis comparing the performance of digital assets, as represented by the NWST1100 index, with that of shares on global capital markets, as measured by the Dow Jones Global W1Dow index. We draw insights into historical achievements and potential future trends by examining their performances across various time frames.
Let’s break down the key observations and implications:
The recent pullback highlights a fundamental truth in crypto investing: market swings define opportunity. Historically, digital assets have significantly outperformed global equities, but their returns often occur in concentrated bursts following periods of pessimism and capitulation. Prices have fallen below the 143-day EMA, positioning the market at a technically and psychologically critical juncture. Looking ahead, sentiment-driven capitulations often create conditions for stronger rebounds, especially when paired with structural oversold signals. While caution remains warranted in the short term, current price levels could present compelling opportunities for disciplined investors preparing for the next leg in crypto’s broader market cycle.
*The box in the middle of the chart shows the original NWST1100 price; at the bottom is W1Dow
Indices Revision 2-13-2026
Following the latest biweekly revision, AINFT improved its ranking and was added to the NWSL100 index. On the other hand, the Lido DAO Token was removed from the NWSL100 index. Meanwhile, several adjustments were made to the mid-cap index (NWSM200), with new projects introduced and weaker ones removed, reflecting the ongoing dynamism of that segment. The new mid-cap assets, including HTX, Seeker, and AWE Network, have been added to the NWSM200 index. Each index’s presentation provides more details on additions and deletions across the broader 2100NEWS index family.
Winning member
Congratulations to Morpho (MORPHO) on achieving a significant milestone: being recognized as the winning member of the NWSL100 crypto index, marking a crucial leap in the ranking of index constituents.
*We elect the member of the NWSL100 crypto index with the most significant jump in our ranking. We will examine how the market rates the project’s progress in case of price changes. It seems important to us whether the project is out of the ordinary tide of crypto project prices. Peer comparisons should be efficient and effective, from an investor’s perspective
MORPHO, a large-cap Ethereum-based token, ranks 88th in the 2100NEWS ranking. It is an Index member: NWST1100, NWSL100, NWSTo100, NWSET100
2100NEWS DA Orderbook Quality Evaluation Grade: Poor, Score: 10.2, (Average for Large-caps: 17.3)
Over the past week, the average market capitalization was $583.7 million, and the average daily trading volume was $25.9 million.
Morpho is a decentralized platform that enables users to earn optimized yields and access borrowing opportunities, trustlessly and efficiently. Through Morpho Vaults, lenders can deposit assets into noncustodial vaults that maximize returns, while Morpho Markets provides borrowers with direct access to a wide range of assets. Designed for flexibility, Morpho’s permissionless infrastructure allows developers and businesses to create custom markets, curate lending vaults, and build innovative financial applications. Morpho’s immutable smart contracts and governance-minimized operations ensure a trustless and secure environment. Higher collateralization factors, improved interest rates, and low gas consumption highlight the platform’s efficiency. With permissionless market creation and risk-management features, Morpho offers a developer-friendly framework for building scalable decentralized finance (DeFi) solutions. Combining security, efficiency, and flexibility, Morpho provides a robust, resilient foundation for advancing the DeFi ecosystem.