Trade
Trading Type
Spot
Trade crypto freely
Alpha
Points
Get promising tokens in streamlined on-chain trading
Pre-Market
Trade new tokens before they are officially listed
Margin
Magnify your profit with leverage
Convert & Block Trading
0 Fees
Trade any size with no fees and no slippage
Leveraged Tokens
Get exposure to leveraged positions simply
Futures
Futures
Hundreds of contracts settled in USDT or BTC
Options
HOT
Trade European-style vanilla options
Unified Account
Maximize your capital efficiency
Demo Trading
Futures Kickoff
Get prepared for your futures trading
Futures Events
Participate in events to win generous rewards
Demo Trading
Use virtual funds to experience risk-free trading
Earn
Launch
CandyDrop
Collect candies to earn airdrops
Launchpool
Quick staking, earn potential new tokens
HODLer Airdrop
Hold GT and get massive airdrops for free
Launchpad
Be early to the next big token project
Alpha Points
NEW
Trade on-chain assets and enjoy airdrop rewards!
Futures Points
NEW
Earn futures points and claim airdrop rewards
Investment
Simple Earn
Earn interests with idle tokens
Auto-Invest
Auto-invest on a regular basis
Dual Investment
Buy low and sell high to take profits from price fluctuations
Soft Staking
Earn rewards with flexible staking
Crypto Loan
0 Fees
Pledge one crypto to borrow another
Lending Center
One-Stop Lending Hub
VIP Wealth Hub
Customized wealth management empowers your assets growth
Private Wealth Management
Customized asset management to grow your digital assets
Quant Fund
Top asset management team helps you profit without hassle
Staking
Stake cryptos to earn in PoS products
BTC Staking
HOT
Stake BTC and earn 10% APR
GUSD Minting
Use USDT/USDC to mint GUSD for treasury-level yields
More


- Trending TopicsView More
248.07K Popularity
41.36K Popularity
3.11K Popularity
6.83K Popularity
6.08K Popularity
- Hot Gate FunView More
- MC:$3.78KHolders:21.06%
- MC:$3.65KHolders:10.73%
- MC:$4.46KHolders:44.28%
- MC:$3.9KHolders:30.20%
- MC:$3.68KHolders:10.62%
- Pin
- 🔥 Gate Square Event: #PostToWinNESS 🔥
Post original content related to NESS or the ongoing HODLer Airdrop for a chance to win from a 5,000 NESS reward pool!
📅 Event Period: Dec 2 – Dec 9 16:00 UTC
📌 HODLer Airdrop Details:
https://www.gate.com/announcements/article/48445
📌 How to Participate:
1️⃣ Post original content related to NESS or the HODLer Airdrop.
2️⃣ Content must be at least 80 words.
3️⃣ Add the hashtag #PostToWinNESS
4️⃣ Screenshot of your Airdrop participation is optional.
🏆 Rewards
🥇 1st Prize (1 winner): 1,000 NESS
🥈 2nd Prize (3 winners): 800 NESS each
🥉 3rd Prize (5 - 🎉 Gate Square — Share Your Funniest Crypto Moments & Win a $100 Joy Fund!
Crypto can be stressful, so let’s laugh it out on Gate Square.
Whether it’s a liquidation tragedy, FOMO madness, or a hilarious miss—you name it.
Post your funniest crypto moment and win your share of the Joy Fund!
💰 Rewards
10 creators with the funniest posts
Each will receive $10 in tokens
📝 How to Join
1⃣️ Follow Gate_Square
2⃣️ Post with the hashtag #MyCryptoFunnyMoment
3⃣️ Any format works: memes, screenshots, short videos, personal stories, fails, chaos—bring it on.
📌 Notes
Hashtag #MyCryptoFunnyMoment is requi - 🎉 Gate Square — Share Your Funniest Crypto Moments & Win a $100 Joy Fund!
Crypto can be stressful, so let’s laugh it out on Gate Square.
Whether it’s a liquidation tragedy, FOMO madness, or a hilarious miss—you name it.
Post your funniest crypto moment and win your share of the Joy Fund!
💰 Rewards
10 creators with the funniest posts
Each will receive $10 in tokens
📝 How to Join
1⃣️ Follow Gate_Square
2⃣️ Post with the hashtag #MyCryptoFunnyMoment
3⃣️ Any format works: memes, screenshots, short videos, personal stories, fails, chaos—bring it on.
📌 Notes
Hashtag #MyCryptoFunnyMoment is requ
2100NEWS WEEKLY CRYPTO REPORT Nov-28
The crypto index NWST1100 rose 8.62% last week. Bitcoin has posted a 21.24% loss, which is less severe than the losses seen across all other segments over the previous thirty days.
*Below, we present a standardized weekly report and next week’s outlook, prepared based on the Theory Swingtum of intelligent finance. We gauge the crypto market’s breadth and direction by showing the 2100NEWS Digital Assets Total Index (NWST1100), which measures the performance of 1100 (by market capitalization) significant crypto assets. The information-laden chart is complex to read initially, but it effectively displays essential price information, key decision-making levels, momentum, trading volumes, and crypto market breadth. Monitoring Market Sentiment and Breadth is necessary to detect early signs of trend reversals or continued strength.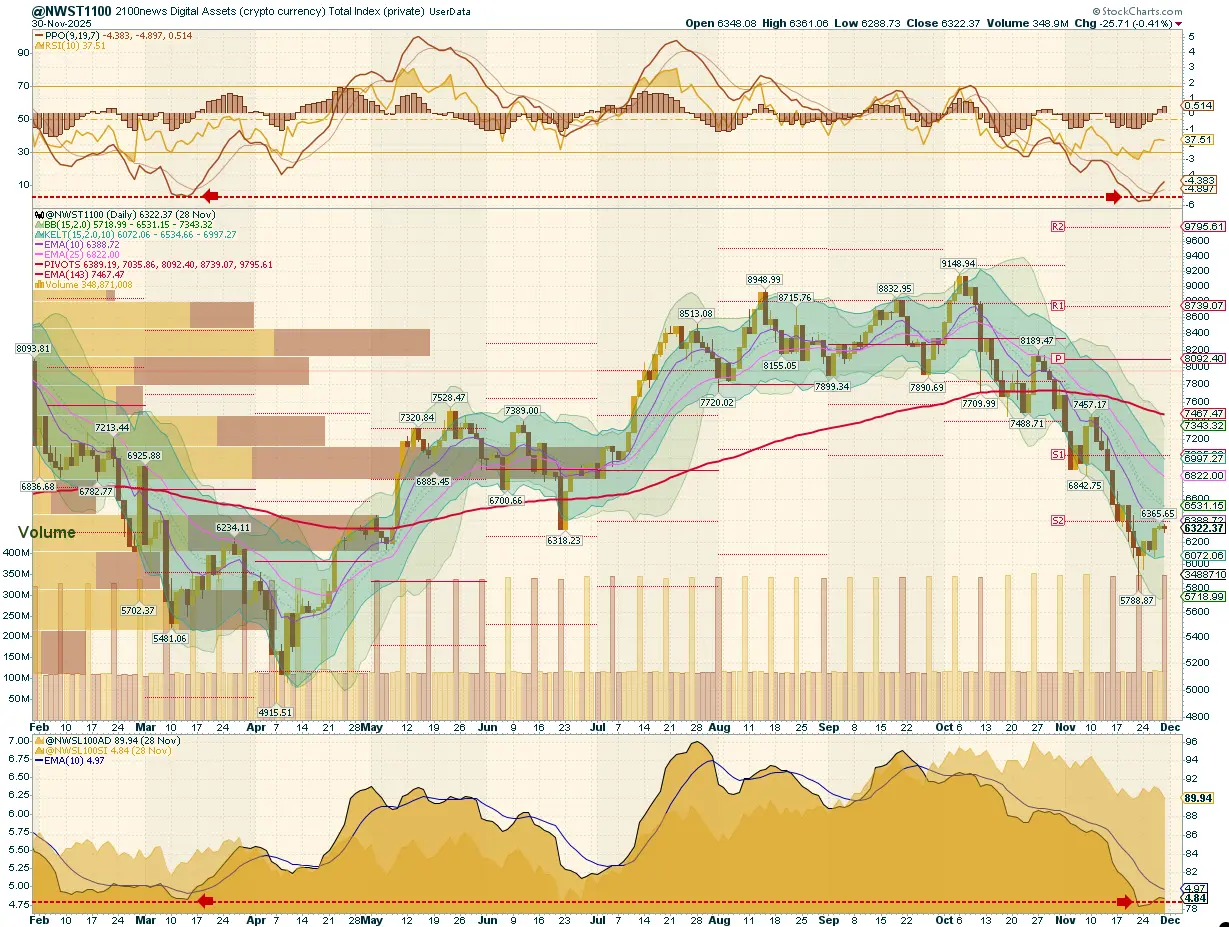
After conducting a detailed examination of the NWST1100 chart, a vital metric for the cryptocurrency market, several essential market dynamics and changes in market sentiment are revealed:
The NWST1100 index gained 8.62% over the past week, but the rebound occurred after a deep multi-week decline and failed to break the structure of the broader downtrend. While NWSBCT (large-cap blue chips) broke out of its falling wedge, the broader market merely stabilized. The shallow retracement signals a weak corrective bounce rather than the start of a new trend Intraday moves were strong at times, but the underlying structure remained fragile. The Thanksgiving-week session likely benefitted from temporary institutional flow: enough buying to prevent deeper declines and produce a more constructive holiday backdrop, but not enough to establish real trend conviction. As a result, conditions improved modestly, with many oversold indicators lifting from extremes, but no decisive shift toward a new cycle emerged.
Market Sentiment (PPO & RSI): The PPO lines have remained negative, and although the histogram ticked higher, it stayed near the zero line—consistent with stalling downward momentum, not a reversal.
The RSI rebounded from oversold conditions but stalled below neutral (around 37), confirming a lack of strength behind the bounce.
Crypto Market Breadth indicators: The Advance-Decline Volume Line (ADVL), adapted by 2100News for the crypto market as ADVPL, tracks the net money volume of advancing versus declining digital assets. It shows continued deterioration in net money flow. The McClellan Summation Index, a long-term version of the McClellan Oscillator that measures market breadth, stabilized but remains near cyclical lows (red arrow), indicating breadth has not turned sustainably upward.
According to the chart on the right, all A50R indicators across the major segments (NWST1100, NWSET100, NWSL100, NWSCo100) have remained oversold, though slightly improved from extreme readings. This confirms the rebound was triggered by capitulation, but not yet supported by broad participation. Only 7-9% of constituents across major segments remain above their 50-day EMAs.
This breadth indicator measures the percentage of digital assets trading above a 50-day moving average
* The percentage of digital assets trading above a specific moving average is a breadth indicator that measures internal strength or weakness in the underlying index. The chart on the right side compares the percentage of DA trading above the 50-day EMA for:
📉 Summary
In Summary, despite a week of relief and several sharp intraday rallies, the crypto market remains in a corrective phase. Momentum is stabilizing but still weak, breadth is deeply oversold, and the NWST1100 rebound lacks structural depth, reaching only minor retracement levels. Early improvements appear tactical rather than foundational, and leadership remains narrow—centered primarily in NWSBCT. The market has transitioned from aggressive selling into tentative stabilization, not a confirmed trend reversal.
Outlook for this week
This report examines the cryptocurrency market’s short-term outlook, identifying patterns and signals that may offer insights into potential market direction. While predicting market behavior is inherently uncertain, discernible trends in momentum and market breadth indicators suggest possible developments.
📌 Target and Scenario Considerations:
Most likely scenario: The NWST1100 is expected to retest the recent double-bottom region before extending toward the 0.382 Fibonacci retracement and challenging Pivot P. Such a move would remain corrective rather than impulsive but would meaningfully reduce downside pressure. This path aligns with the gradual improvement in the PPO histogram and would likely produce a sequence of higher lows, consistent with an early base-building phase. A controlled rebound toward Pivot P (~6,600) appears probable. Should the index achieve sustained closes above Pivot P, the probability of a developing recovery phase would increase significantly, shifting the market from stabilization into constructive early-trend territory Overall, the market is likely transitioning from capitulation to stabilization. Sentiment remains fragile, but the combination of technical exhaustion, breadth stabilization, and favorable seasonal tendencies supports the view that the most acute phase of the correction may be behind us—setting the stage for a more constructive December.📍 Key Levels to Watch:
Performance of different groups of Digital Assets (Coins and Tokens)
Investors and traders rely on historical performance data to contextualize short-term moves and assess the relative strength of different market segments. The latest table shows that all categories experienced a technical relief rebound following heavy liquidation, with the NWST1100 index advancing 8.62% over the past week.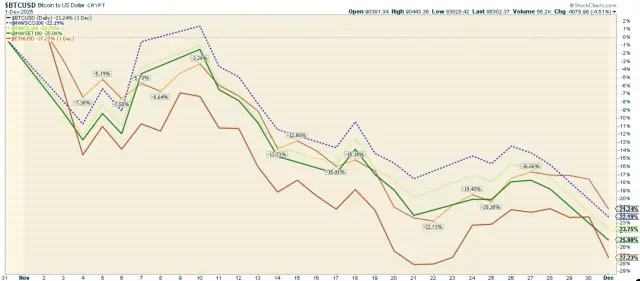 The chart above highlights the performance of various cryptocurrencies, including Bitcoin, Ether, and the 2100NEWS Indices, which represent Ethereum-based tokens (NWSET100), large caps (NWSL100), and Coins (NWSCo100). Among these, Bitcoin was the strongest performer over the past 30 days, declining 21.24%, which is less severe than the losses seen across all other segments. Ether and the index groups fell more sharply, placing Bitcoin at the top of the relative strength spectrum for the month.
While the broader market has trended sideways, different segments and individual cryptocurrencies exhibit different performance dynamics.
Performance Trends by Market Segment:
✔ NWSL100 (Large Caps)led the market,
✔ NWS30, NWSET100 (Ethereum-based tokens), and Ether have been improving.
✔ NWSCo100 (Coins) weakened.
✔ Bitcoin and NWSBE lagged.
Investors and traders might use this information to adjust their portfolios, possibly shifting focus toward assets with stronger relative momentum while being cautious about those in the Weakening quadrant.
*RRG® charts show the relative strength and momentum of groups of digital assets. Those with strong relative strength and momentum appear in the green Leading quadrant. As relative momentum fades, they typically move into the yellow Weakening quadrant. If relative strength then fades, they move into the red Lagging quadrant. Finally, when momentum picks up again, they shift into the blue Improving quadrant.
Crypto (Digital Assets) compared with global equity
This report offers a comprehensive analysis comparing the performance of digital assets, as measured by the NWST1100 index, to that of shares on global capital markets, as represented by the Dow Jones Global W1Dow index. The comparison spans multiple timeframes, providing insights into historical and recent performances and potential future trends.
Let’s break down the key observations and implications:
The recent pullback highlights a fundamental truth in crypto investing: market swings define opportunity. Historically, digital assets have significantly outperformed global equities, but their returns often come in concentrated bursts that follow periods of pessimism and capitulation. Prices have fallen below the 143-day EMA, positioning the market at a technically and psychologically critical juncture. Looking ahead, sentiment-driven capitulations often create conditions for stronger rebounds, especially when paired with structural oversold signals. While caution remains warranted in the short term, current price levels could present compelling opportunities for disciplined investors preparing for the next leg in crypto’s broader market cycle.
*The box in the middle of the chart shows the original NWST1100 price; at the bottom is W1Dow