Trade
Trading Type
Spot
Trade crypto freely
Pre-Market
Trade new tokens before they are officially listed
Margin
Magnify your profit with leverage
Convert & Block Trading
0 Fees
Trade any size with no fees and no slippage
Alpha
Points
Get promising tokens in streamlined on-chain trading
Leveraged Tokens
Get exposure to leveraged positions simply
Futures
Futures
Hundreds of contracts settled in USDT or BTC
Options
HOT
Trade European-style vanilla options
Unified Account
Maximize your capital efficiency
Demo Trading
Futures Kickoff
Get prepared for your futures trading
Futures Events
Participate in events to win generous rewards
Demo Trading
Use virtual funds to experience risk-free trading
Earn
Launch
CandyDrop
Collect candies to earn airdrops
Launchpool
Quick staking, earn potential new tokens
HODLer Airdrop
Hold GT and get massive airdrops for free
Launchpad
Be early to the next big token project
Alpha Points
NEW
Trade on-chain assets and enjoy airdrop rewards!
Futures Points
NEW
Earn futures points and claim airdrop rewards
Investment
Simple Earn
Earn interests with idle tokens
Auto-Invest
Auto-invest on a regular basis
Dual Investment
Buy low and sell high to take profits from price fluctuations
Soft Staking
Earn rewards with flexible staking
Crypto Loan
0 Fees
Pledge one crypto to borrow another
Lending Center
One-stop lending hub
VIP Wealth Hub
Customized wealth management empowers your assets growth
Private Wealth Management
Customized asset management to grow your digital assets
Quant Fund
Top asset management team helps you profit without hassle
Staking
Stake cryptos to earn in PoS products
BTC Staking
HOT
Stake BTC and earn 10% APR
GUSD Minting
Use USDT/USDC to mint GUSD for treasury-level yields
More
Promotions
Activity Center
Join activities and win big cash prizes and exclusive merch
Referral
20 USDT
Earn 40% commission or up to 500 USDT rewards
Announcements
Announcements of new listings, activities, upgrades, etc
Gate Blog
Crypto industry articles
VIP Services
Huge fee discounts
Proof of Reserves
Gate promises 100% proof of reserves
# BTC
37.57M
BeautifulDay
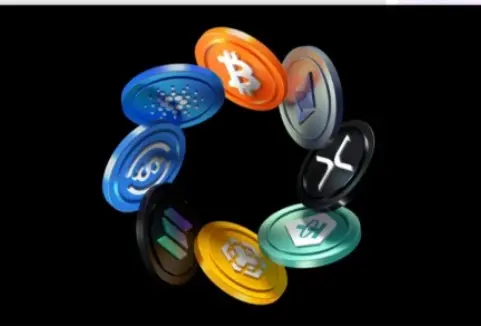
🔥 Crypto Asset Popularity Rankings | Market Snapshot 🔥
Crypto market sentiment is shifting fast, and investor attention is currently focused on a few key assets 👇
📊 Top Trending Crypto Assets:
🔹 Bitcoin (BTC) – Market leader with strong institutional confidence
🔹 Ethereum (ETH) – Rising on DeFi growth, ETF expectations, and strong on-chain activity
🔹 Solana (SOL) – Gaining traction due to high-speed performance and expanding adoption
🔹 XRP – Back in focus with cross-border payment use cases and regulatory developments
🔹 AI & Meme Tokens – High-volatility plays attracting short-term tr

- Reward
- 1
- 2
- Repost
- Share
HighAmbition :
:
Christmas to the Moon! 🌕View More
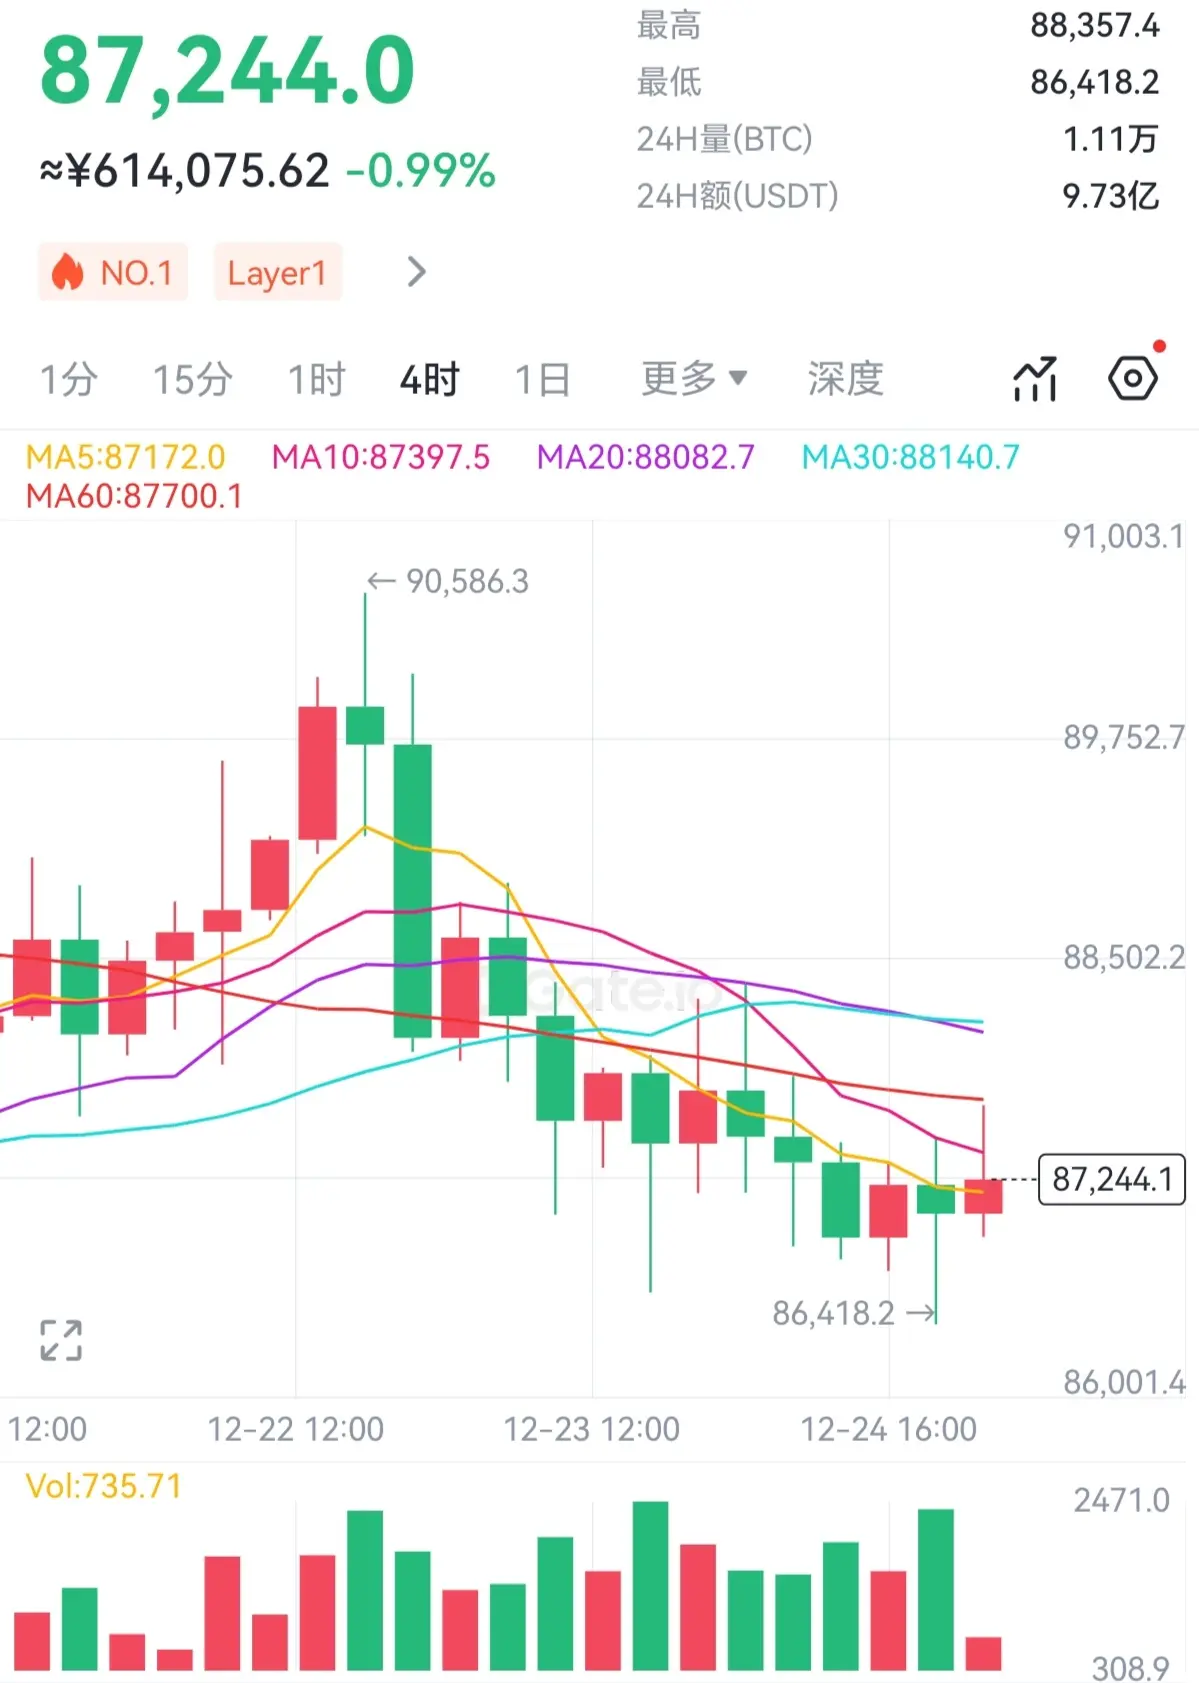
12.25 Wednesday Bitcoin and Ethereum Early Morning Analysis
In the current market situation, the 4-hour analysis indicates that Bitcoin remains in a downtrend channel, continuously testing new lows. Although bulls have attempted to intervene to break this trend, overall momentum is insufficient, and the rebound after intervention can only be seen as a correction to the ongoing decline, providing the market with a temporary buffer. Currently, the Bollinger Bands are expanding, with the middle and lower bands continuing to decline. The short-term market shows a pattern of two bearish candles san
View OriginalIn the current market situation, the 4-hour analysis indicates that Bitcoin remains in a downtrend channel, continuously testing new lows. Although bulls have attempted to intervene to break this trend, overall momentum is insufficient, and the rebound after intervention can only be seen as a correction to the ongoing decline, providing the market with a temporary buffer. Currently, the Bollinger Bands are expanding, with the middle and lower bands continuing to decline. The short-term market shows a pattern of two bearish candles san
- Reward
- 6
- Comment
- Repost
- Share
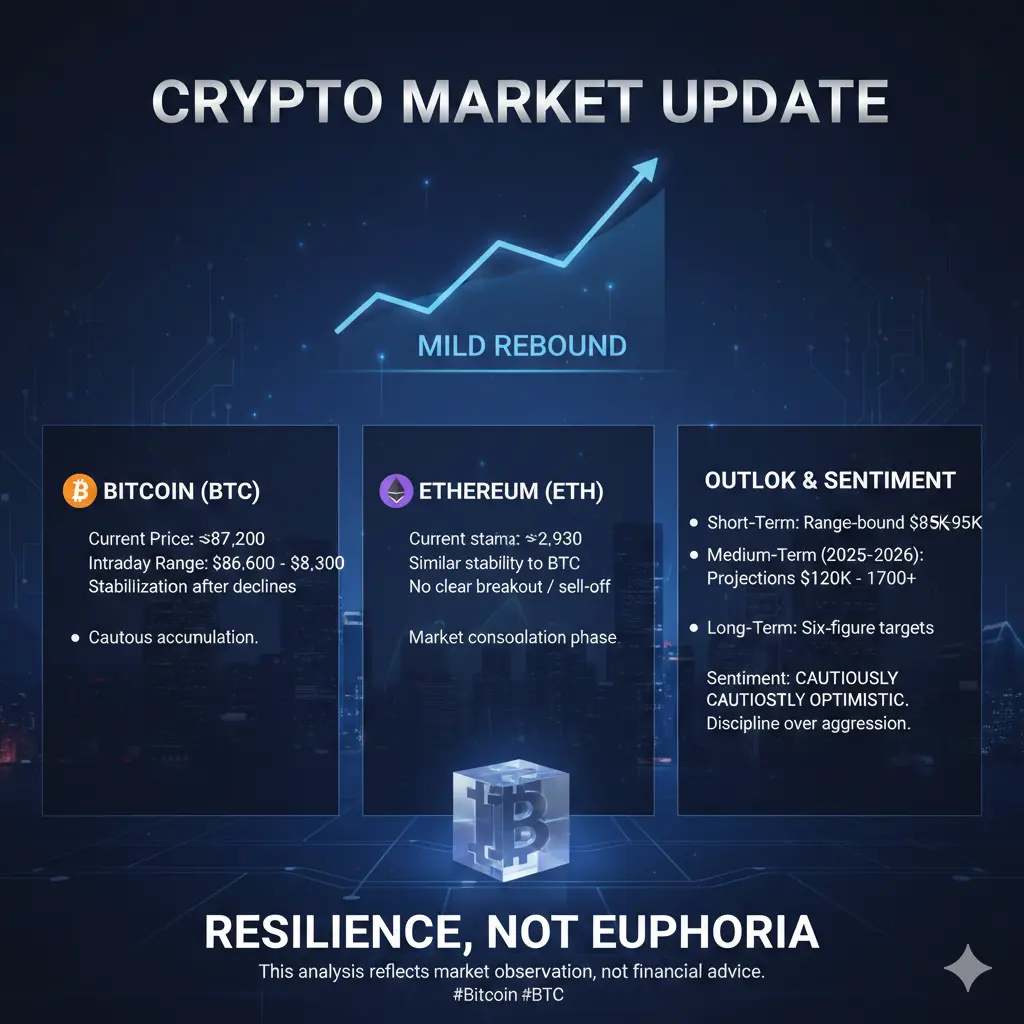
#CryptoMarketMildlyRebounds
The crypto market is showing early signs of stabilization after a period of weakness, but the current recovery should be understood as controlled and selective rather than impulsive or trend-defining. Price action across major assets suggests that selling pressure has eased, yet conviction on the upside remains limited.
Bitcoin (BTC) – Current Structure
Bitcoin is trading near $87,200, maintaining a slight upward bias after recent declines. Intraday price movement has remained contained within the $86,600–$88,300 range, highlighting a market that is active but caut
- Reward
- 14
- 13
- Repost
- Share
BabaJi:
Merry Christmas ⛄View More
Bitcoin Latest Market Analysis + Support and Resistance Levels Sharing!!! #BTC $BTC
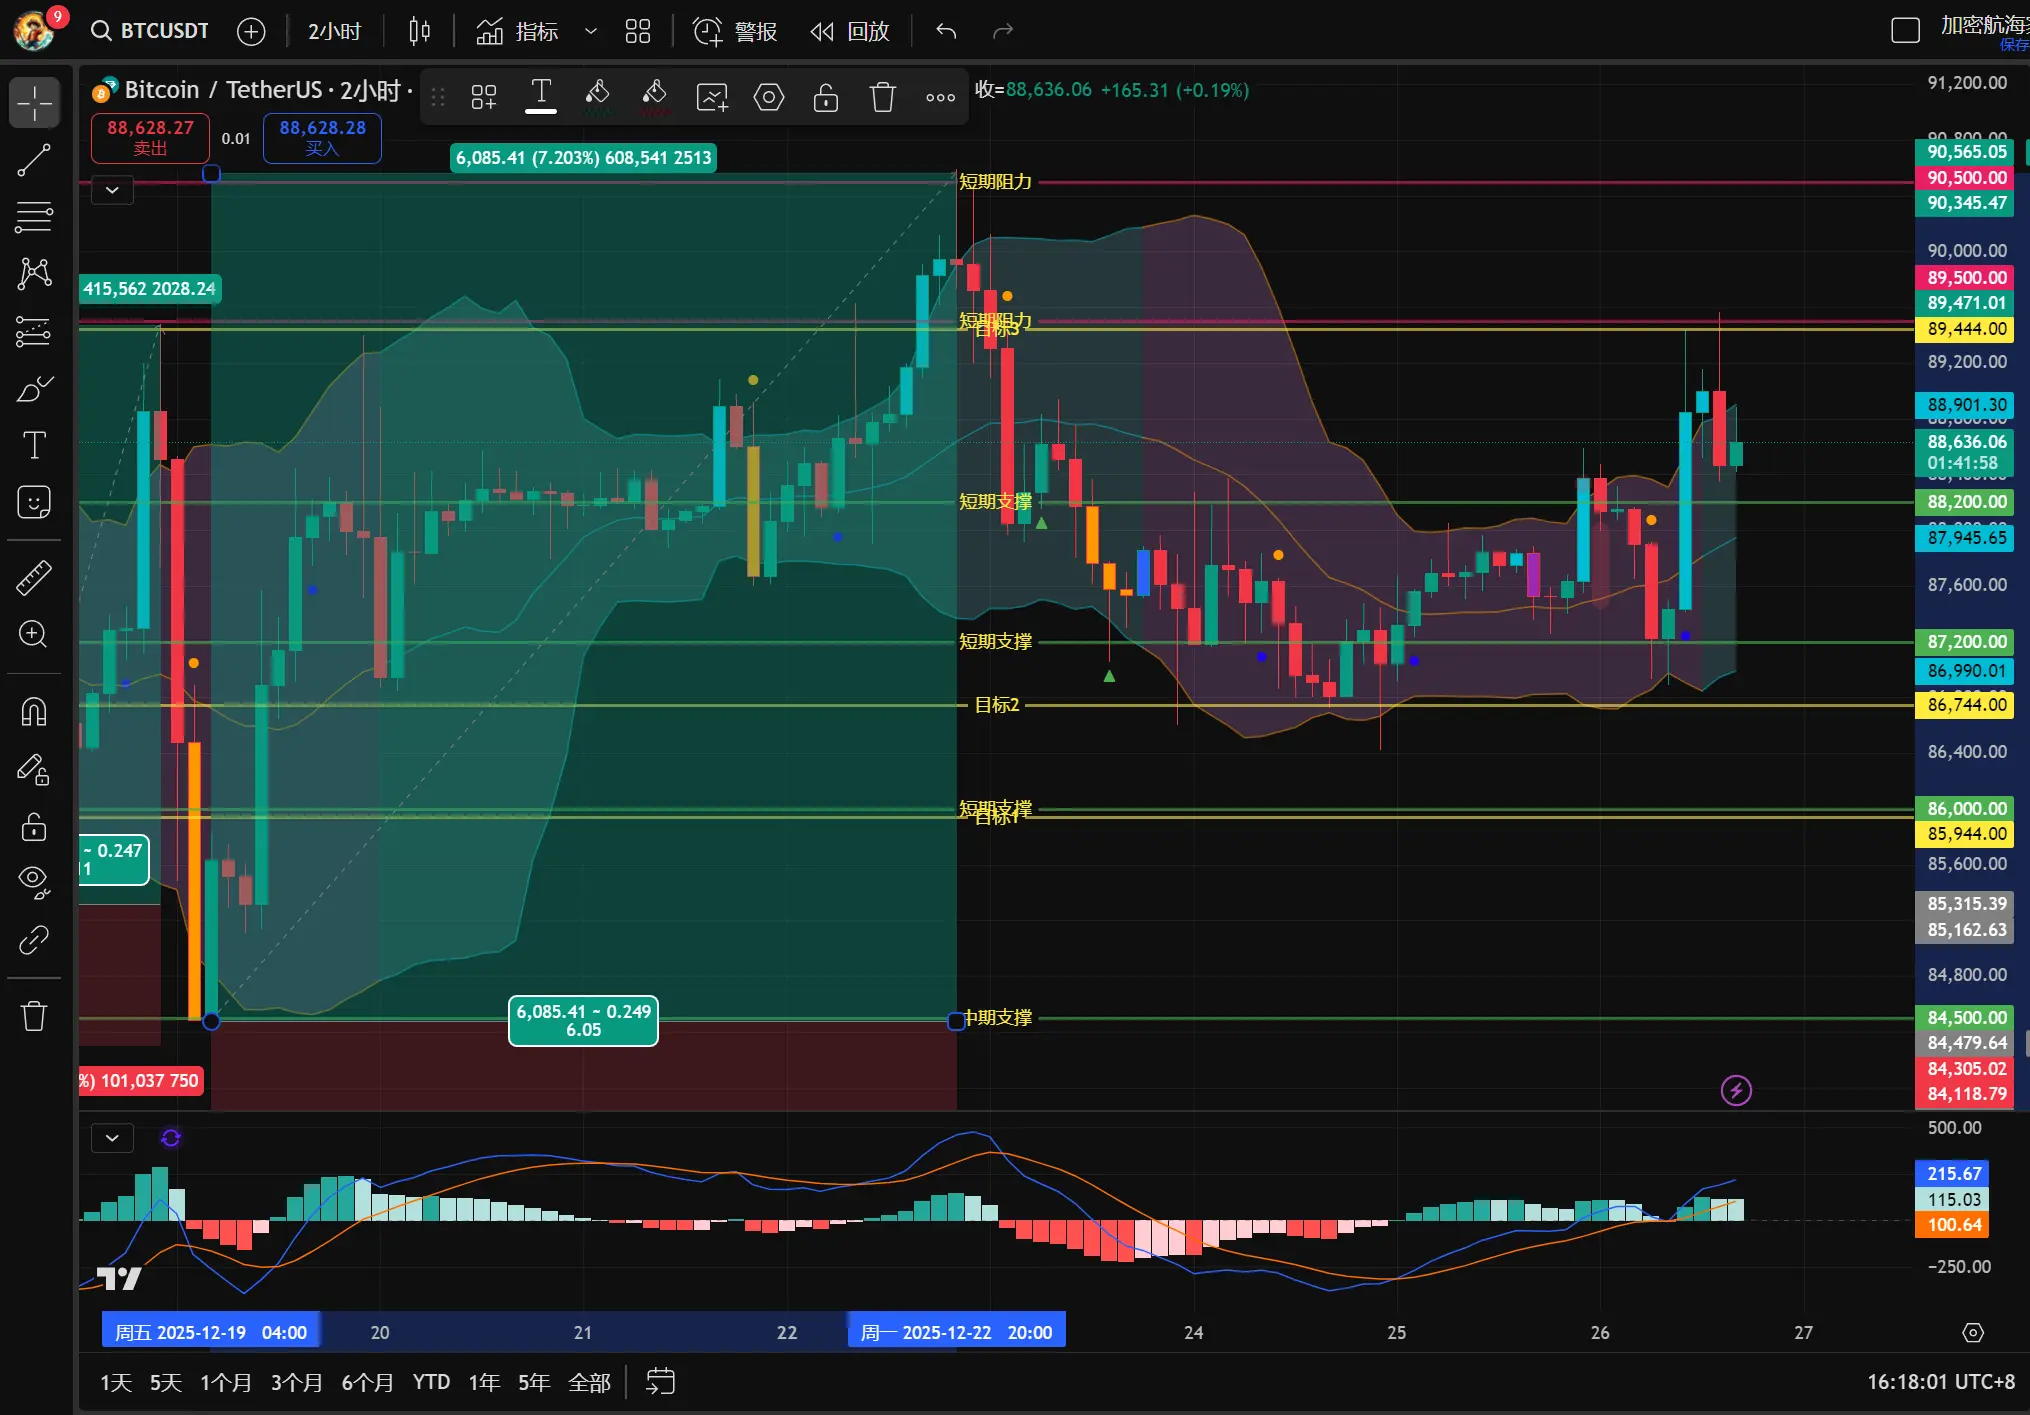
🎄 Holiday Market Analysis: Breakout from the Range, Bulls Attempting to Return
Latest Situation:
Breakout Confirmation: Compared to yesterday’s “dead water ripple,” BTC finally chose a direction during today’s Asian trading session, with a volume breakout of the strong resistance zone at 88,000 - 88,200. It is now stabilizing around 88,600.
Holiday Effect: Today is Boxing Day, and although markets in the UK, Australia, and Hong Kong remain closed, some European and US (futures) markets are beginning to reopen
BTC-1.3%
- Reward
- 3
- Comment
- Repost
- Share
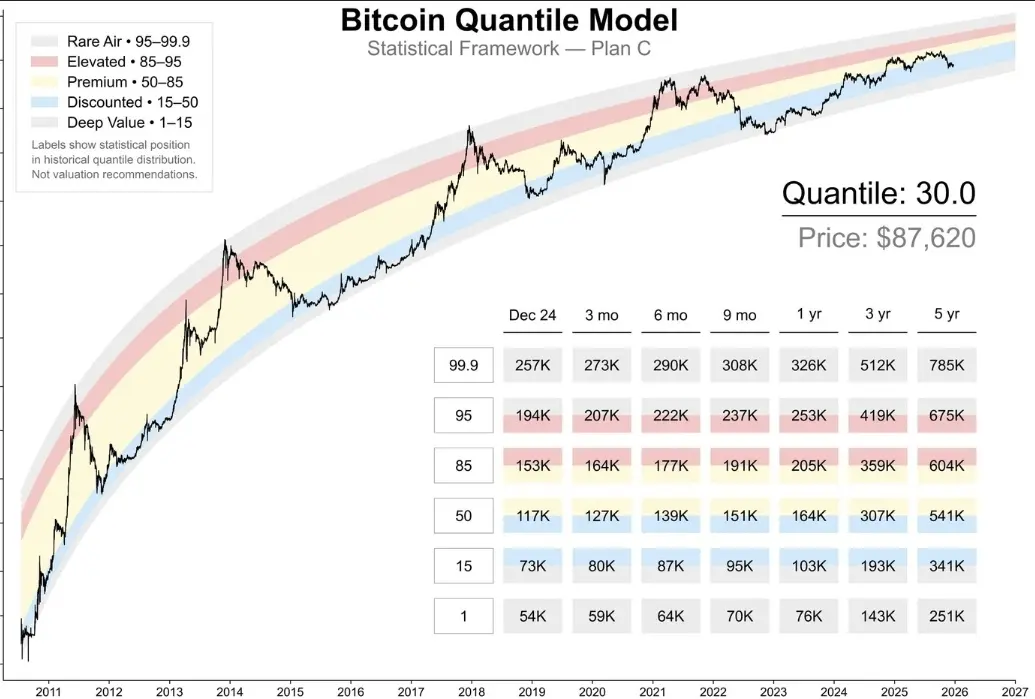
📊 #BTC Discount Zone Imminent: Quantity Model Update
Price: $88,740
Data Points: 135,314
Quantity Level: 30/100
Historically, the price of #البيتكوين has increased by 70% within this price range and decreased by only 30%.
This indicates that current levels represent a discount zone with greater profit potential for new investors.
🚀 Risk-to-Reward Ratio Appears Favorable. The price is low compared to historical values.
#AAVE #Bitcoin
#USGDPUpdate
$BTC
$ETH
View OriginalPrice: $88,740
Data Points: 135,314
Quantity Level: 30/100
Historically, the price of #البيتكوين has increased by 70% within this price range and decreased by only 30%.
This indicates that current levels represent a discount zone with greater profit potential for new investors.
🚀 Risk-to-Reward Ratio Appears Favorable. The price is low compared to historical values.
#AAVE #Bitcoin
#USGDPUpdate
$BTC
$ETH
- Reward
- 1
- 1
- Repost
- Share
BasheerAlgundubi:
🚀 The risk-to-reward ratio looks favorable. The price is low compared to historical values.Bitcoin Latest Market Analysis + Support and Resistance Levels Sharing!!! #BTC $BTC
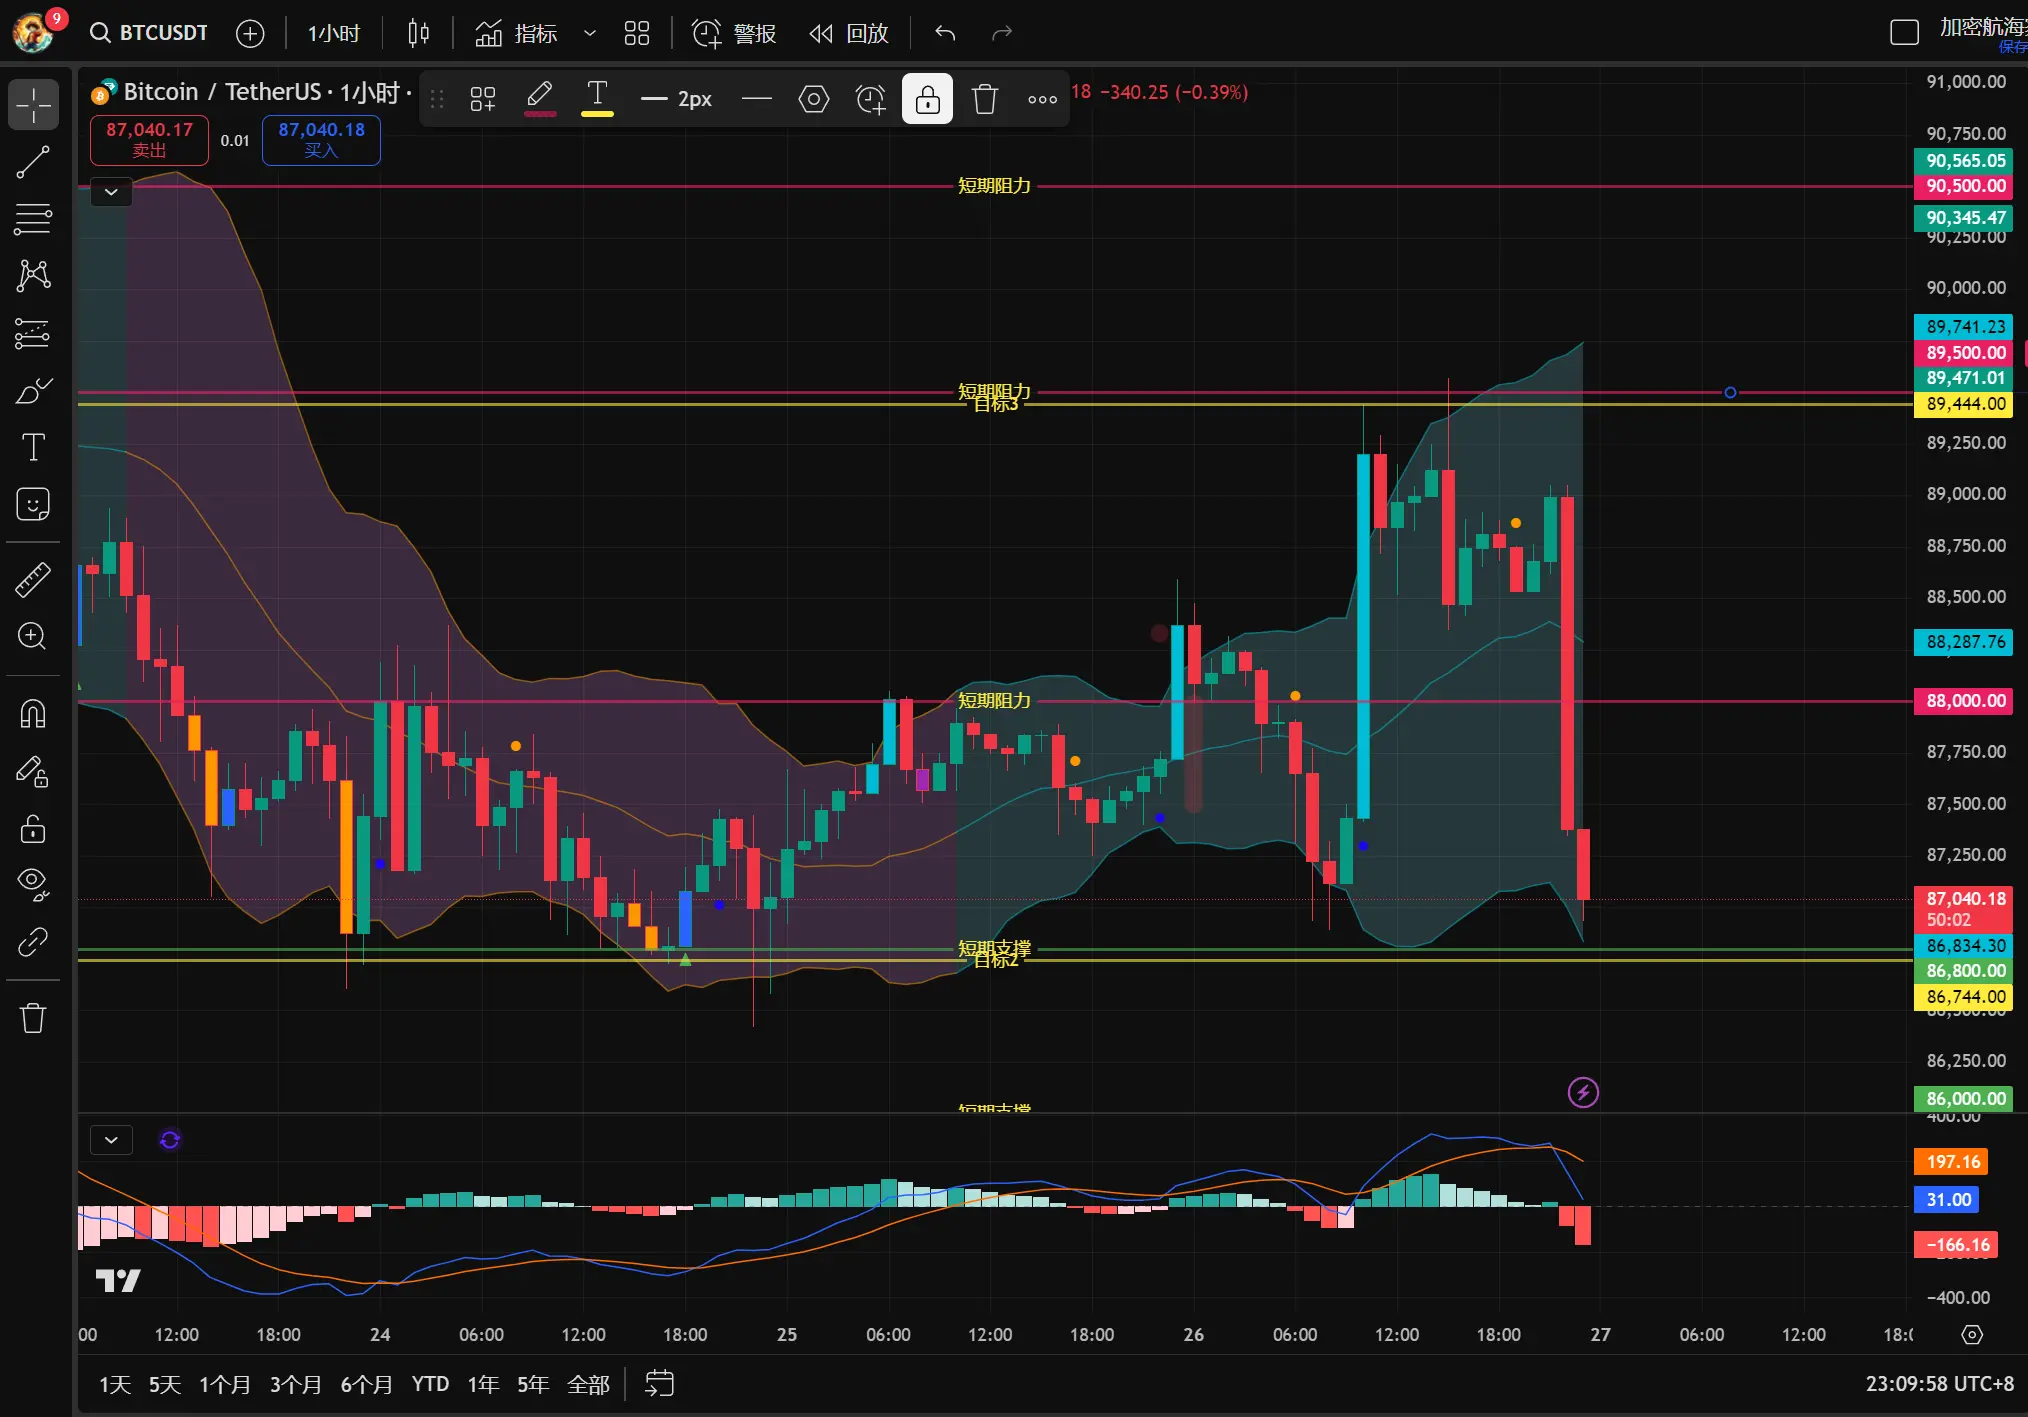
🚨 Urgent Market Qualification: Fake breakout confirmed, 88,000 regained and lost
Latest Situation:
Bullish Collapse: During our analysis this afternoon, BTC temporarily broke through 88,000 and rose above 88,600, seeming to have a very good outlook. But in the past few hours, BTC failed to hold the gains, quickly fell back and effectively broke through the key support level of 88,000.
Pattern Analysis: The daily chart shows a long upper shadow, confirming that the intraday breakout was a “Fakeout.” The curren
BTC-1.3%
- Reward
- 1
- 1
- Repost
- Share
Superbox :
:
If it doesn't drop, you won't say anything either. What's the use?$BTC BTC is approaching the decision point
Recently, BTC has been trapped within a very narrow range, repeatedly oscillating.
On the surface, it looks like sideways trading, but in reality, it's intense turnover.
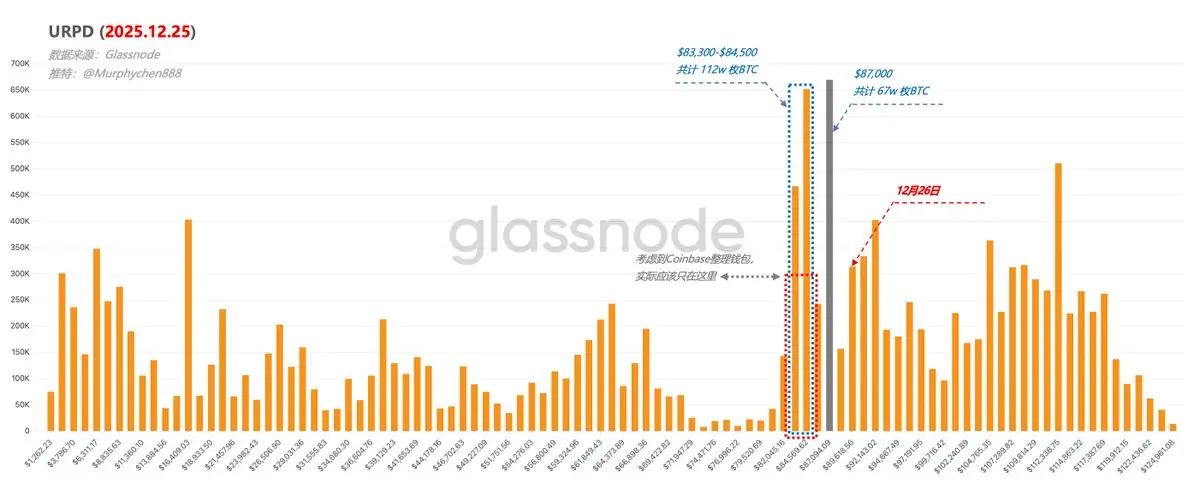
From the UTXO / chip distribution perspective, there are currently two exceptionally prominent massive columns:
Around $87,000: approximately 670,000 BTC
Around $84,500: approximately 650,000 BTC
The chip density in these two price ranges is clearly higher than in any other interval.
It is necessary to first eliminate "false chips"
Here is a factor that must be excluded.
On November 2
Recently, BTC has been trapped within a very narrow range, repeatedly oscillating.
On the surface, it looks like sideways trading, but in reality, it's intense turnover.
From the UTXO / chip distribution perspective, there are currently two exceptionally prominent massive columns:
Around $87,000: approximately 670,000 BTC
Around $84,500: approximately 650,000 BTC
The chip density in these two price ranges is clearly higher than in any other interval.
It is necessary to first eliminate "false chips"
Here is a factor that must be excluded.
On November 2
BTC-1.3%
- Reward
- 4
- 1
- Repost
- Share
CryptoSpecto:
good information 🧑🎄$BTC UPDATE
------------------
Bitcoin is showing early signs of a bullish reversal as it attempts to break out of the descending triangle, a pattern that typically reflects prolonged selling pressure. This breakout indicates that sellers may be losing control and buyers are beginning to step in with stronger momentum.
For a solid bullish confirmation, BTC needs a candle close above the triangle. However, failure to hold above the triangle could result in a fake breakout and renewed consolidation. Until confirmation is achieved, price action around the breakout zone remains critical to watch.
BTC-1.3%


- Reward
- 1
- 1
- Repost
- Share
GateUser-9a01c836:
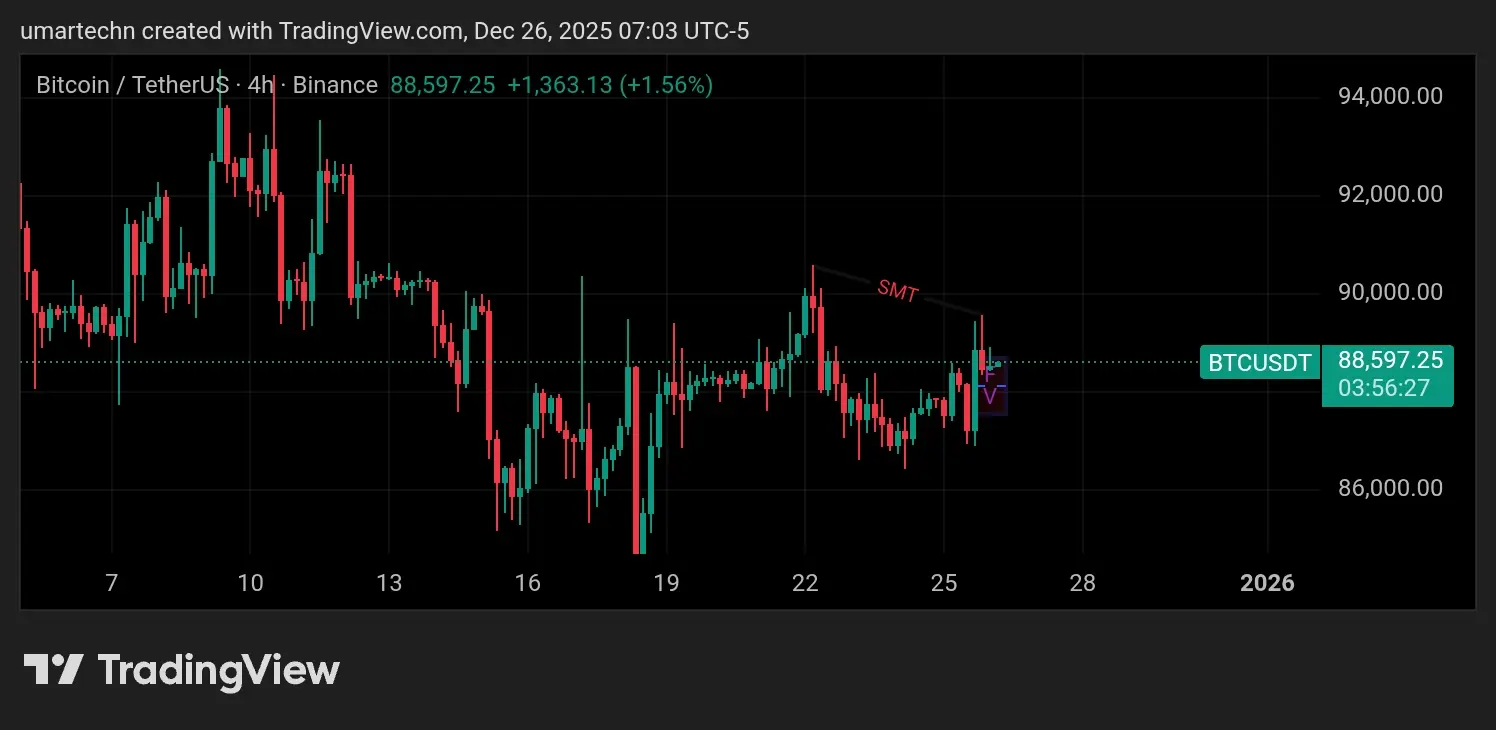
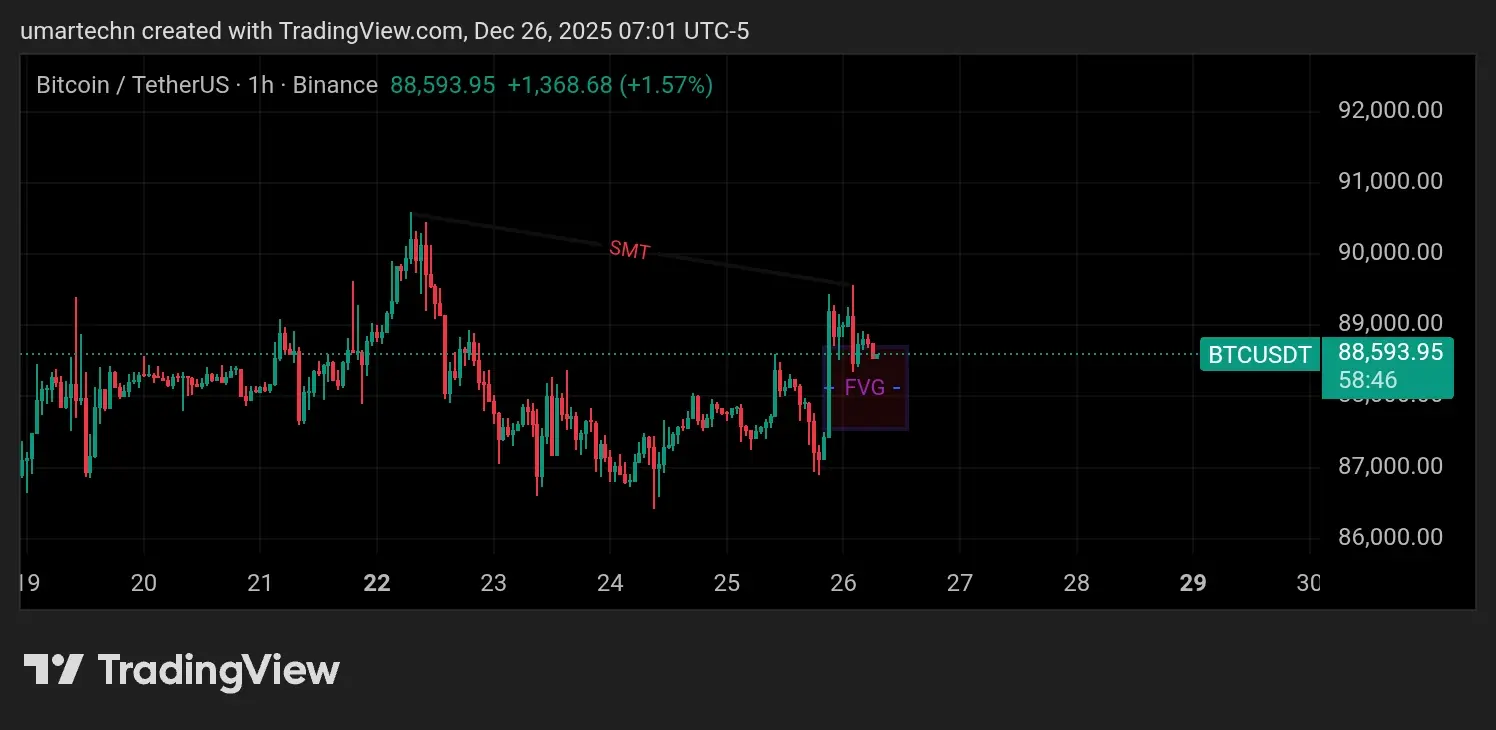
1000x VIbes 🤑BTCUSDT – 1H Technical Analysis:
Bitcoin is trading around 88,500 – 89,000, a key intraday resistance zone.
Price recently formed a Higher Low, indicating short-term bullish structure.
The impulsive move up left a Fair Value Gap (FVG) below price, which may act as a retracement target.
There is a visible Bearish SMT divergence, suggesting weakening momentum.
Rejection from 89,500 – 90,000 could lead to a pullback toward 87,800 – 88,000.
Holding above 88,000 keeps bullish continuation valid.
A clean break and close above 90,000 opens the path toward 91,500+.
Volume confirms participation but no
BTC-1.3%
- Reward
- 2
- Comment
- Repost
- Share
Load More
Join 40M users in our growing community
⚡️ Join 40M users in the crypto craze discussion
💬 Engage with your favorite top creators
👍 See what interests you
Trending Topics
111.99K Popularity
62.04K Popularity
31.75K Popularity
488 Popularity
11.73K Popularity
7.06K Popularity
7.66K Popularity
13.88K Popularity
85.06K Popularity
10.84K Popularity
203.1K Popularity
1.9K Popularity
6.87K Popularity
131 Popularity
215.12K Popularity
News
View MoreDanish Tax Minister criticizes Polymarket for political and war betting, may consider restricting its operations in Denmark
1 m
2025 Blockchain Revenue Rankings: Solana leads with $1.3 billion, followed by Hyperliquid and Tron in second and third place
3 m
The US 2026 crypto regulatory landscape may see a turning point as the SEC and CFTC deepen collaboration
29 m
2026 US Cryptocurrency Regulation Outlook: SEC Advances Reforms, CFTC Gains Influence
32 m
ABN AMRO Bank obtains EU MiCAR authorization and completes its first international smart derivative contract transaction
1 h
Pin
🎉 Share Your 2025 Year-End Summary & Win $10,000 Sharing Rewards!
Reflect on your year with Gate and share your report on Square for a chance to win $10,000!
👇 How to Join:
1️⃣ Click to check your Year-End Summary: https://www.gate.com/competition/your-year-in-review-2025
2️⃣ After viewing, share it on social media or Gate Square using the "Share" button
3️⃣ Invite friends to like, comment, and share. More interactions, higher chances of winning!
🎁 Generous Prizes:
1️⃣ Daily Lucky Winner: 1 winner per day gets $30 GT, a branded hoodie, and a Gate × Red Bull tumbler
2️⃣ Lucky Share Draw: 10🔥 Gate Square Event | #PostToWinLaunchpadKDK 🔥
KDK | The latest Gate Launchpad spotlight token
Before: stake USDT to join
Now 👉 just post for a chance to win KDK!
🎁 Gate Square exclusive: 2,000 KDK total rewards up for grabs
🚀 Launchpad star project — big potential ahead 👀
📅 Event Duration
Dec 19, 04:00 – Dec 30, 16:00 (UTC)
📌 How to Join
Post on Gate Square (text, images, analysis, or opinions)
Content should relate to KDK price predictions at launch, project insights, or your understanding of the Gate Launchpad mechanism
Add one hashtag: #发帖赢Launchpad新币KDK 或 #PostToWinLaunchpadKDK
�🎨 Gate AI Creation Contest | One Sentence, Draw Your 2026
On Gate Square, anyone can be a visual creator — truly zero barriers to entry.
With just one sentence, generate an image and bring your vision of 2026 to life.
Create and post your work using Gate Square AI Creation for a chance to win the Gate Year of the Horse New Year Gift Box.
📅 Duration
Dec 17, 2025, 10:00 – Jan 3, 2026, 18:00 UTC
🎯 How to Join
1. Go to Gate Square → Create Post → AI Creation
2. Enter one sentence to generate your image
3. Post with #GateAICreation
🏆 Rewards
5 winners: Gate Year of the Horse New Year