Trade
Basic
Futures
Futures
Hundreds of contracts settled in USDT or BTC
TradFi
Gold
Trade global traditional assets with USDT in one place
Options
Hot
Trade European-style vanilla options
Unified Account
Maximize your capital efficiency
Demo Trading
Futures Kickoff
Get prepared for your futures trading
Futures Events
Participate in events to win generous rewards
Demo Trading
Use virtual funds to experience risk-free trading
Earn
Launch
CandyDrop
Collect candies to earn airdrops
Launchpool
Quick staking, earn potential new tokens
HODLer Airdrop
Hold GT and get massive airdrops for free
Launchpad
Be early to the next big token project
Alpha Points
New
Trade on-chain assets and enjoy airdrop rewards!
Futures Points
New
Earn futures points and claim airdrop rewards
Investment
Simple Earn
Earn interests with idle tokens
Auto-Invest
Auto-invest on a regular basis
Dual Investment
Buy low and sell high to take profits from price fluctuations
Soft Staking
Earn rewards with flexible staking
Crypto Loan
0 Fees
Pledge one crypto to borrow another
Lending Center
One-stop lending hub
VIP Wealth Hub
Customized wealth management empowers your assets growth
Private Wealth Management
Customized asset management to grow your digital assets
Quant Fund
Top asset management team helps you profit without hassle
Staking
Stake cryptos to earn in PoS products
Smart Leverage
New
No forced liquidation before maturity, worry-free leveraged gains
GUSD Minting
Use USDT/USDC to mint GUSD for treasury-level yields
More
PrimeMinisterLiu
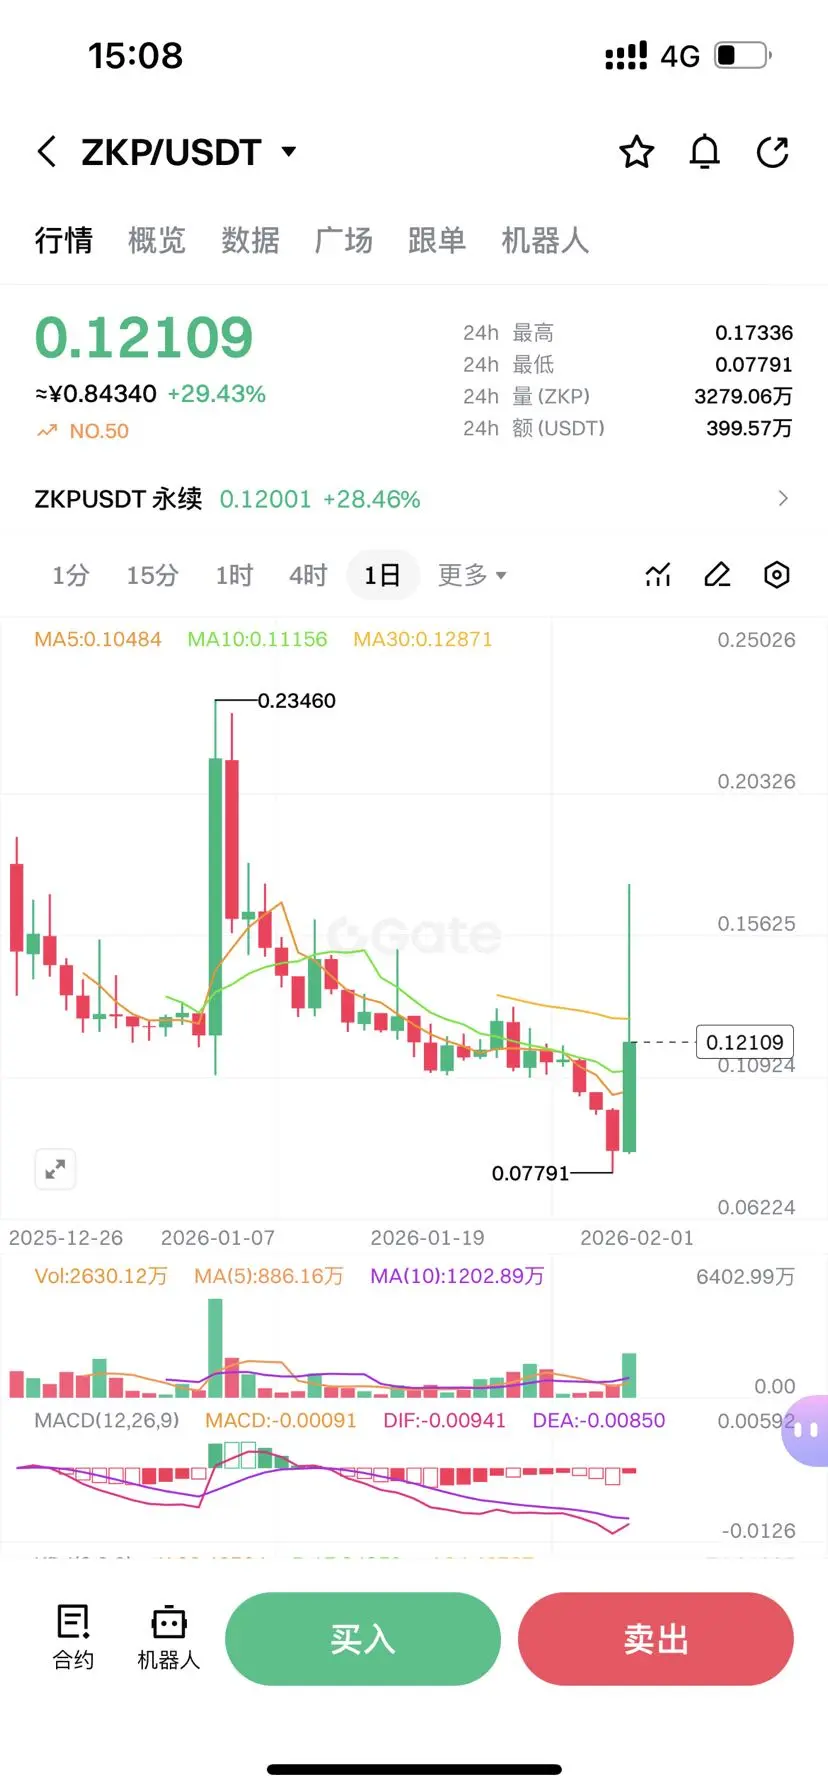
The overall market sentiment has been low recently, with the main index showing weakness and many mainstream coins following the correction. Yet, at such times, some obscure altcoins you've barely heard of suddenly start to "perform countertrend," suddenly surging, skyrocketing dozens of points in a short period, almost making headlines on the top gainers list—ZKP is a recent eye-catching example.
Look at the data: ZKP shot up from a low point within a day, with a maximum increase of over 31%, trading volume soared to over 200 million, and transaction volume also exceeded 20 million USD. On th
Look at the data: ZKP shot up from a low point within a day, with a maximum increase of over 31%, trading volume soared to over 200 million, and transaction volume also exceeded 20 million USD. On th
ZKP30.48%
- Reward
- 1
- Comment
- Repost
- Share
- Reward
- like
- Comment
- Repost
- Share
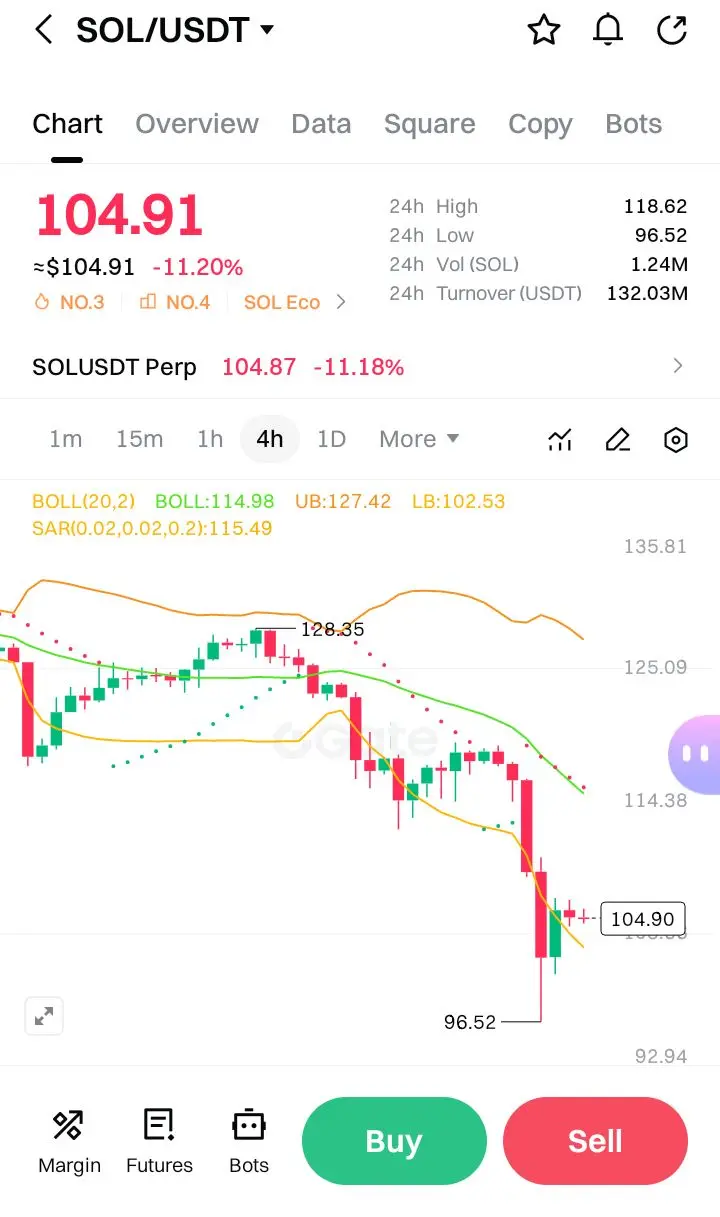
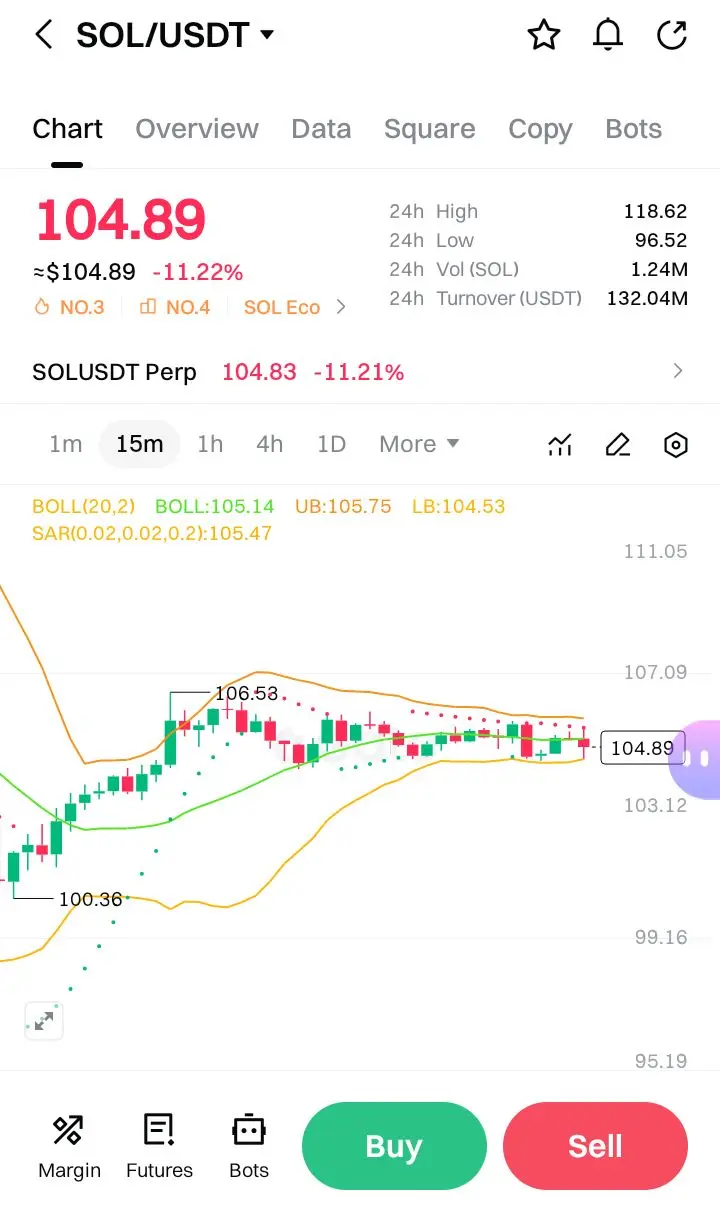
#MyWeekendTradingPlan $SOL Based SOL/USDT chart, I can perform a technical analysis using the concepts outlined: Impulse, Fibonacci Retracement, OTE Zone, Confluence, and Lower-Timeframe Confirmation.
Step 1: Identify Displacement (Impulse)
From the Chart, I can identify a clear downward impulse:
· High (start of impulse): ~111.05 USDT
· Low (end of impulse): ~95.19 USDT
This is a sharp decline that qualifies as a displacement move.
Step 2: Draw Fibonacci Retracement (0% → 100%)
Using the impulse high and low:
· 0%: 111.05 (start of impulse)
· 100%: 95.19 (end of impulse)
Key Fibonacci l
SOL-11.61%
- Reward
- 1
- Comment
- Repost
- Share
ZAZA
ZAZA
Created By@椤琐厴嘘
Listing Progress
0.00%
MC:
$2.94K
Create My Token
iggcgixfufxighohovhohigxgiiggcihohhvjvjggigigxgiggcycigcgicojvhuciggchcohhchoccohchc
- Reward
- like
- Comment
- Repost
- Share
No compassion in the world, no great compassion in the same body!
With no fate, great kindness cannot be achieved; with no connection, great compassion cannot be realized!
View OriginalWith no fate, great kindness cannot be achieved; with no connection, great compassion cannot be realized!


- Reward
- 1
- Comment
- Repost
- Share
#CryptoRegulationNewProgress
The global crypto market is entering a new phase as regulators around the world make meaningful progress toward clearer, more structured frameworks
. For years, digital assets operated in a regulatory gray zone, creating uncertainty for investors, developers, and institutions. Recent developments suggest that this era is slowly coming to an end, with governments and financial authorities working to balance innovation with investor protection and financial stability.
One of the most important aspects of this new regulatory progress is clarity. Instead of blanket ban
SAND-9.76%


- Reward
- 3
- 3
- Repost
- Share
Discovery :
:
2026 GOGOGO 👊View More
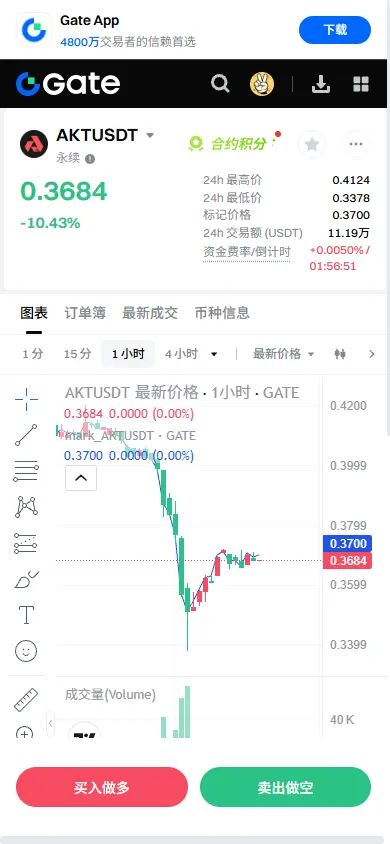
【$AKT Signal】Short position, decline accompanied by abnormal trading volume
After a volume surge and a -10% drop, the pattern is broken, and it is necessary to observe changes in trading volume to determine whether it is a healthy shakeout or the main force is offloading. Current price action indicates selling pressure dominates, with no clear bottom structure.
🎯 Direction: Short position
Market logic suggests that price decline accompanied by trading volume data warrants caution for potential chain reactions caused by long liquidation or main force capital exiting. Until there is effective
View OriginalAfter a volume surge and a -10% drop, the pattern is broken, and it is necessary to observe changes in trading volume to determine whether it is a healthy shakeout or the main force is offloading. Current price action indicates selling pressure dominates, with no clear bottom structure.
🎯 Direction: Short position
Market logic suggests that price decline accompanied by trading volume data warrants caution for potential chain reactions caused by long liquidation or main force capital exiting. Until there is effective
- Reward
- like
- Comment
- Repost
- Share
Which crypto enthusiast missed out on buying the news🤣
View Original
- Reward
- like
- Comment
- Repost
- Share
- Reward
- like
- 1
- Repost
- Share
GateUser-b4bdc61f:
Patting my thigh, see you at 0.15when in doubt, zoom outSponsored by#crypto
- Reward
- like
- Comment
- Repost
- Share
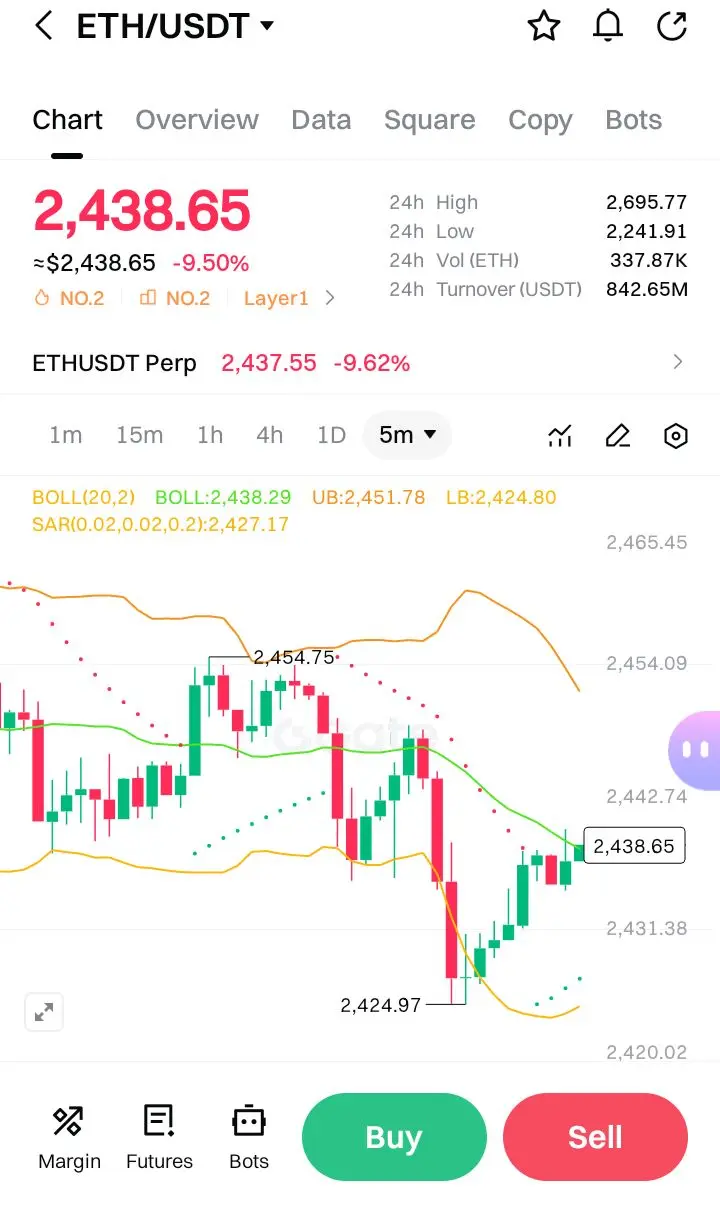
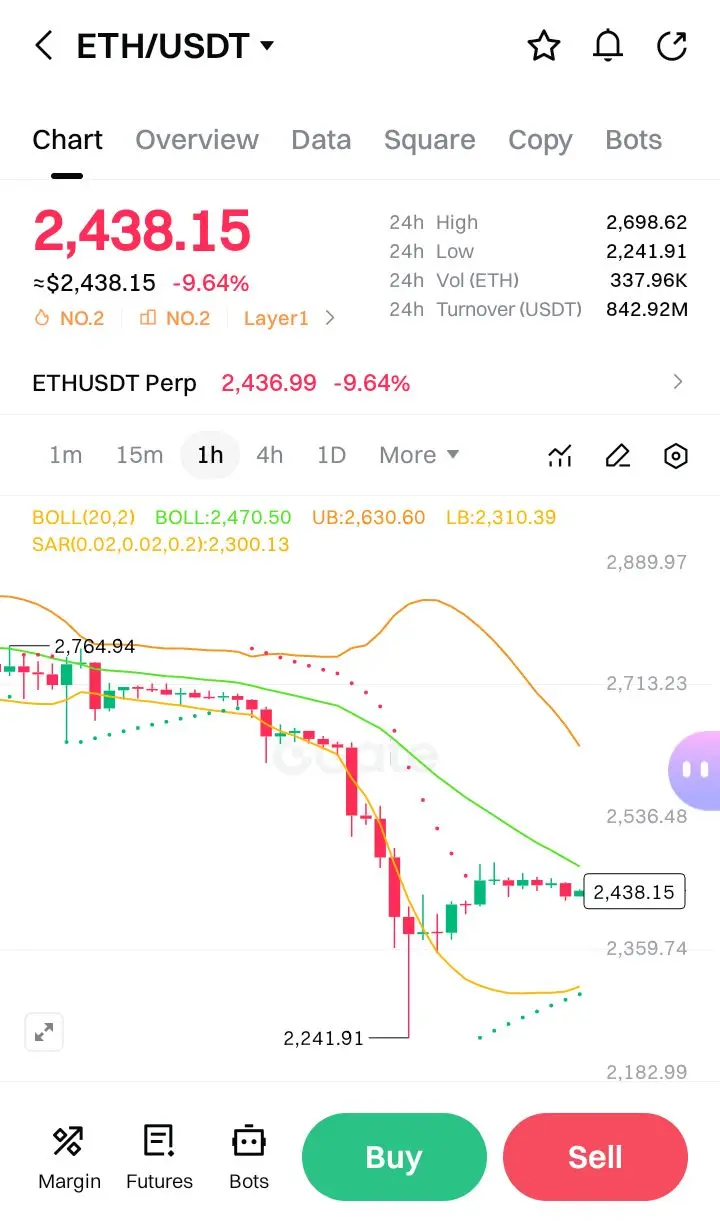
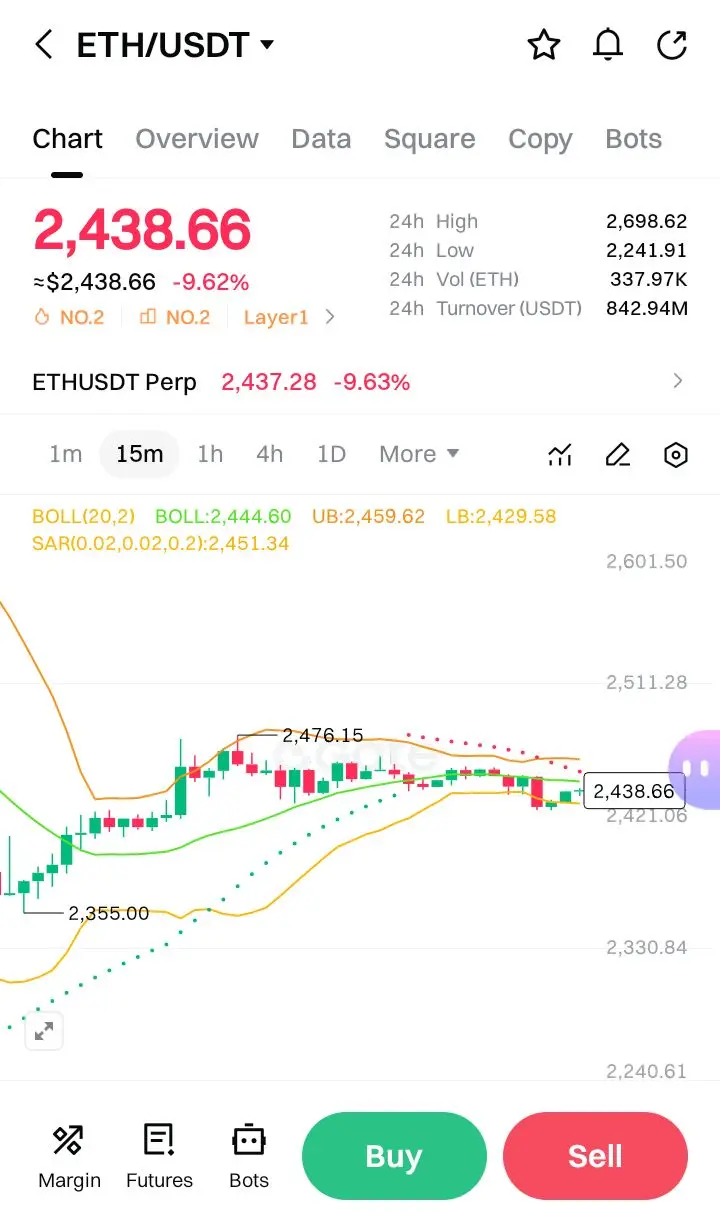
$ETH #MyWeekendTradingPlan Based on the Multi-timeframe charts, Here is the professional analysis and trade plan.
4H Chart - Identify Direction (Trend)
· Primary Trend: Bearish. Price has made a significant lower high (LH) and lower low (LL) structure from the ~$3,045 high. The sharp -9.5% move is a clear downtrend.
· Key Observation: Price is trading below the 4H Bollinger Band basis line (BOLL: ~2,470.50), confirming bearish momentum. The 24h Low ($2,241.91) is a critical macro level.
· Directional Bias: DOWN. Until price reclaims and holds above a significant 4H structure high (e.g., $2,630
ETH-10.48%

- Reward
- 1
- Comment
- Repost
- Share
When you: Sell Crypto → Buy Gold → Gold Crash→ Buy Crypto Back → Crypto Dump Harder.
- Reward
- like
- Comment
- Repost
- Share
Gt
Gate
Created By@shamim11s
Listing Progress
0.25%
MC:
$2.98K
Create My Token
🔹 High Volatility in BTC / ETH / SOL — Washout or Trend Reversal?
0
- Reward
- like
- Comment
- Repost
- Share
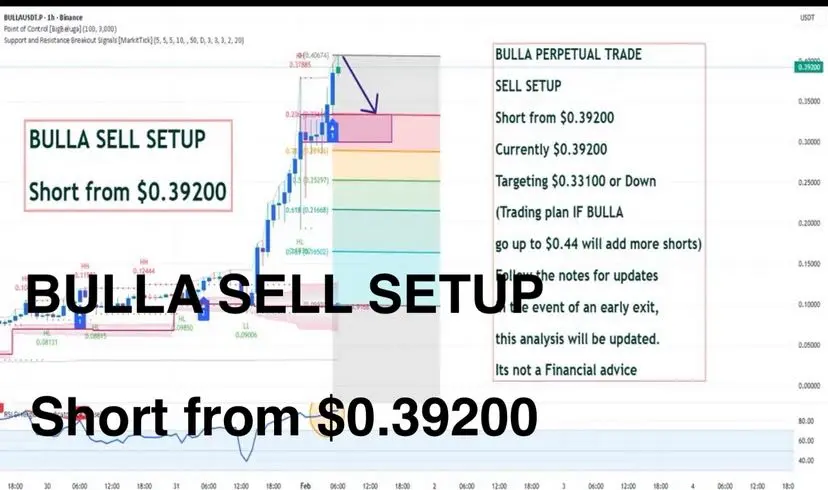
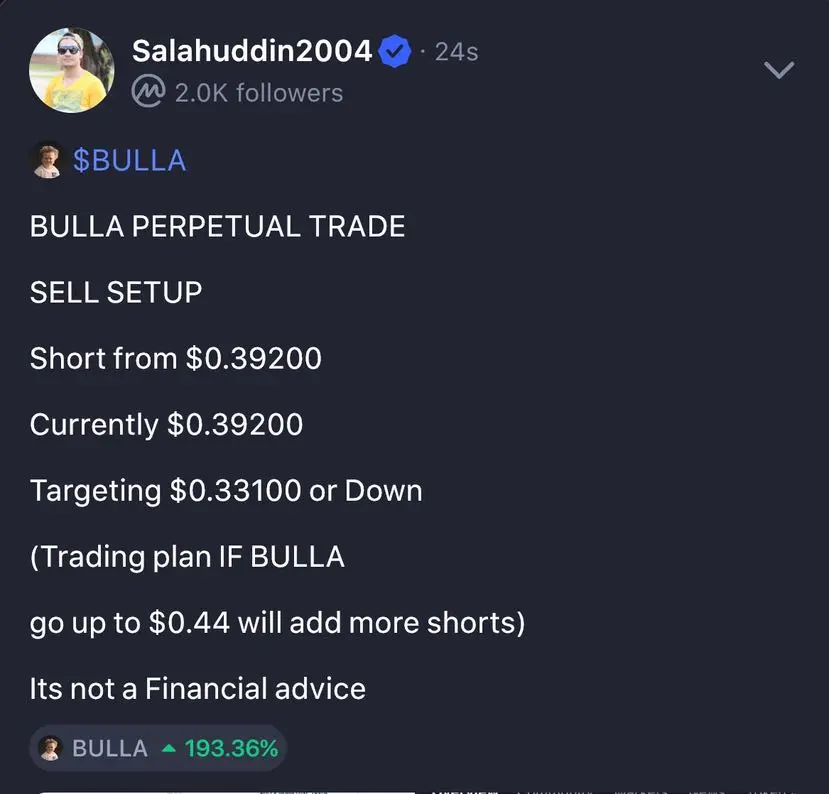
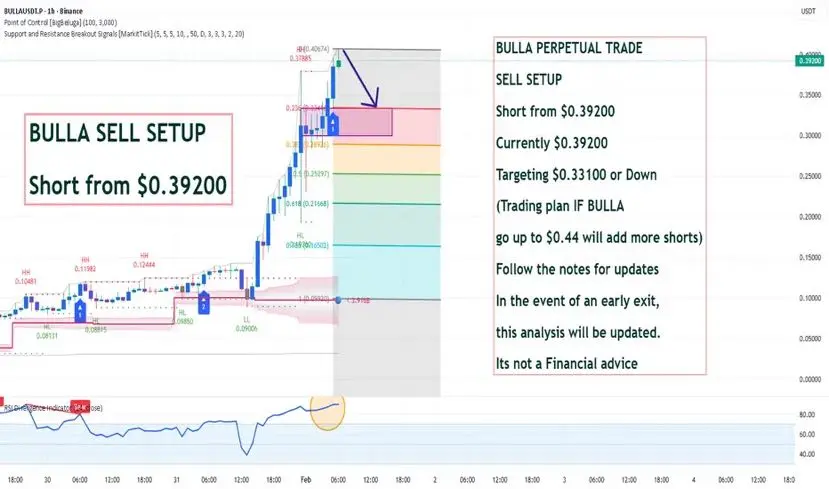
BULLA PERPETUAL TRADE
SELL SETUP
Short from $0.39200
Currently $0.39200
Targeting $0.33100 or Down
(Trading plan IF BULLA
go up to $0.44 will add more shorts)
Its not a Financial advice
#MyWeekendTradingPlan #TokenizedSilverTrend #BULLA #SALAHUDDIN2004 #btc
$BTC $GT $ETH
SELL SETUP
Short from $0.39200
Currently $0.39200
Targeting $0.33100 or Down
(Trading plan IF BULLA
go up to $0.44 will add more shorts)
Its not a Financial advice
#MyWeekendTradingPlan #TokenizedSilverTrend #BULLA #SALAHUDDIN2004 #btc
$BTC $GT $ETH
- Reward
- 1
- Comment
- Repost
- Share
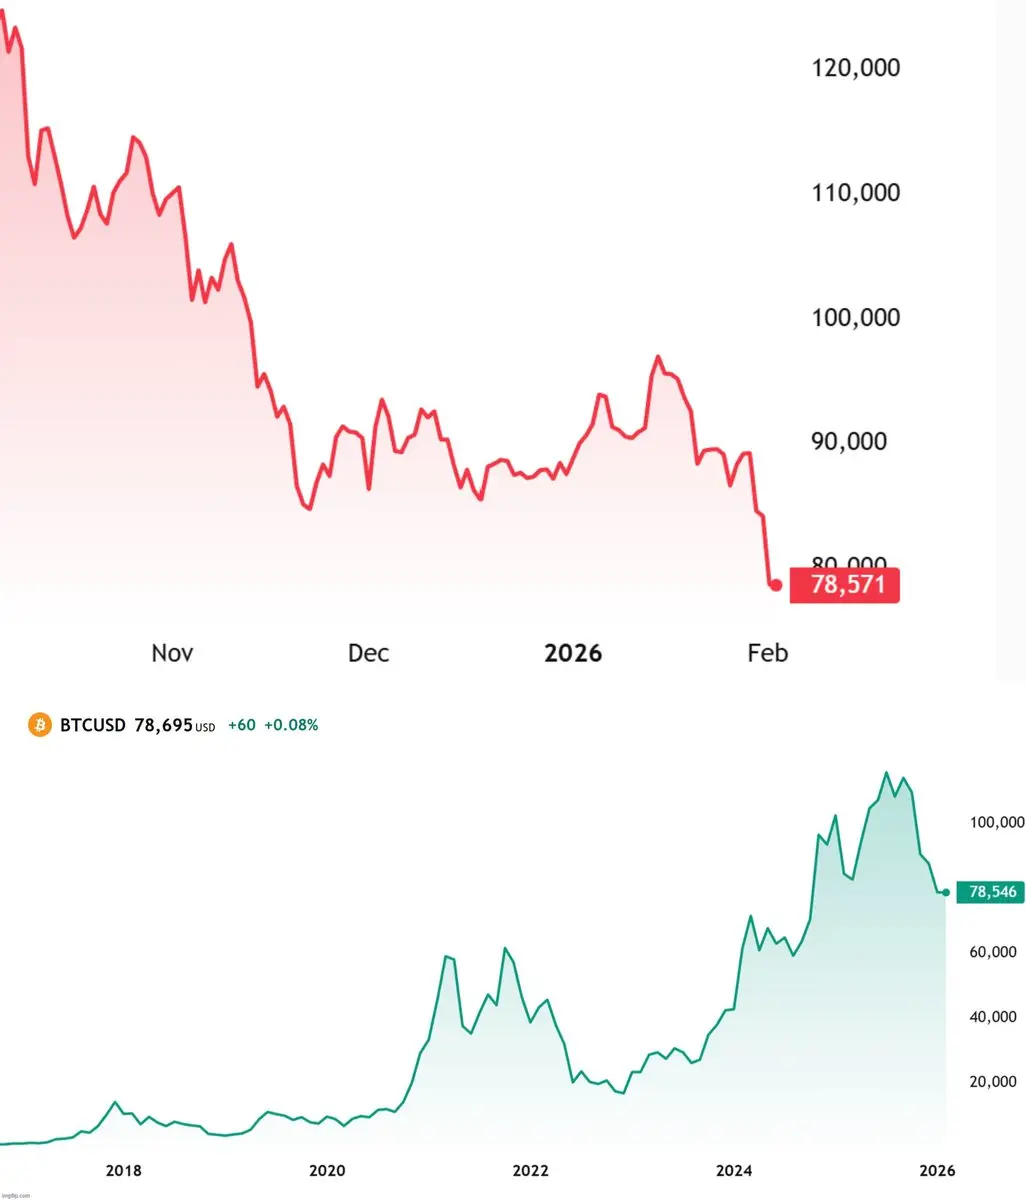
Price equilibrium:BTC trades near fair value as buyers and sellers stay balanced
262
- Reward
- like
- Comment
- Repost
- Share
good morninghere we go againbelievers will say it’s accumulation timeweak hands will say it’s overno matter what, have a nice day, my friends

- Reward
- like
- Comment
- Repost
- Share
BTC ~$78K-$79K today—deeper dip amid volatility. Gold & Silver correcting sharply.
Like koi gliding through turbulent waters, value endures with patience & strong roots.
MKI: long-term, transparent blockchain—no hype.
Stay patient, family.
#MKI #A59 #MyWeekendTradingPlan #USGovernmentShutdownRisk #PreciousMetalsPullBack
Like koi gliding through turbulent waters, value endures with patience & strong roots.
MKI: long-term, transparent blockchain—no hype.
Stay patient, family.
#MKI #A59 #MyWeekendTradingPlan #USGovernmentShutdownRisk #PreciousMetalsPullBack
BTC-6.51%


MC:$3.58KHolders:42
0.02%
- Reward
- like
- Comment
- Repost
- Share
Gm my internet frens

- Reward
- like
- Comment
- Repost
- Share
Dragon Fly Official insight: Silver on-chain — catch-up trade or a new structural asset? 🥈⛓️
As silver begins to appear in tokenized and on-chain formats, the conversation shifts beyond simple price comparisons with gold. The real question isn’t whether silver will catch up — it’s what role silver plays in a digitizing monetary system.
🔍 Structural Analysis (Beyond Price Ratios)
Historically, silver lags gold during early macro tightening phases and outperforms later when liquidity expectations improve. But on-chain silver introduces a structural twist:
• Lower unit price + higher volatility


- Reward
- 1
- 1
- Repost
- Share
DragonFlyOfficial:
A single cinematic image showing: A silver bar transforming into a blockchain token Gold vs silver ratio chart fading into the background Industrial silver usage (solar panels / circuitry) subtly blended Minimal Dragon Fly watermark in the bottom cornerMy grandmother never exercised. Ever since I can remember, she hasn't been in good health, with leg problems and daily pain. But even so, she lived to be over 80 years old. My grandma also never exercised. Now she's over 90 and doing well, in good health. Most athletes don't have good health when they get older, which shows that any exercise should be moderate.
View Original
- Reward
- like
- Comment
- Repost
- Share
Load More
Join 40M users in our growing community
⚡️ Join 40M users in the crypto craze discussion
💬 Engage with your favorite top creators
👍 See what interests you
Trending Topics
View More23.93K Popularity
61.61K Popularity
366.84K Popularity
45.49K Popularity
61.3K Popularity
Hot Gate Fun
View More- MC:$2.93KHolders:10.00%
- MC:$2.93KHolders:10.00%
- MC:$2.92KHolders:10.00%
- MC:$2.93KHolders:10.00%
- MC:$2.93KHolders:10.00%
News
View MoreTrend Research Deposits 10,000 ETH to CEX After Accumulating 651,310 ETH
1 m
BULLA(BULLA) Perpetual contracts are now live in the Meme Zone of the Gate Contract, supporting leverage trading from 1x up to 20x.
2 m
ETH drops below 2400 USDT
24 m
In January, the number of daily active addresses on Solana surged by 115%, while the Ethereum network's daily active addresses increased by 25%.
26 m
Jupiter: GUM Private Test Version is Coming Soon
30 m
Pin