

Asiftahsin
Share Crypto Related Market Analysis, Share Crypto Related knowledge for my follower(brother and Sister)
Asiftahsin
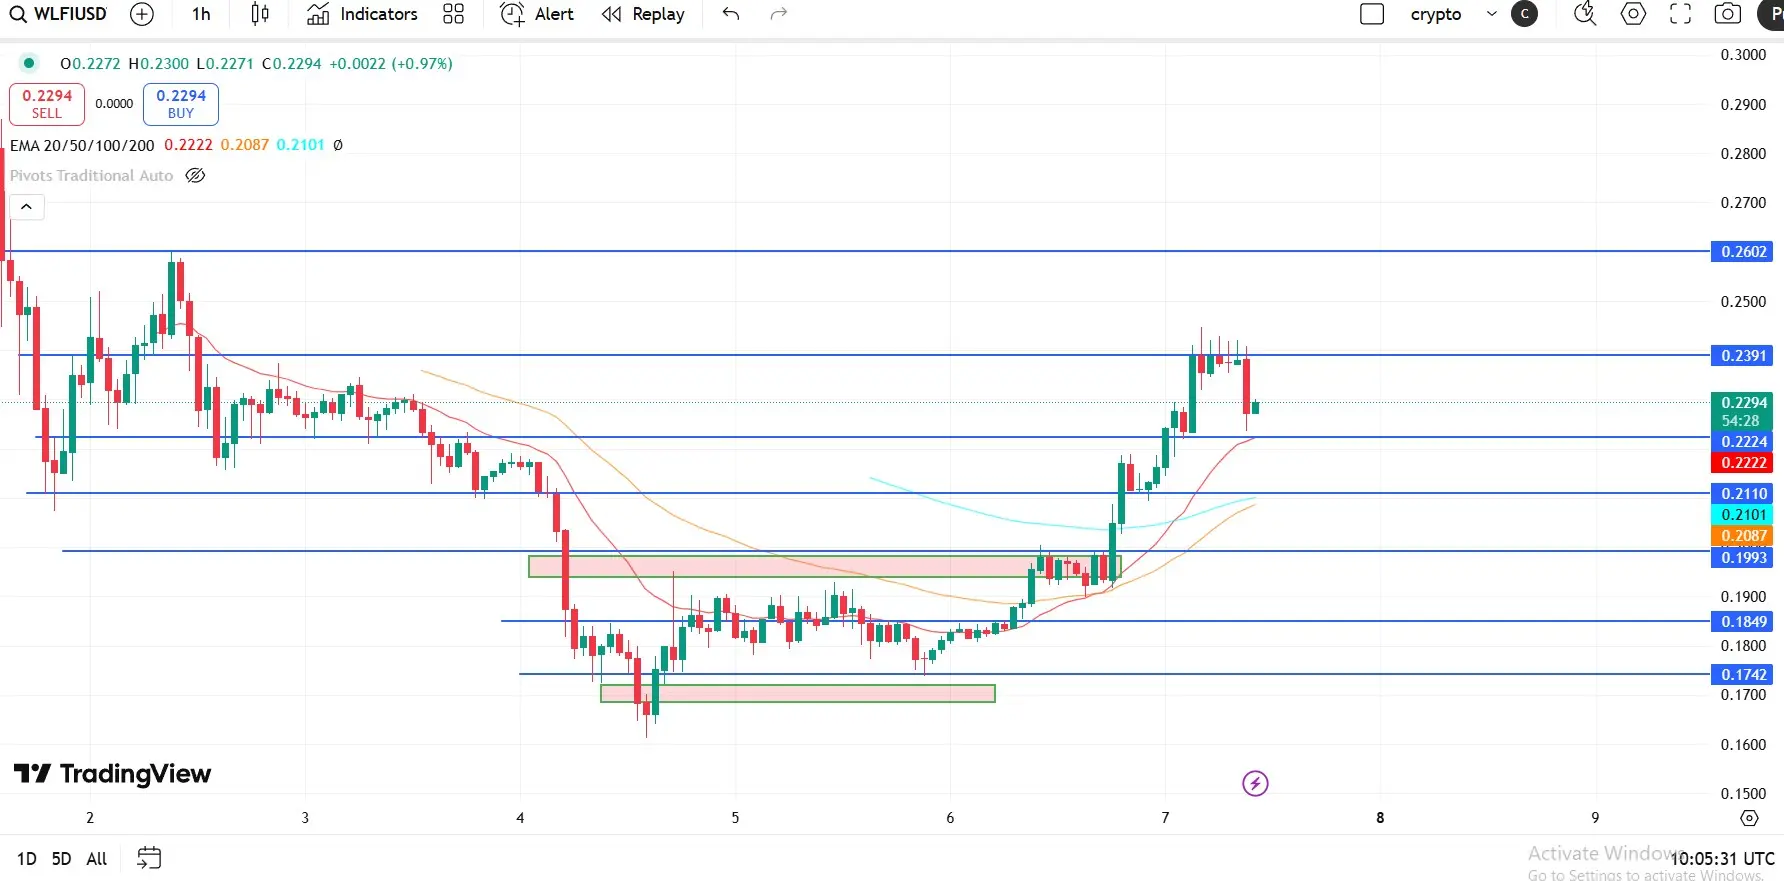
WLFI Price Analysis :
WLFI is trading around $0.23–$0.24 USD, with notable volatility reflected in the wide price range.
Analysts estimate WLFI may trade between $0.15 and $0.30, with an average near $0.20.
Support levels are noted at $0.1853 and $0.1742, with breakdowns stirring concerns about sustainability.
WLFI is trading at around $0.23–$0.24, showing a strong one-day rebound of up to 30%, but remains significantly below its early launch highs. The market is highly speculative—driven by hype, technical events like token burns, and controversial governance practices like wallet blacklisti
WLFI19.67%
- Reward
- 3
- 2
- Repost
- Share
AgentWXO:
Nice broView More
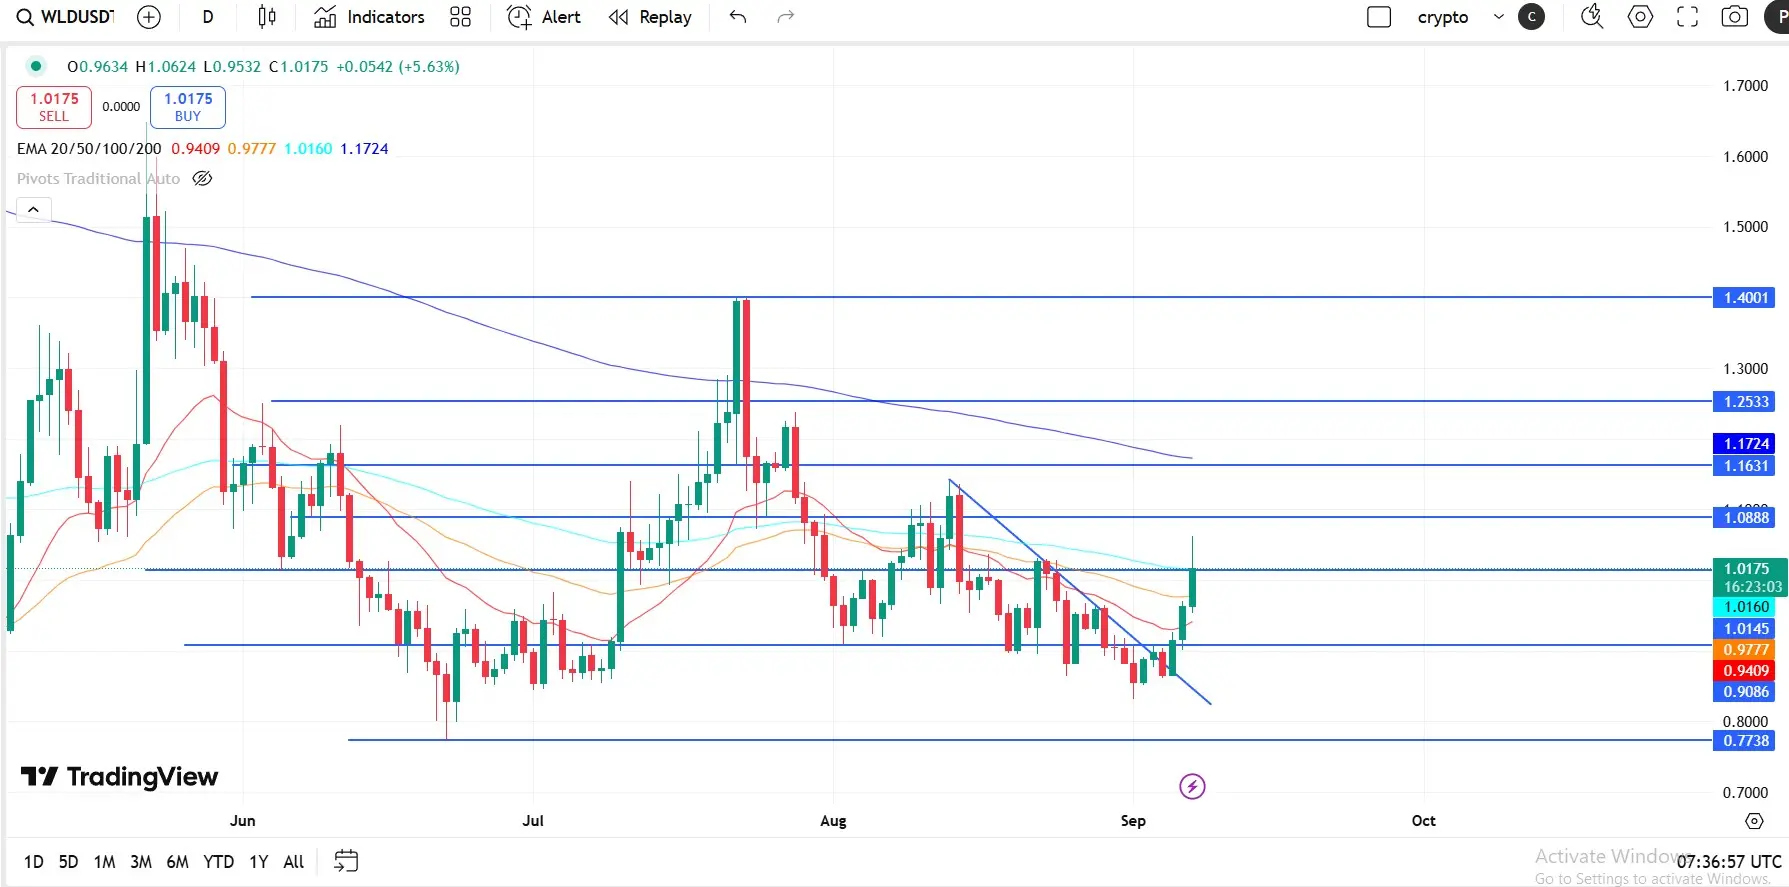
WLD Price Analysis :
WLD reclaimed its 200-day SMA (~$0.993).
This triggered a bullish MACD crossover and lifted the 7-day RSI (~60.8) into a positive zone (not yet overbought).
Such moves are interpreted as potential trend reversals.
If sustained, the next technical target could be $1.07 (23.6% Fibonacci retracement).
Slightly bullish—WLD is holding above short-term support and showing signs of recovery.
Price remains below key moving averages (20-day and 50-day), which serve as potential roadblocks.
Reclaiming the 200-day SMA may act as a catalyst for broader trend reversal.
Breaking above ~
- Reward
- 13
- 8
- Repost
- Share
Alfarich :
:
help me now I' new .View More
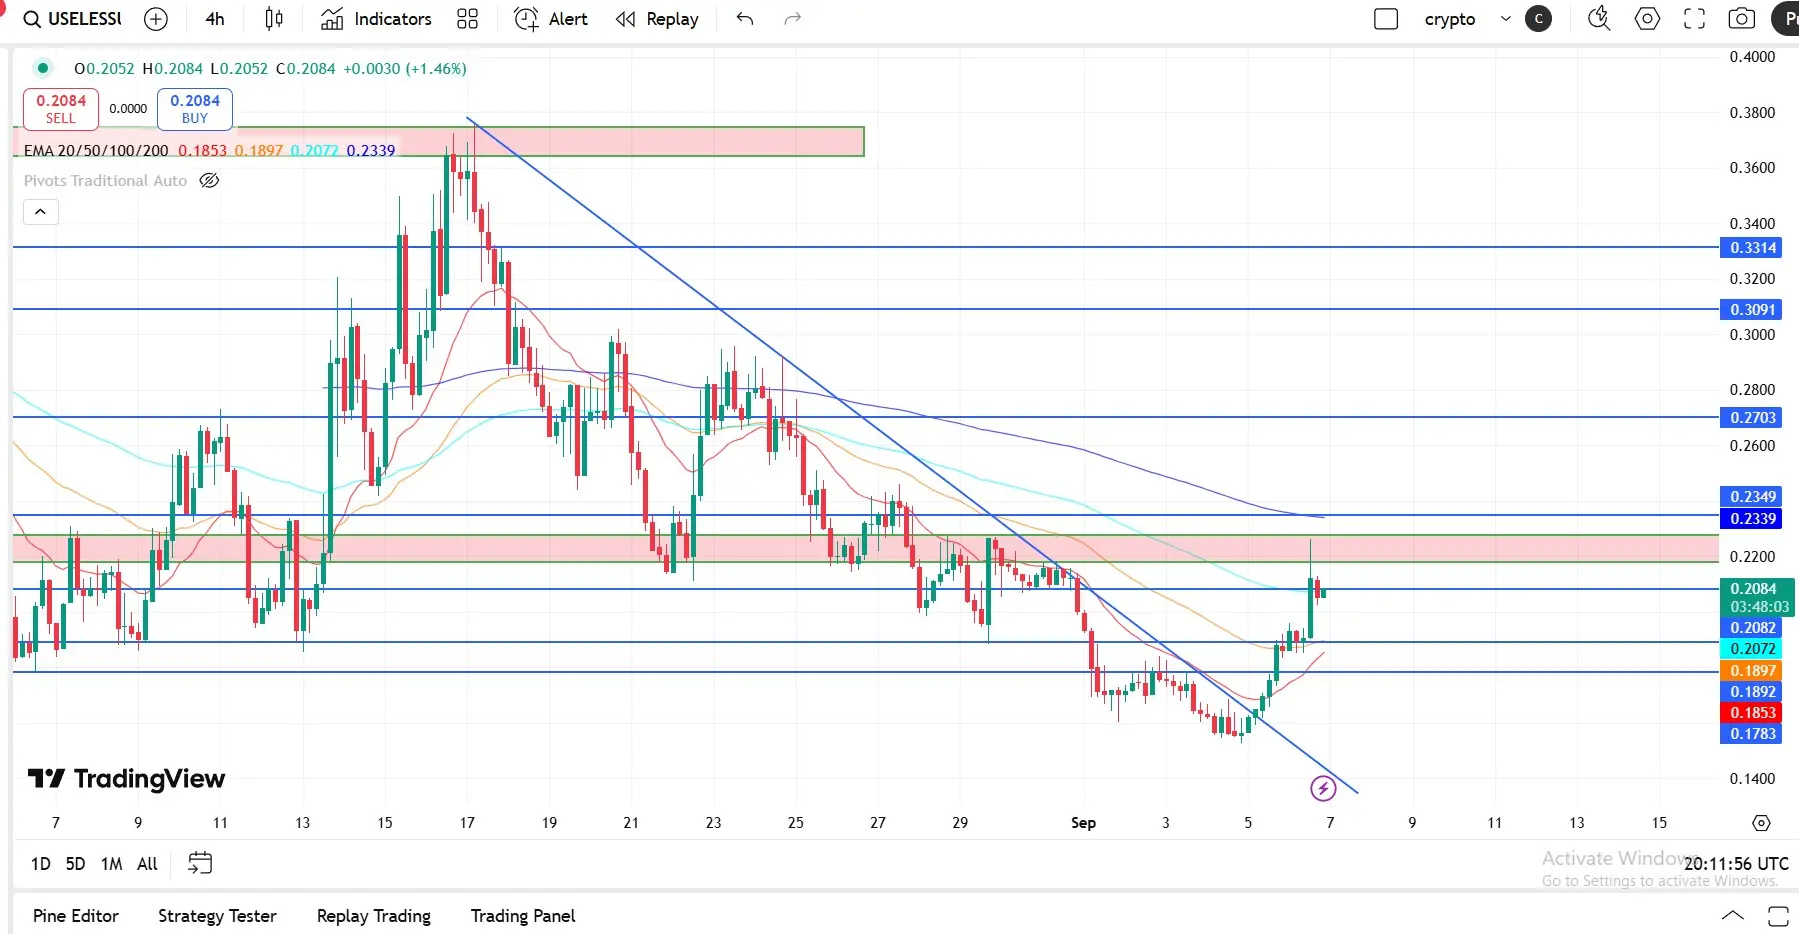
Useless Token Price Analysis :
A sustained hold above $0.21–$0.22 and push toward $0.23–$0.24 could validate further upside. Breaking above $0.25 (daily EMA) would reinforce strength.
A break below $0.21 risks deeper correction toward $0.20, and potentially $0.18–$0.19 if volatility worsens.
If you're trading the 4-hour range, watch for price behavior around $0.21 (bounce/resist), add stop-loss below $0.20, and scale out near $0.24–$0.25 unless breakout momentum is clear.
$0.20–$0.21, Prices have ranged between $0.18 and $0.22 over the past day or so.
Immediate support at ~$0.25 (20-day EMA ac
- Reward
- 26
- 17
- 1
- Share
Rrr27377 :
:
My lovely buddies from every nation please like and follow support the wonderful dynamic excellent streamer Asiftahsin and Asiftahsin 💞🫶💞💪💪💪💪👌👌👌😍😍View More
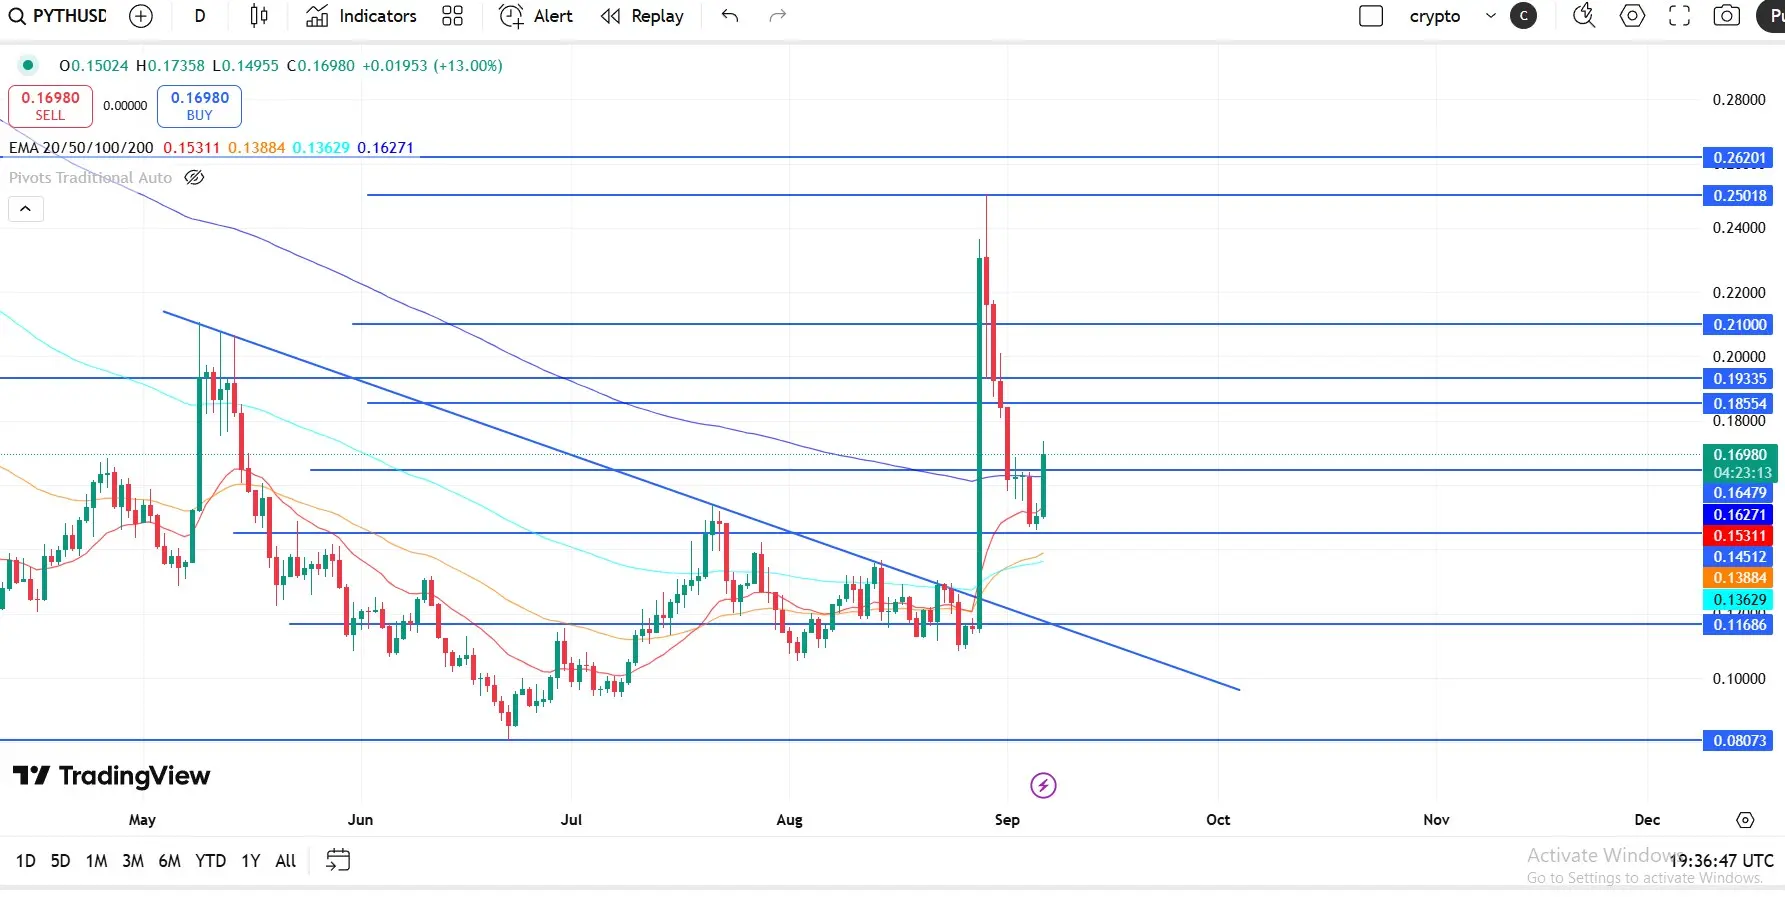
Pyth Price Analysis :
PYTH is currently in a cooling-off phase after a major rally, pulling back to essential EMAs and support zones.
Short-term defensive levels around $0.1275–$0.13 are key—holding here may provide the foundation for another run at higher resistances.
A clean move back above $0.16–$0.19 and EMAs would offer a clearer path upward, especially if supported by on-chain developments or renewed institutional interest.
Keep watch on the U.S. economic data integration, broader market sentiment, and whether PYTH maintains technical support amidst these dynamics.
The range $0.1275–$0.1
- Reward
- 10
- 4
- Repost
- Share
NewName:
Thank you for information! View More
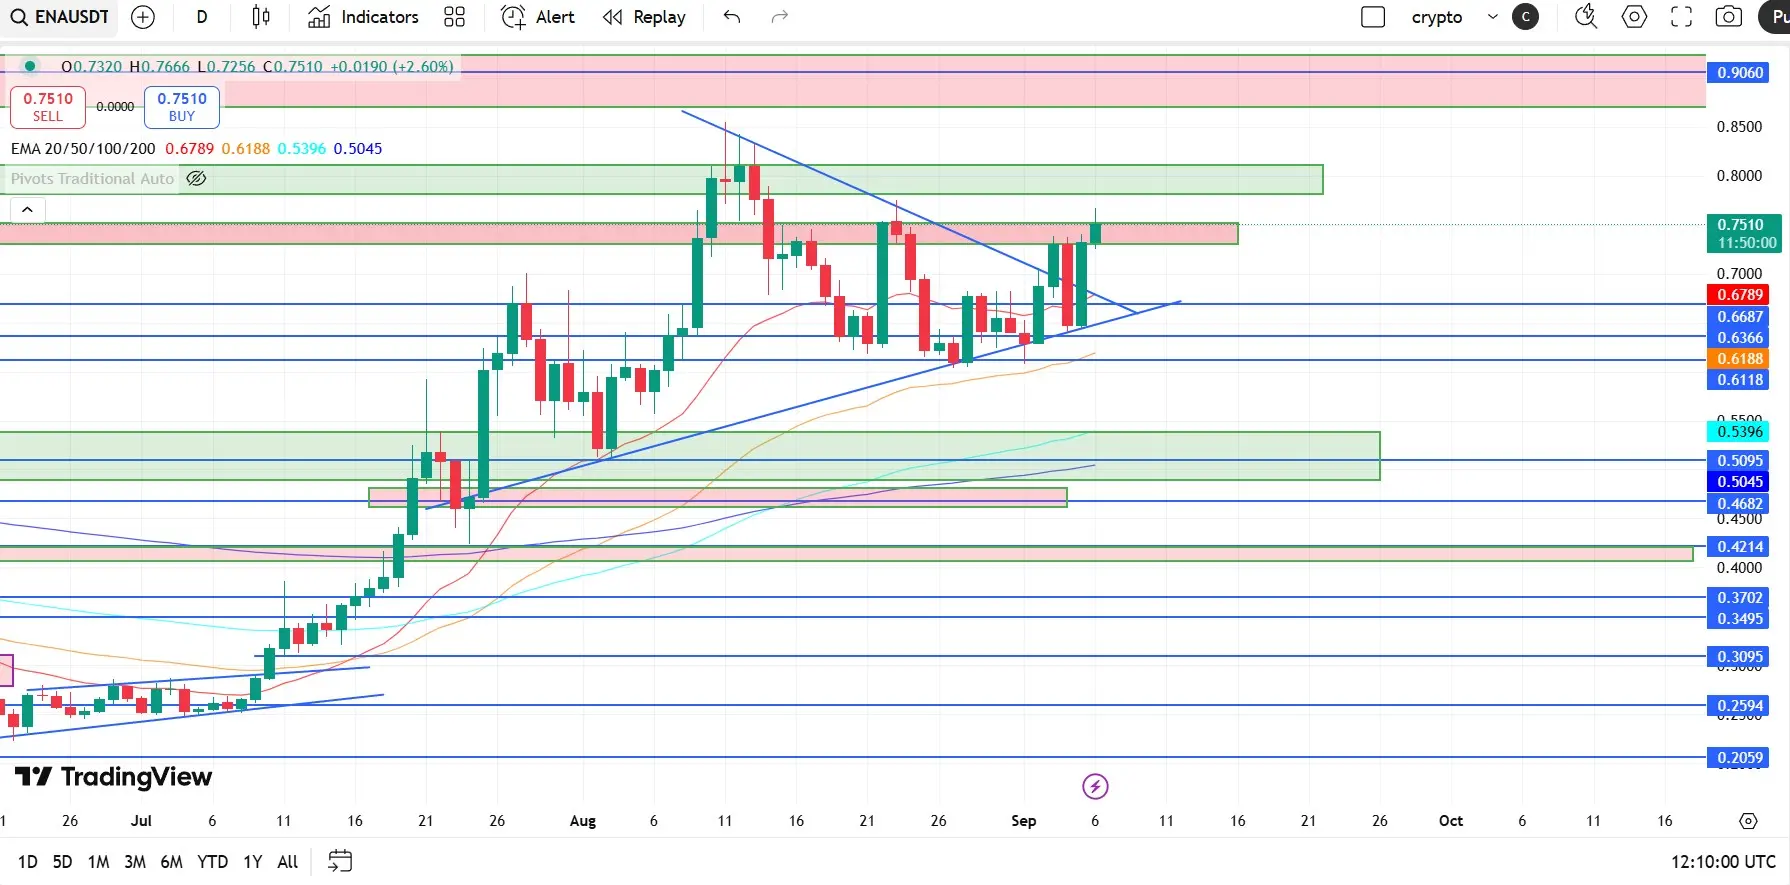
ENA Price Analysis :
A falling wedge appears on the daily chart, often interpreted as a bullish continuation pattern; a breakout could propel price higher.
Recently, ENA broke out of a bullish pennant formation, achieving a weekly gain of ~9% and setting a target near $1.18.
Technical momentum indicators are strong: the RSI stands at ~58 (healthy, not overbought), and MACD shows positive momentum, further supporting continuation higher.
Immediate support lies around $0.65, a short-term technical floor.
Broader structural support clusters exist at $0.56, $0.47, and even deeper at $0.3487—zones
- Reward
- 9
- 12
- Repost
- Share
KimKey:
Gooooooooooooood View More
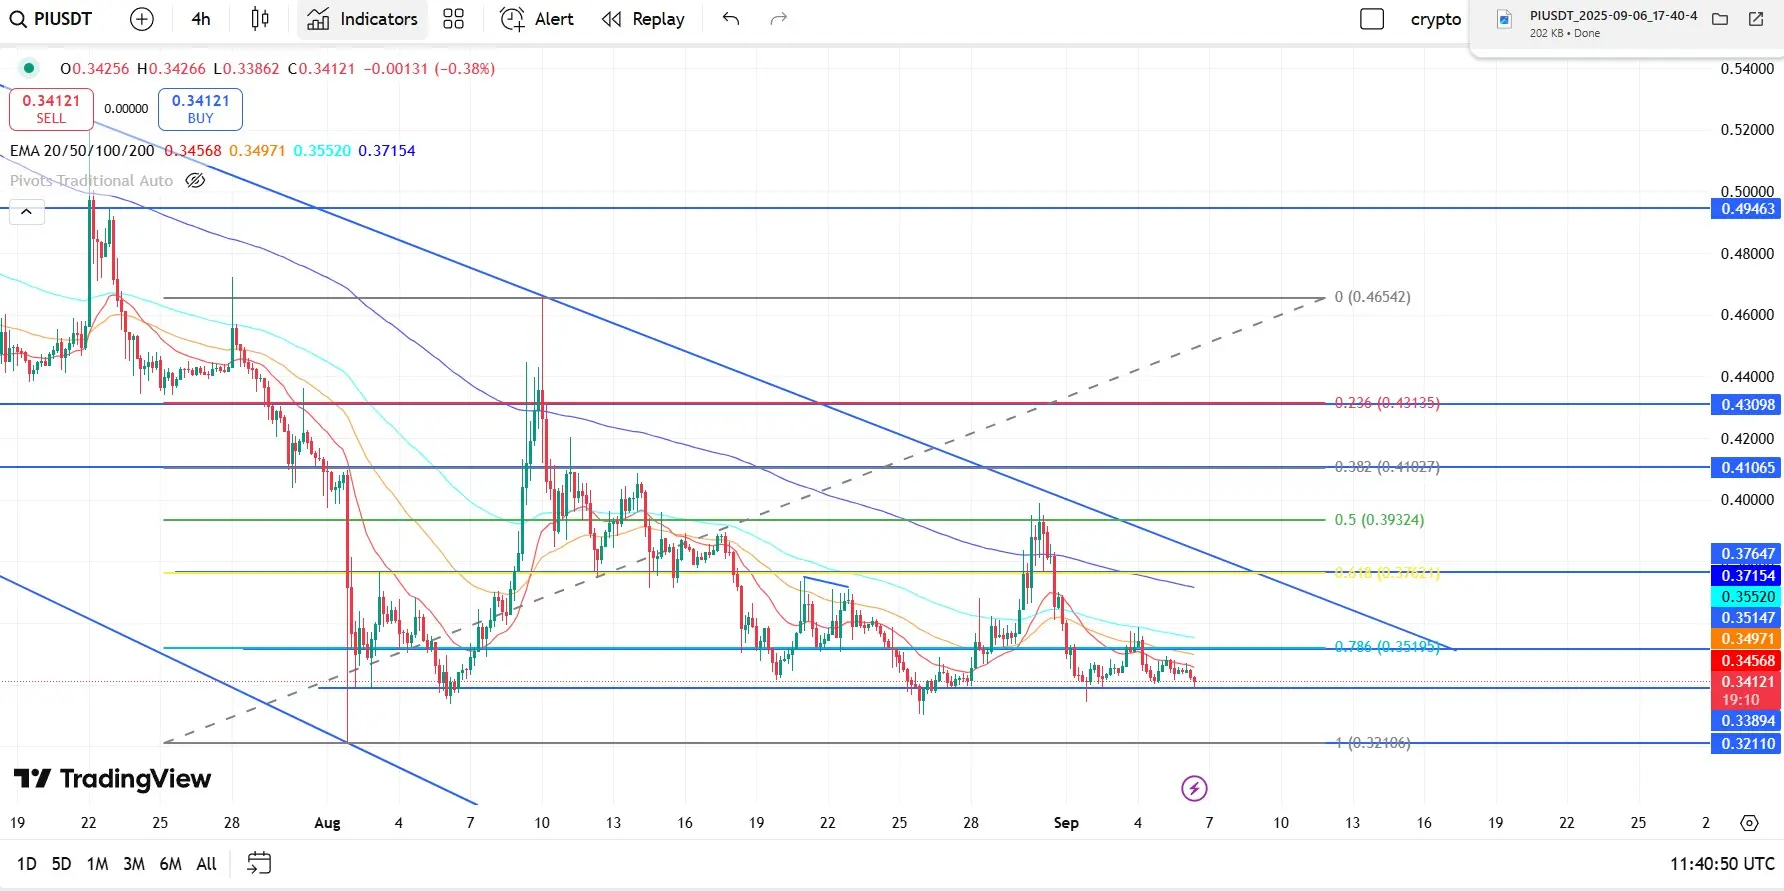
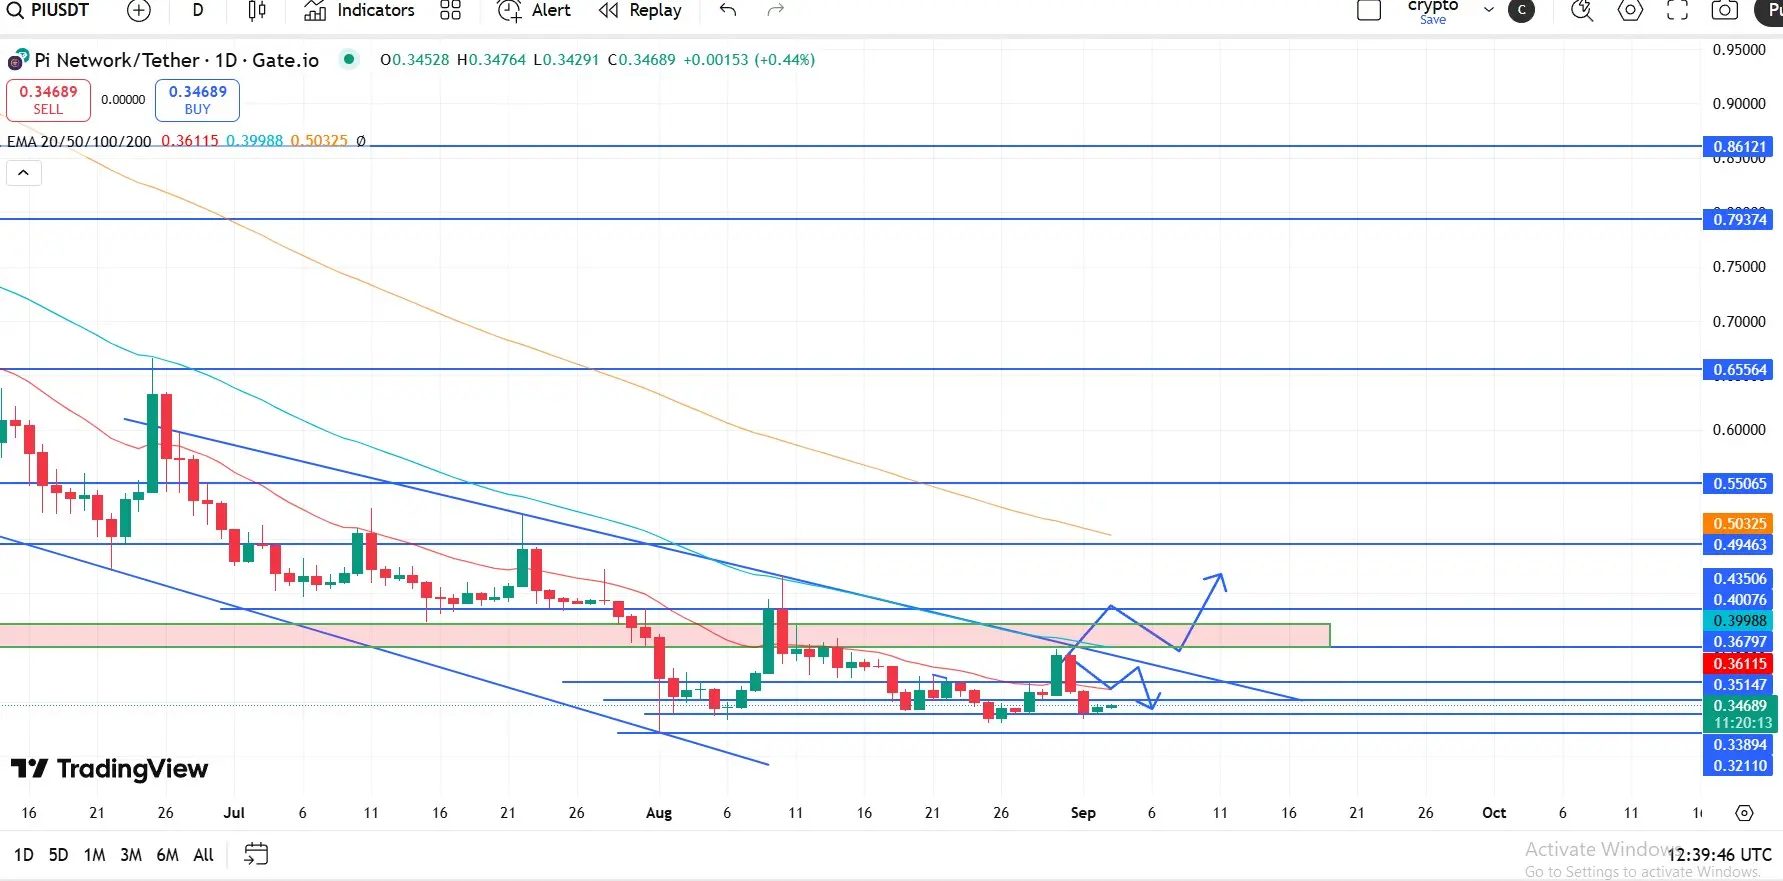
Pi Network Price Analysis :
Price holds above $0.34: Could support stabilization.
Break above $0.36–$0.38: May spark a short-term rally toward $0.40+.
Successful Hackathon or listing events: Could provide needed upside catalyst.
Watch market structure for deeper breakdown toward $0.30.
the outlook bearish, forecasting a possible ~25% decline to around $0.258 by early October 2025. The sentiment metric also rings bearishly, with a neutral Fear & Greed Index of 48 and RSI near 44.
Current bias leans bearish. Most technical indicators and forecasting models project downward pressure, and momentu
- Reward
- 23
- 16
- Repost
- Share
Discovery:
Watching Closely 🔍View More
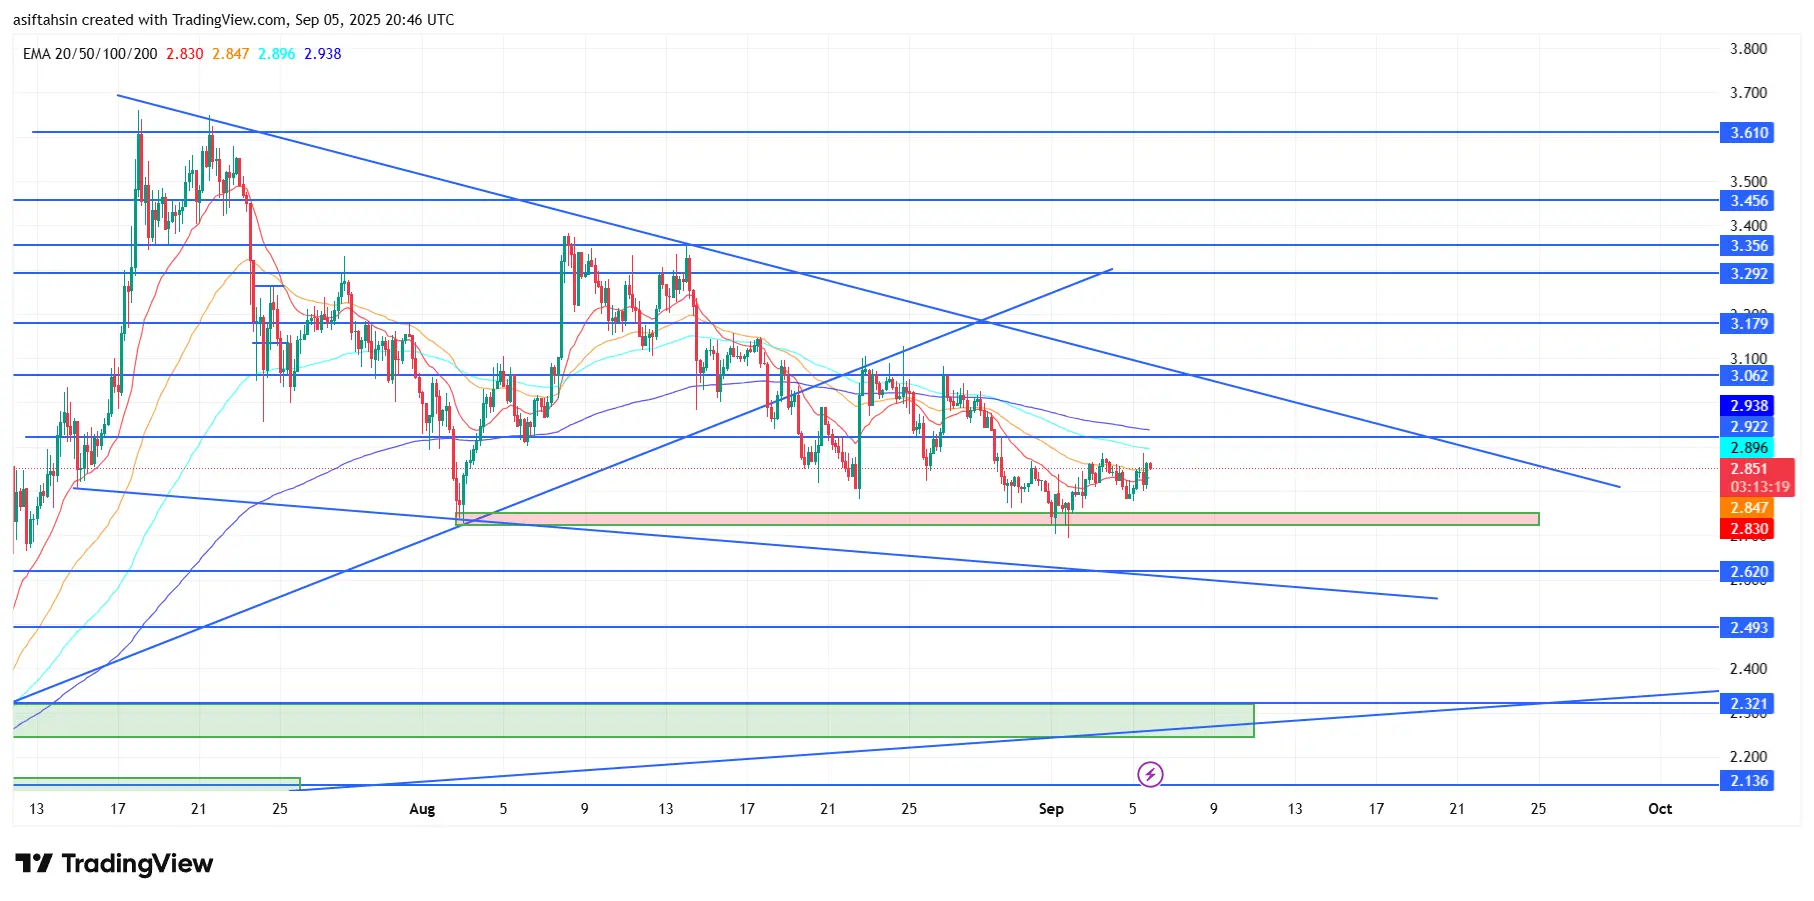
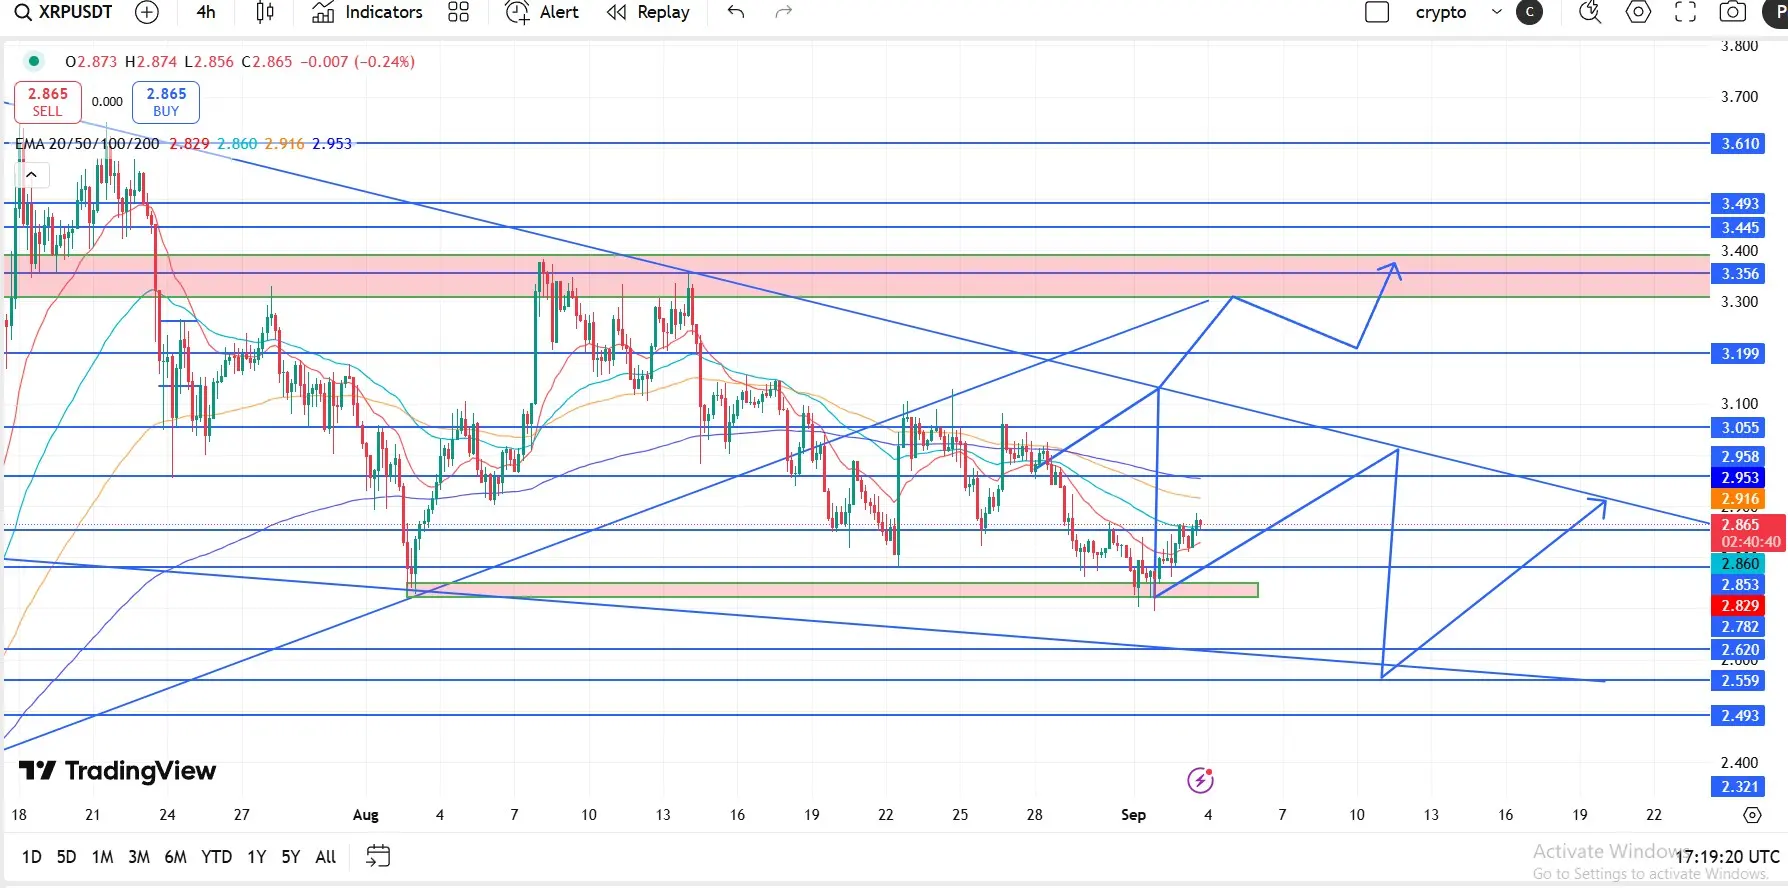
XRP could extend its decline :
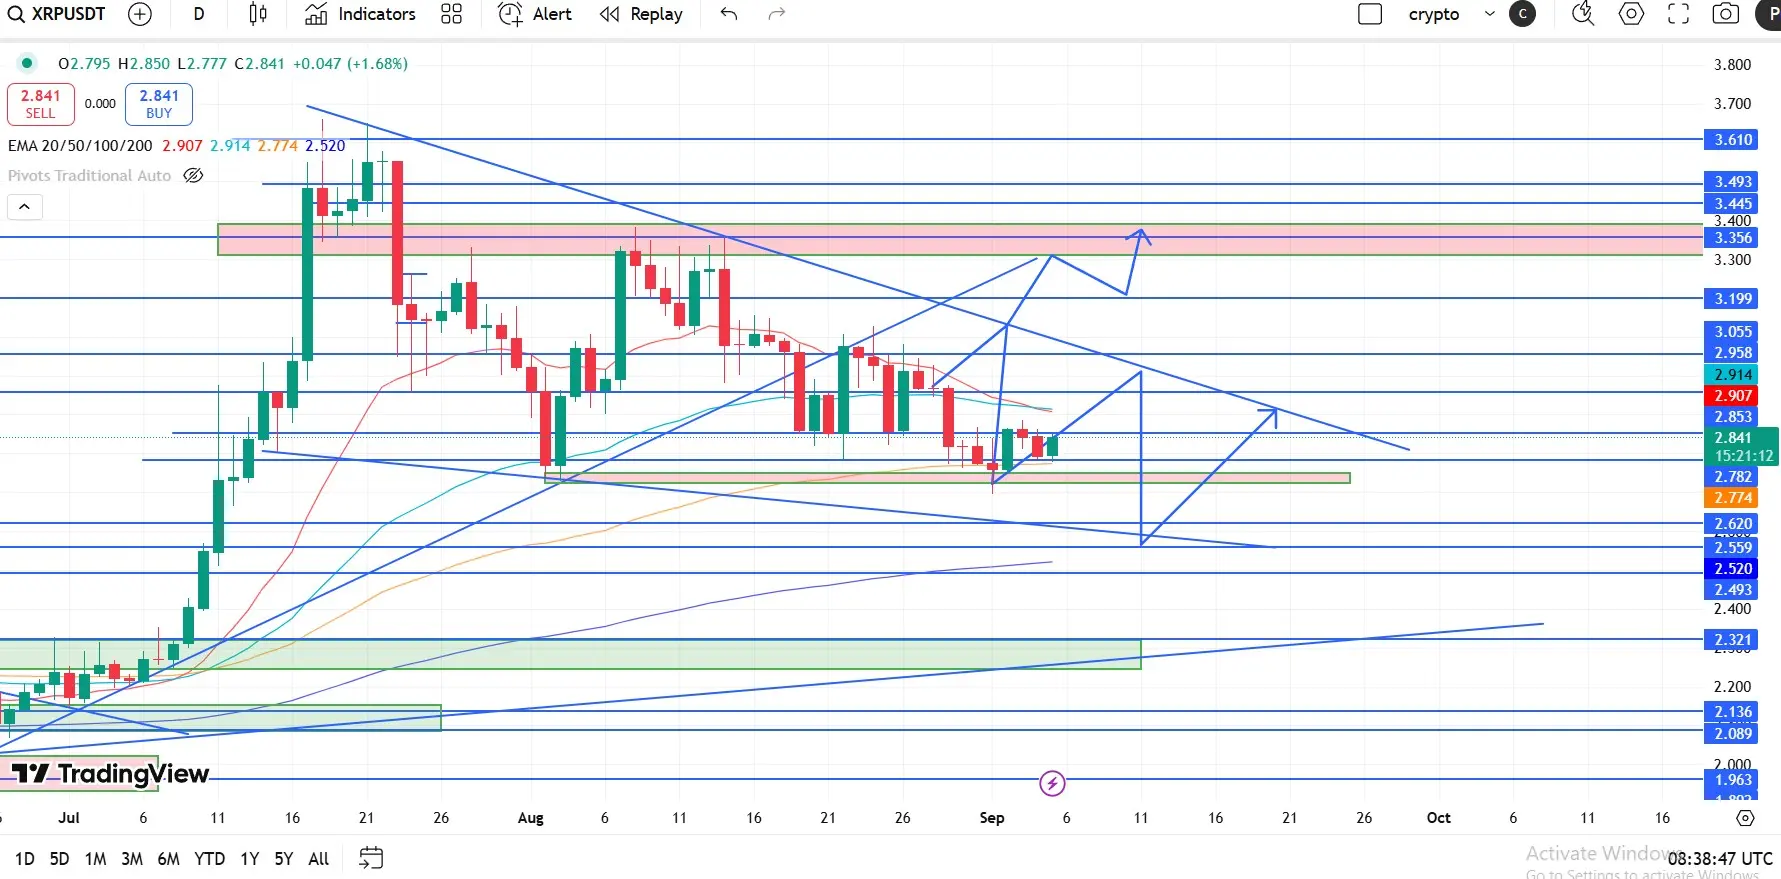
XRP price is testing support at $2.80 after clawing back part of the intraday gains on Friday, reflecting the risk-off sentiment during the American session. The Relative Strength Index (RSI) at 46 and declining toward the oversold region indicates fading bullish momentum as the bears take control.
The sideways movement in the Moving Average Convergence Divergence (MACD) indicator around the zero line indicates a tug-of-war between the bulls and the bears. If the MACD line in blue confirms a sell signal by dropping below the red signal line, the decline could acc
- Reward
- 20
- 19
- Repost
- Share
Sakura_3434:
1000x Vibes 🤑View More
Aerodrome Finance prepares to lift off, targeting key resistance :
Aerodrom edges higher by over 4% so far on Friday, holding above the 61.8% Fibonacci retracement, drawn from the $2.33 high of December 12 to the $0.28 low from April 7, at $1.06. The recovery run targets the 78.6% Fibonacci retracement at $1.48 as the 50-day EMA provided dynamic support, increasing upside chances.
The technical indicators on the daily chart signal a potential shift in trend momentum. The Moving Average Convergence Divergence (MACD) shows a declining intensity of the red histogram bars. Sidelined investors cou

- Reward
- 15
- 10
- Repost
- Share
Sakura_3434:
1000x Vibes 🤑View More
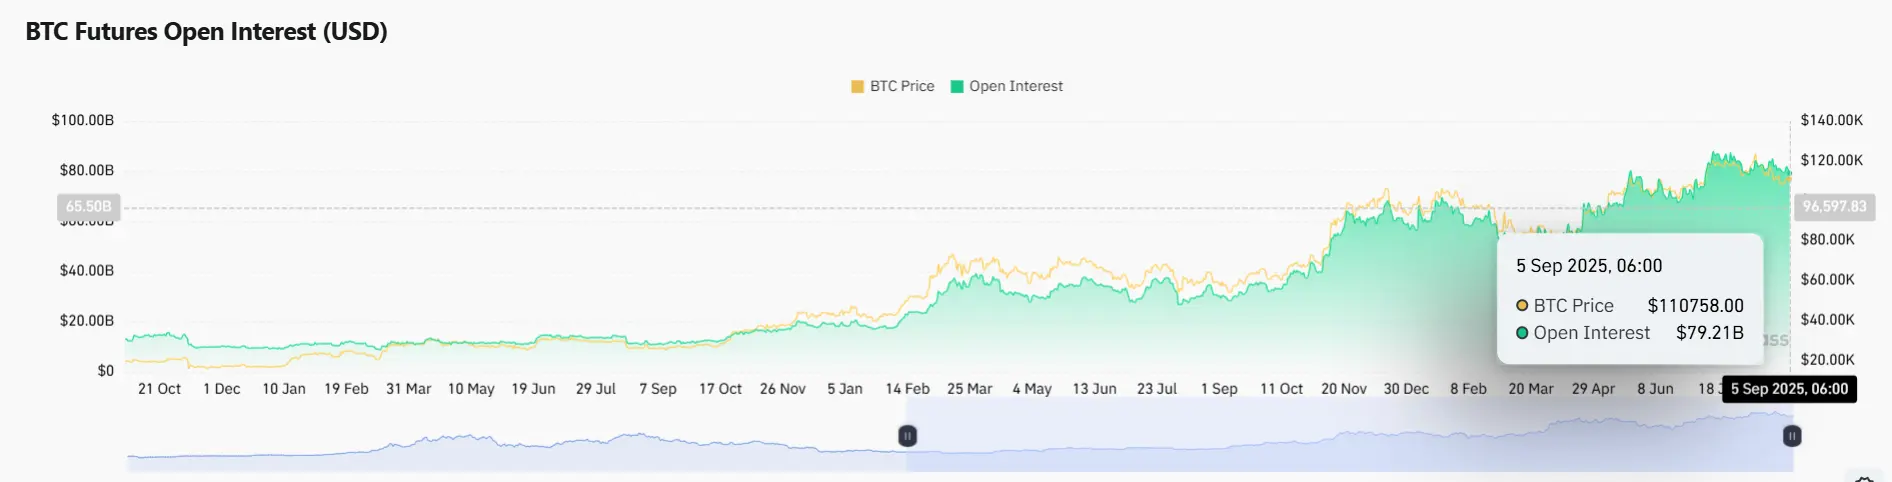
Crypto Today: Bitcoin renews bid for $118,000, Ethereum and XRP show recovery signs :
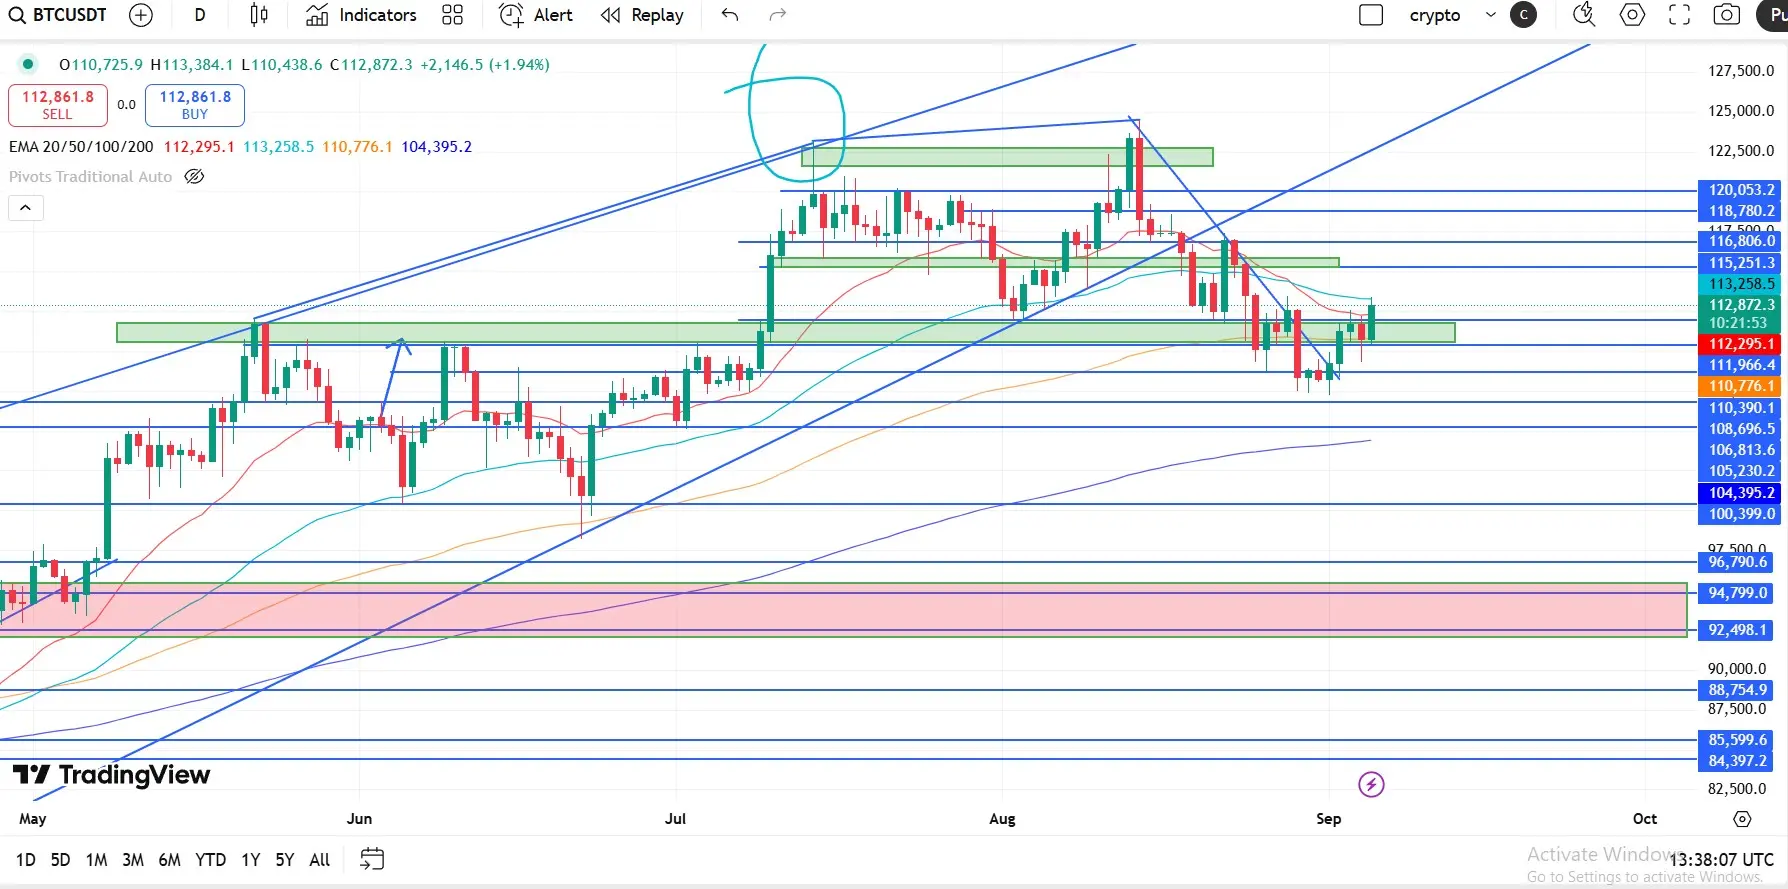
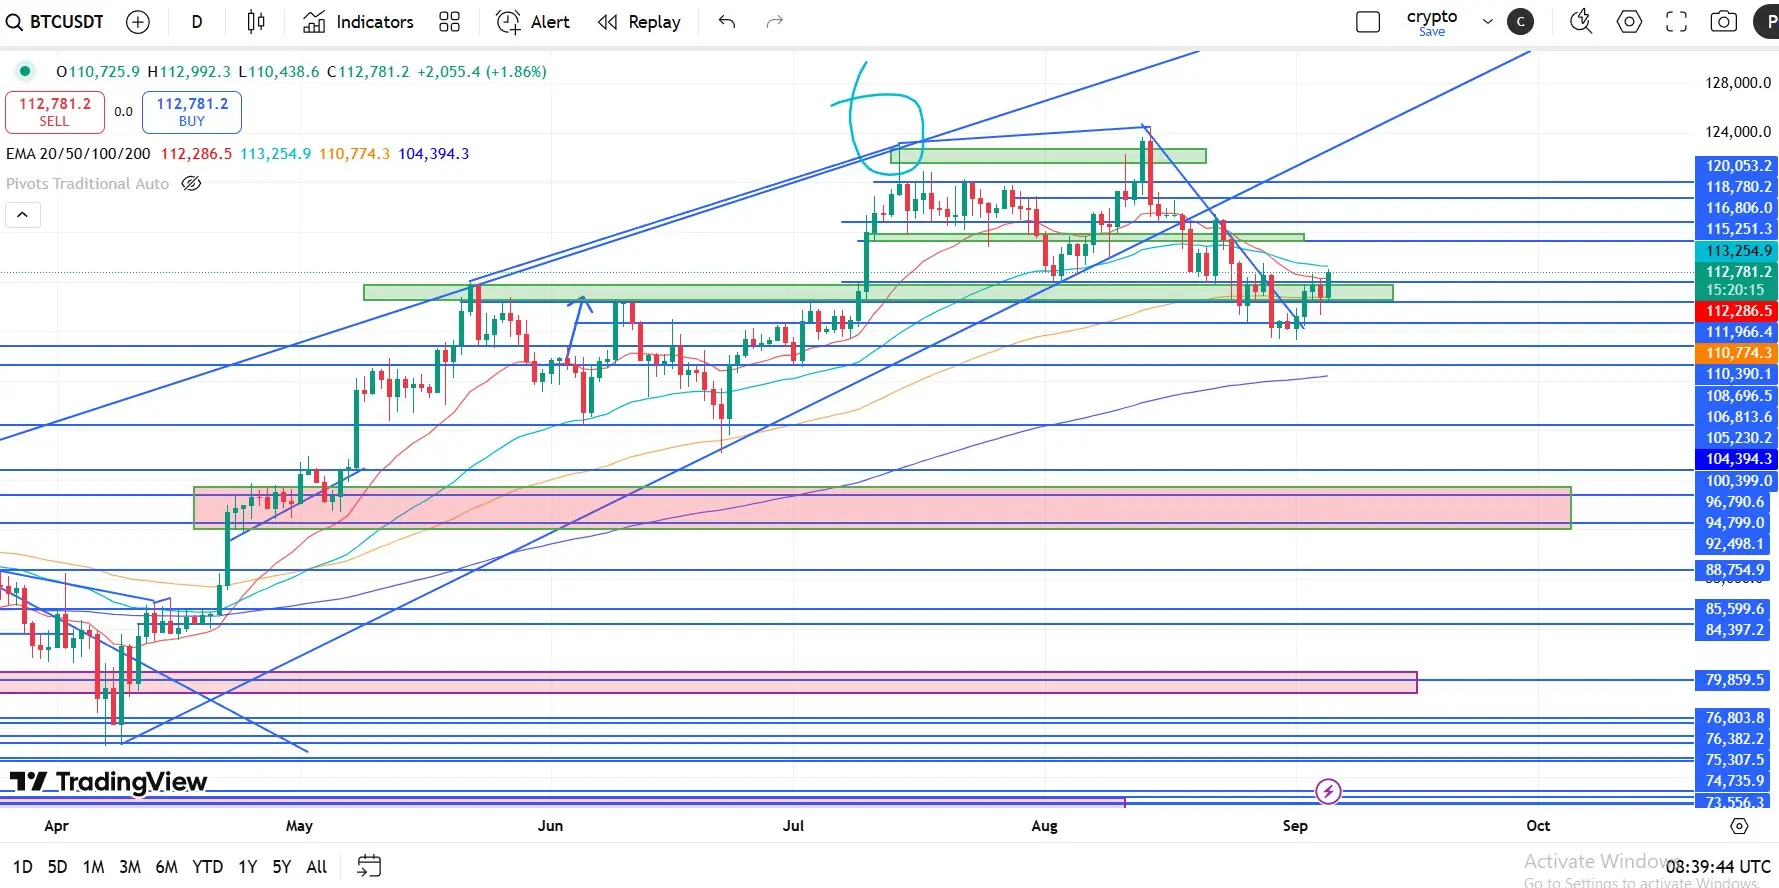
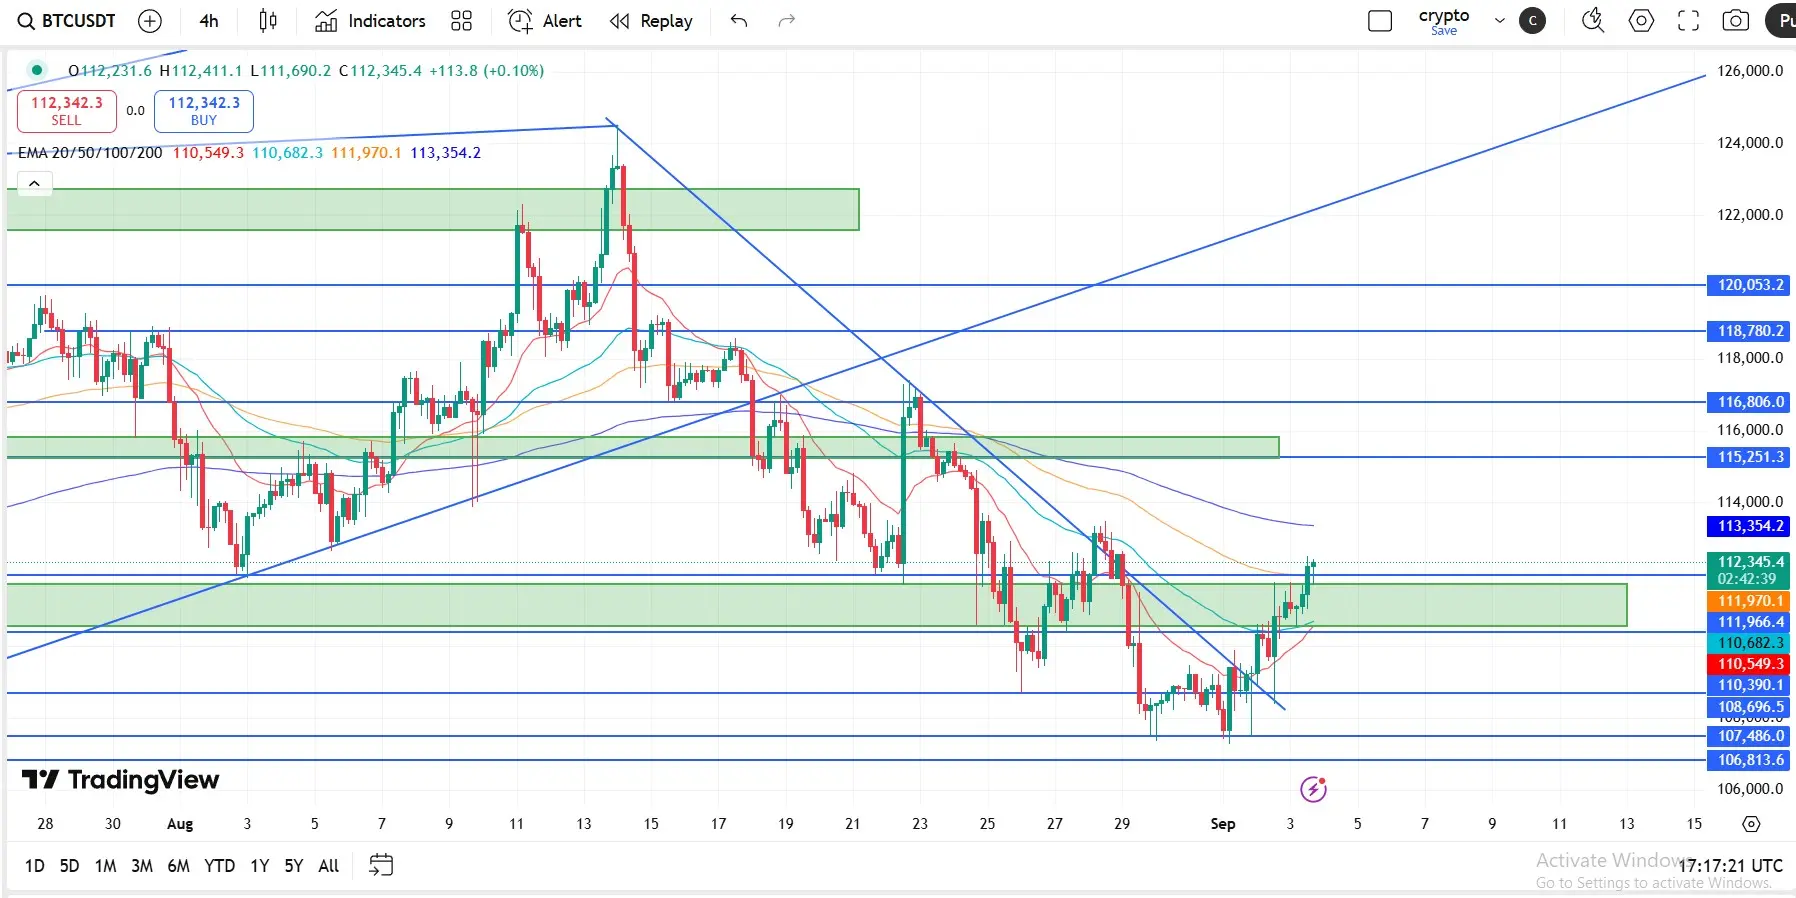
Bitcoin rises above $112,500, reflecting easing selling pressure among long-term holders.
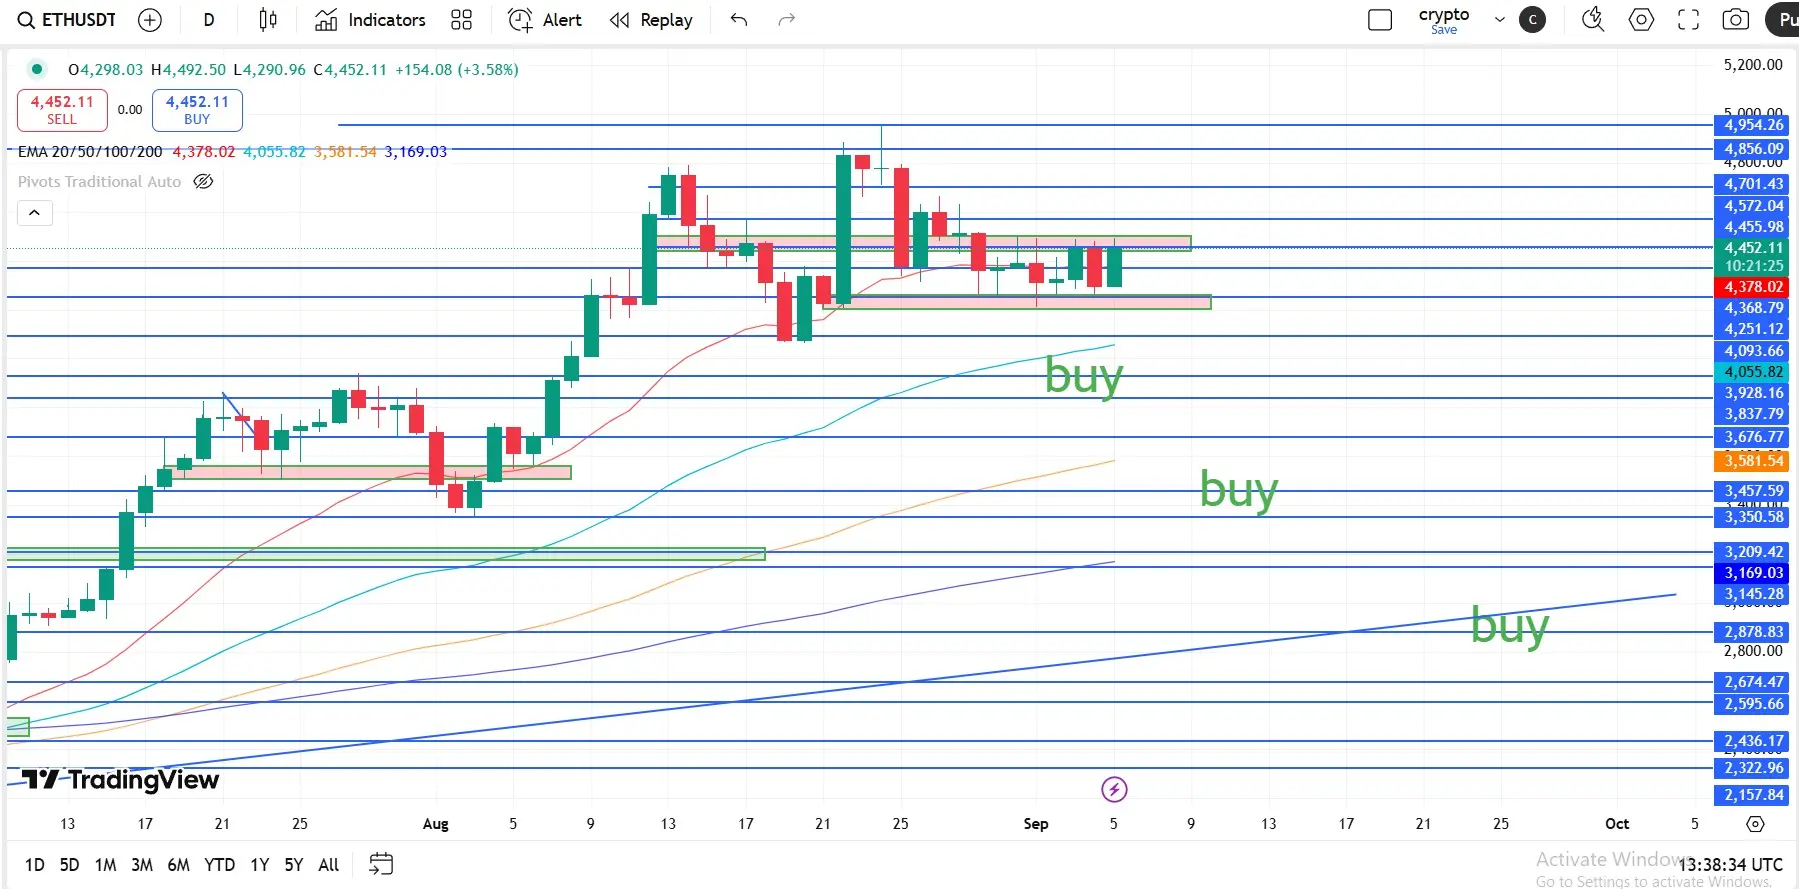
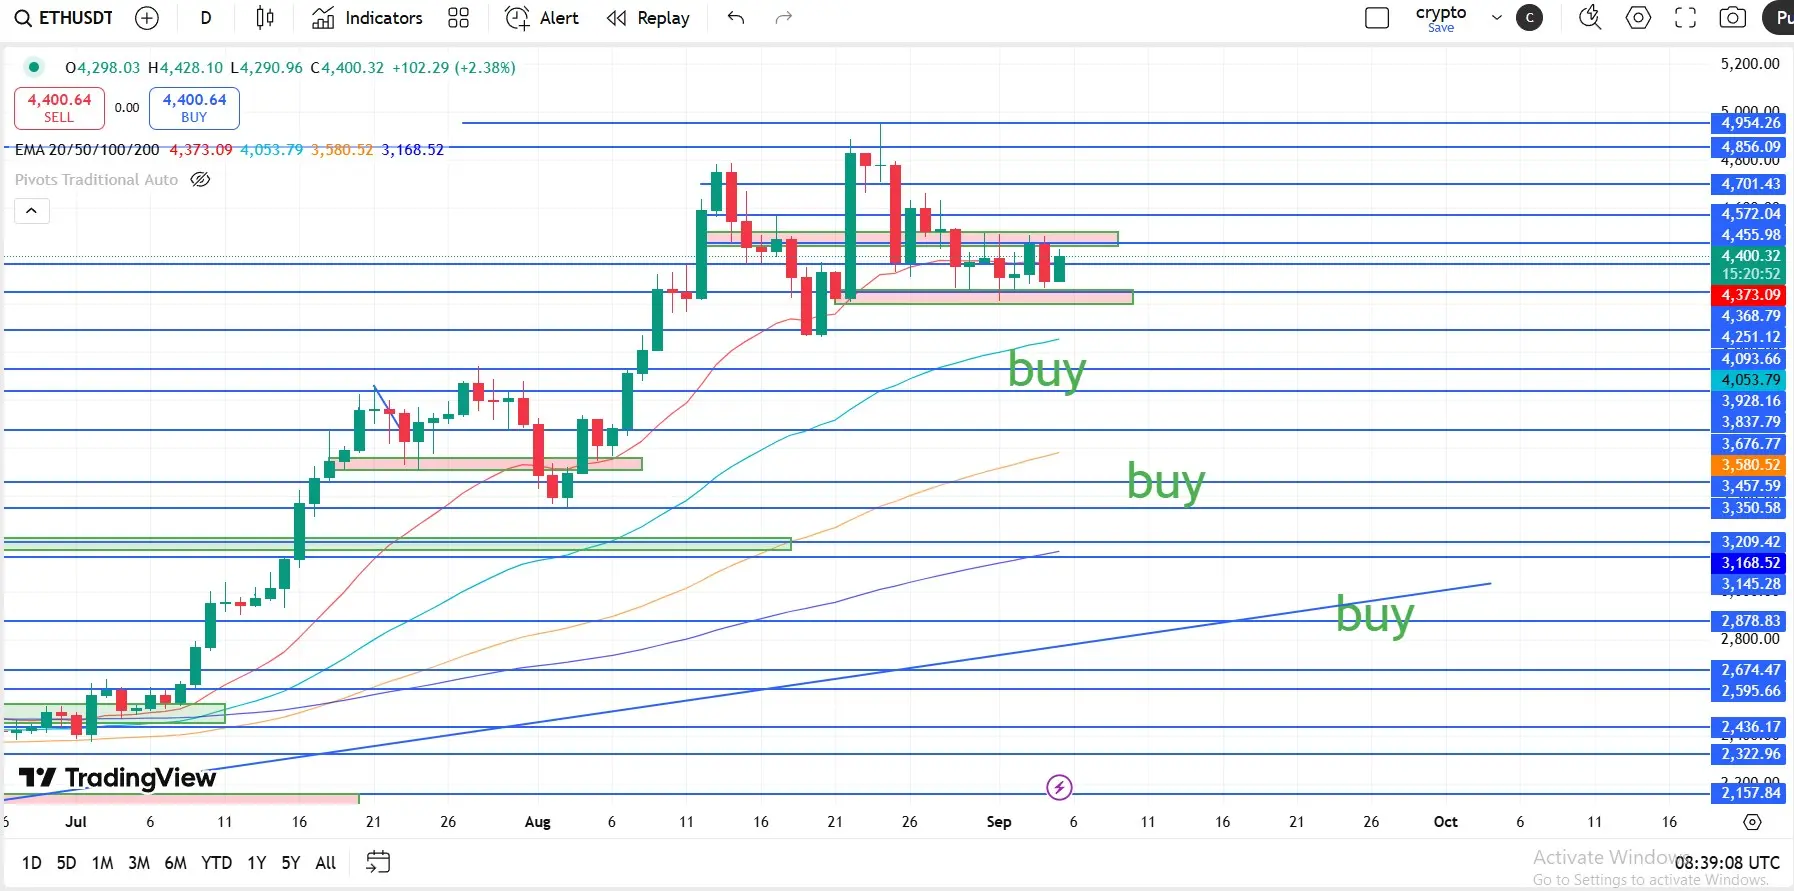
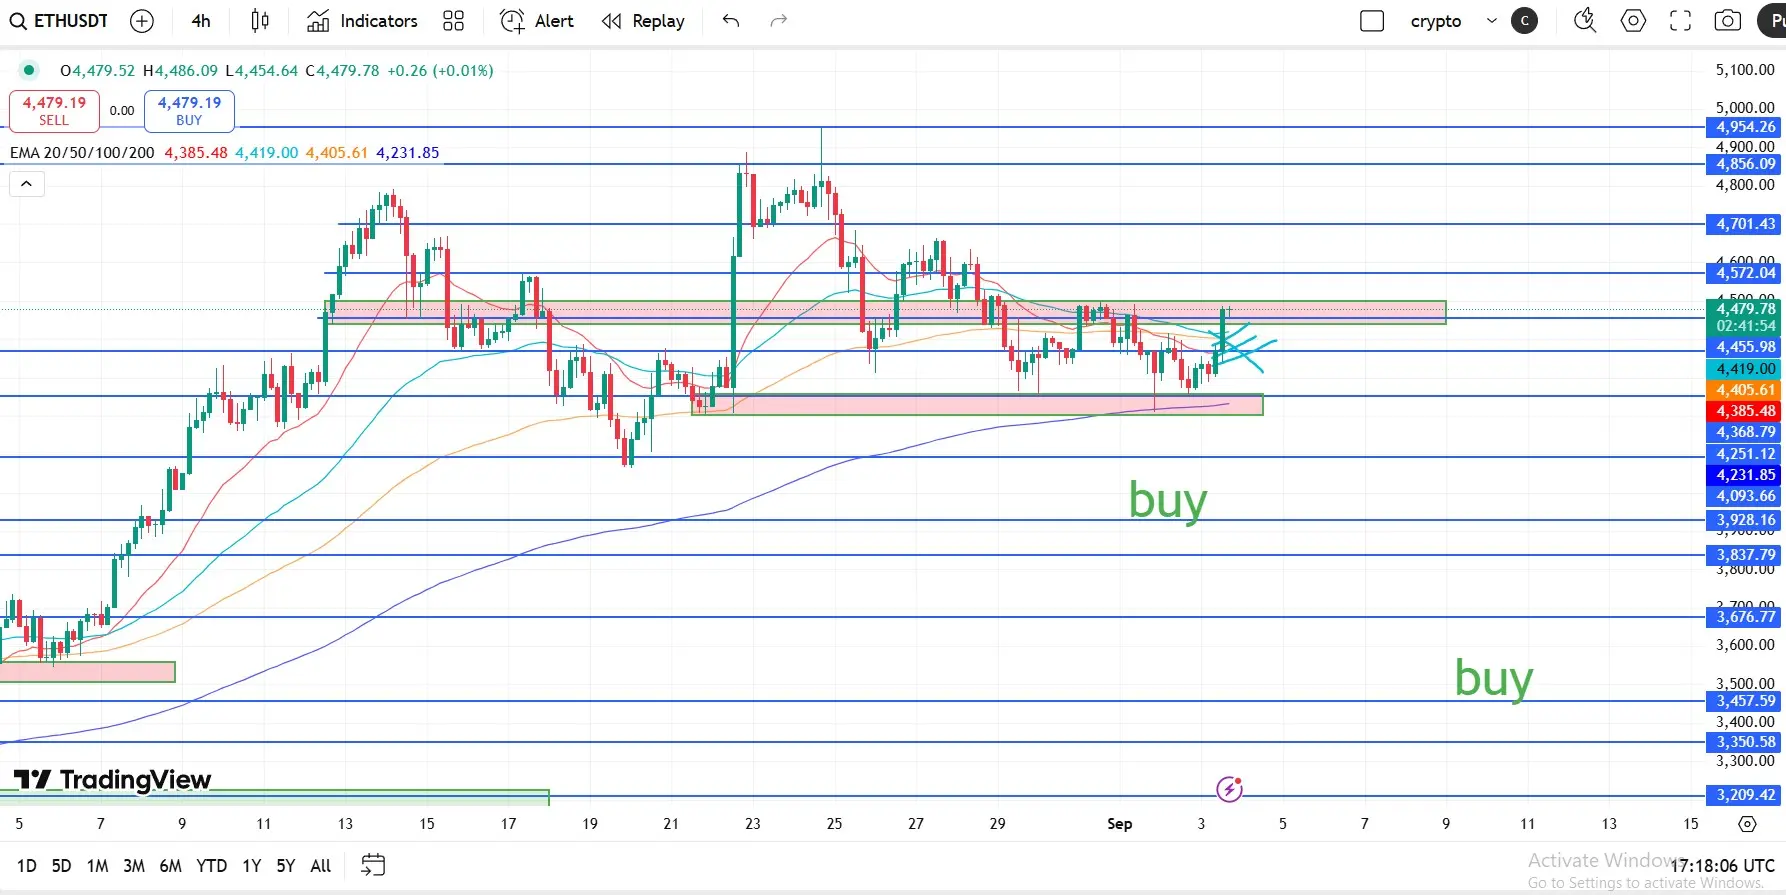
Ethereum rebounds from ascending trendline support, targeting record highs toward $5,000.
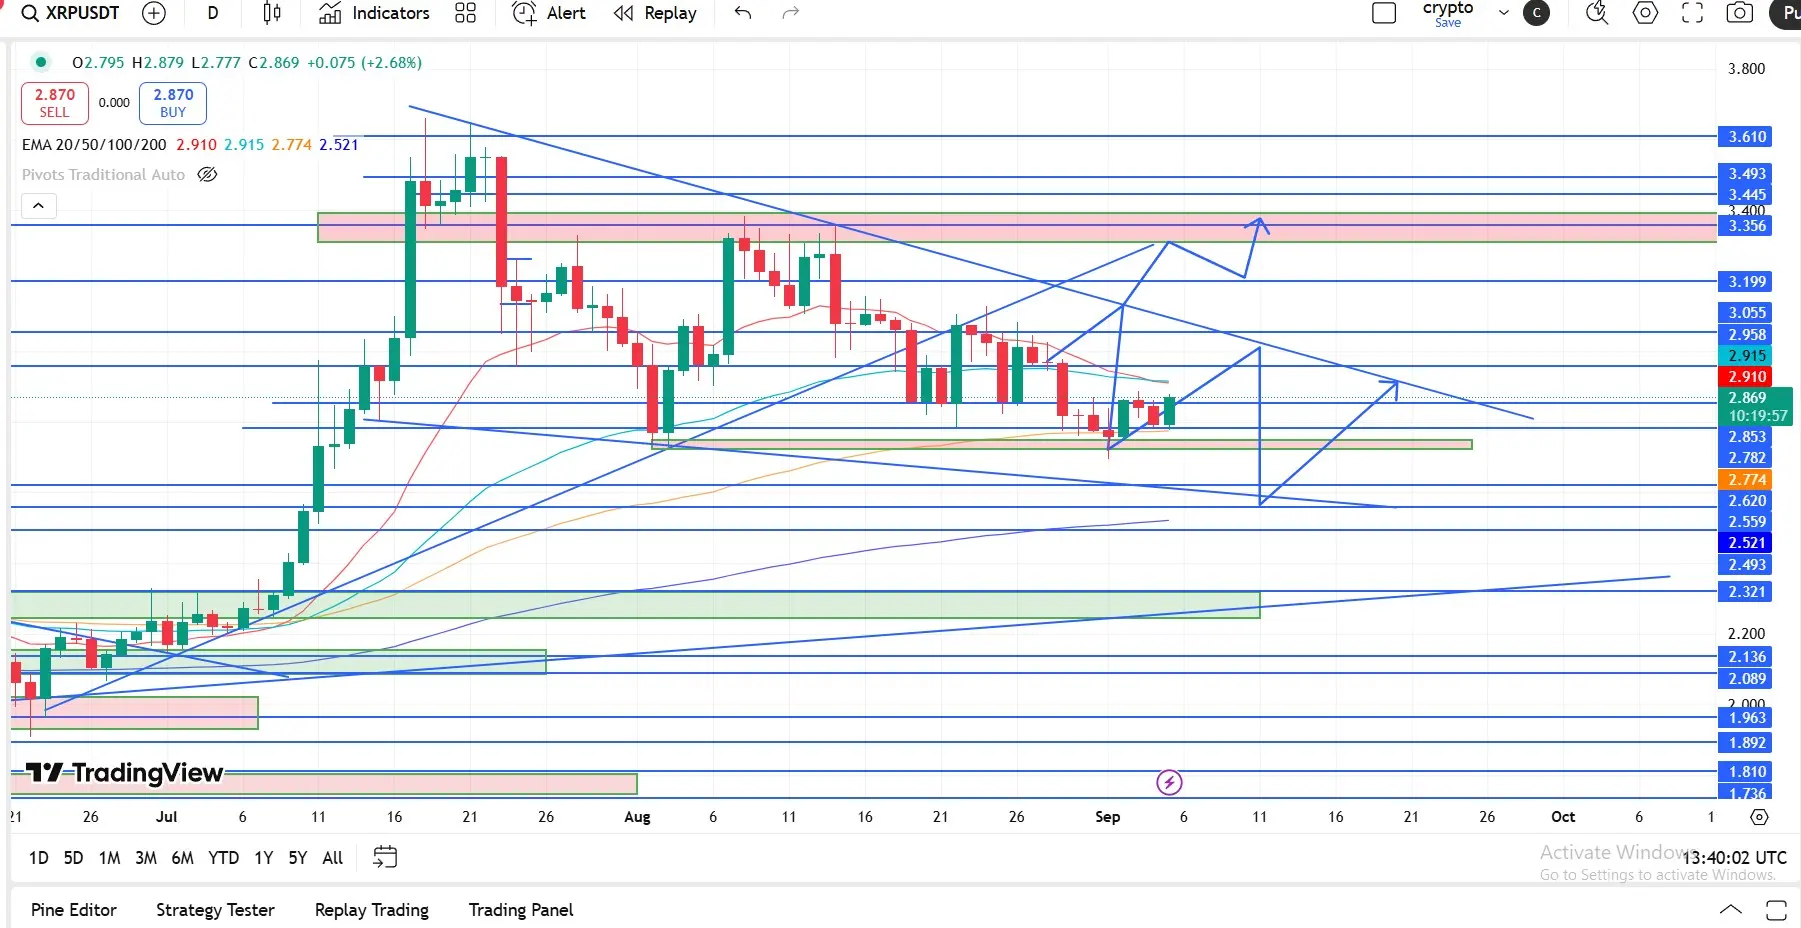
XRP extends sideways trading between the 50-day EMA and the 100-day EMA amid cooling Open Interest.
Cryptocurrency prices are showing signs of recovery on Friday, led by Bitcoin (BTC), which has reclaimed support above $112,000. Altcoins, including Ethereum (ETH) and Ripple (XRP), are edging higher, reflecting easing selling pressur
Bitcoin rises above $112,500, reflecting easing selling pressure among long-term holders.
Ethereum rebounds from ascending trendline support, targeting record highs toward $5,000.
XRP extends sideways trading between the 50-day EMA and the 100-day EMA amid cooling Open Interest.
Cryptocurrency prices are showing signs of recovery on Friday, led by Bitcoin (BTC), which has reclaimed support above $112,000. Altcoins, including Ethereum (ETH) and Ripple (XRP), are edging higher, reflecting easing selling pressur
- Reward
- 10
- 10
- Repost
- Share
Sakura_3434:
Bull Run 🐂View More
Top 3 Price Prediction: Bitcoin, Ethereum, Ripple – BTC, ETH, and XRP consolidate as traders eye key macro data :
Bitcoin price extends its recovery on Friday, having gained nearly 3% so far this week.
Ethereum price has consolidated between the $4,232 and $4,488 levels for over a week, signaling indecisiveness among traders.
Ripple’s XRP finds support around its 100-day EMA at $2.77, eyeing a recovery ahead.
Bitcoin (BTC) price trades in green above $111,000 at the time of writing on Friday, having recovered nearly 3% so far this week. Ethereum (ETH) price consolidates between key levels, whi
- Reward
- 9
- 8
- Repost
- Share
MyCh093:
Watching Closely 🔍View More
World Liberty Financial token risks further losses:
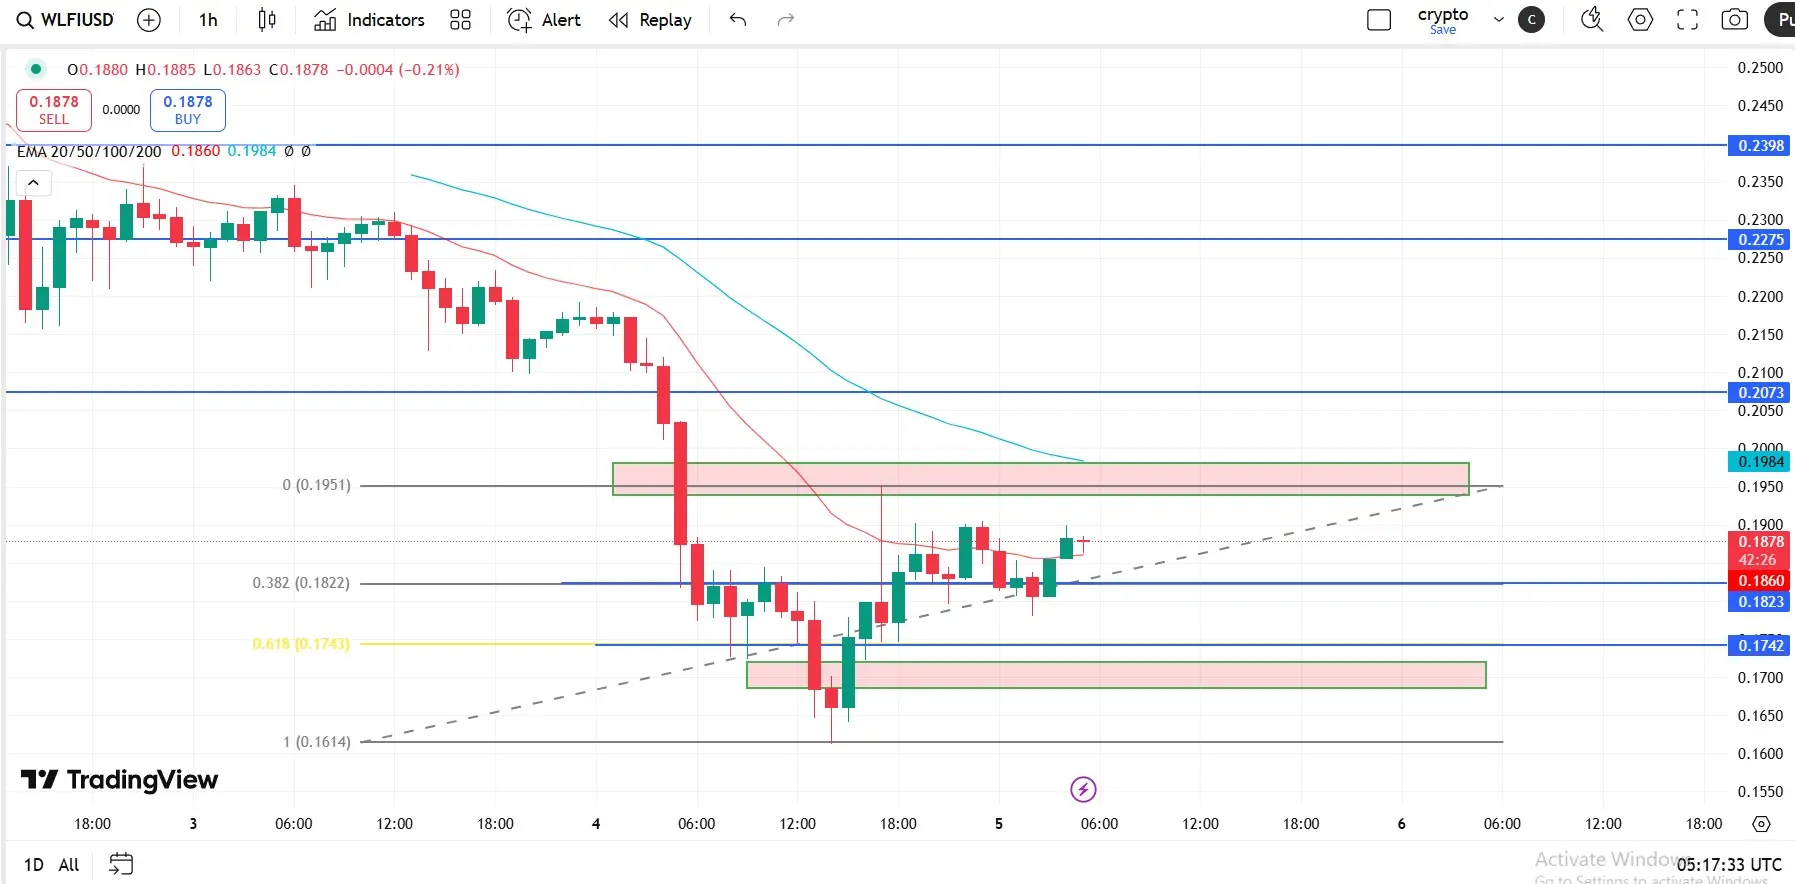
World Liberty Financial token trades below $0.20, extending the downfall for the fourth consecutive day after reaching a record high of $0.47 on Monday. Despite the proposal to buy back and burn tokens with 100% of the WLFI treasury liquidity fees, the token fails to regain strength and has dropped below its listing price on Exchanger.
Support near $0.18; if broken fresh lows. Resistance around $0.20–$0.21, then $0.23 high.
Bears dominate—price likely yoyoing lower unless key resistance levels $0.20–$0.21 are reclaimed.
The Etherscan data h
WLFI19.67%
- Reward
- 2
- 4
- Repost
- Share
Ybaser:
Watching Closely 🔍View More
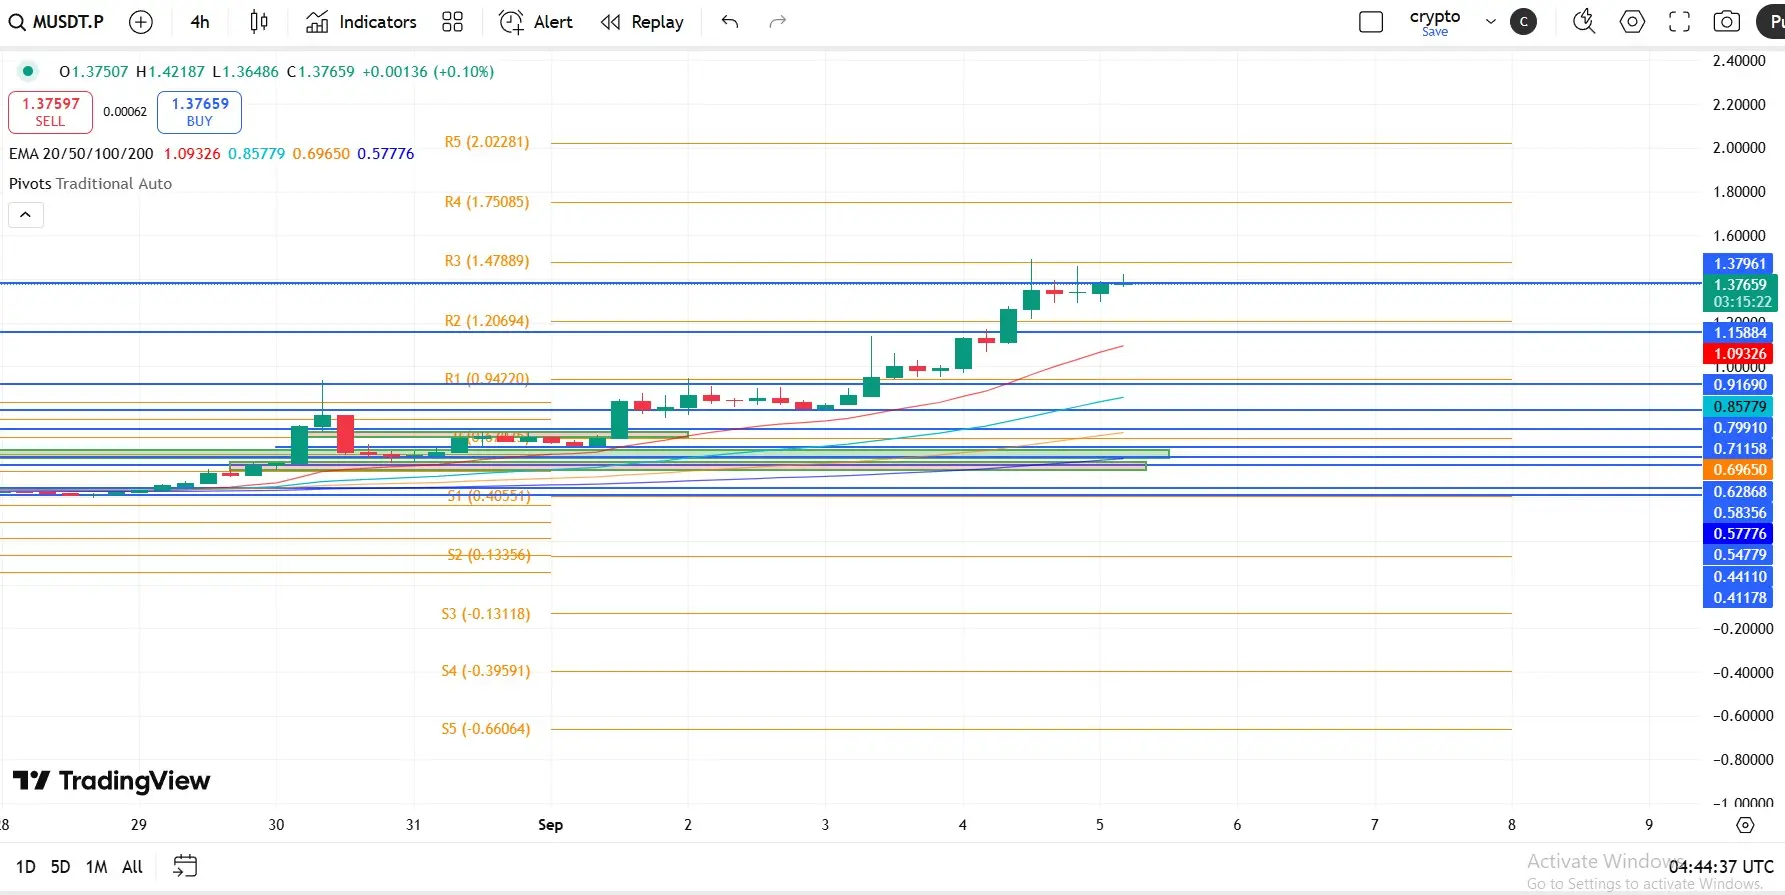
MemeCore hits record high
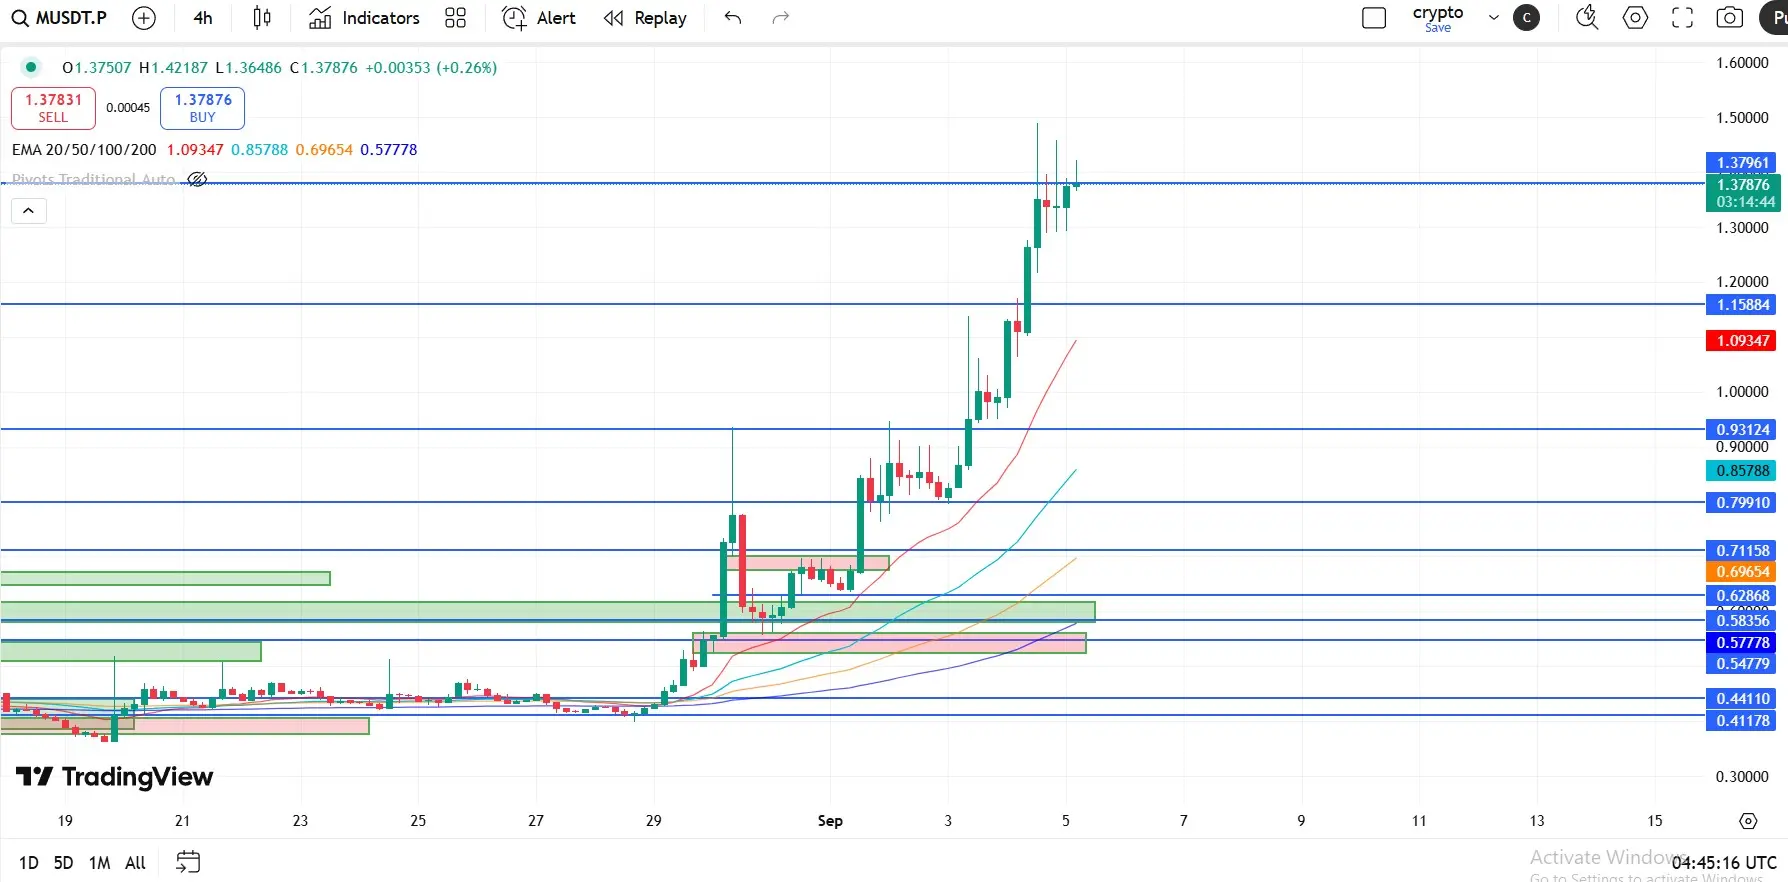
MemeCore edges higher by 1% at press time on Friday, building on the 34% jump from the previous day. The uptrend in the meme coin has expanded for eight days, after reaching a record high of $1.50 on Thursday.
The bullish run faces opposition at the $1.47 level, aligning with the R3 pivot level on the 4-hour chart. A decisive close above this level could stretch the uptrend to $1.75, aligning with the R4 pivot level.
The momentum indicators on the same chart indicate a bullish bias as the Moving Average Convergence Divergence (MACD) and its signal line extend the up
- Reward
- 2
- 6
- 1
- Share
Sakura_3434:
HODL Tight 💪View More
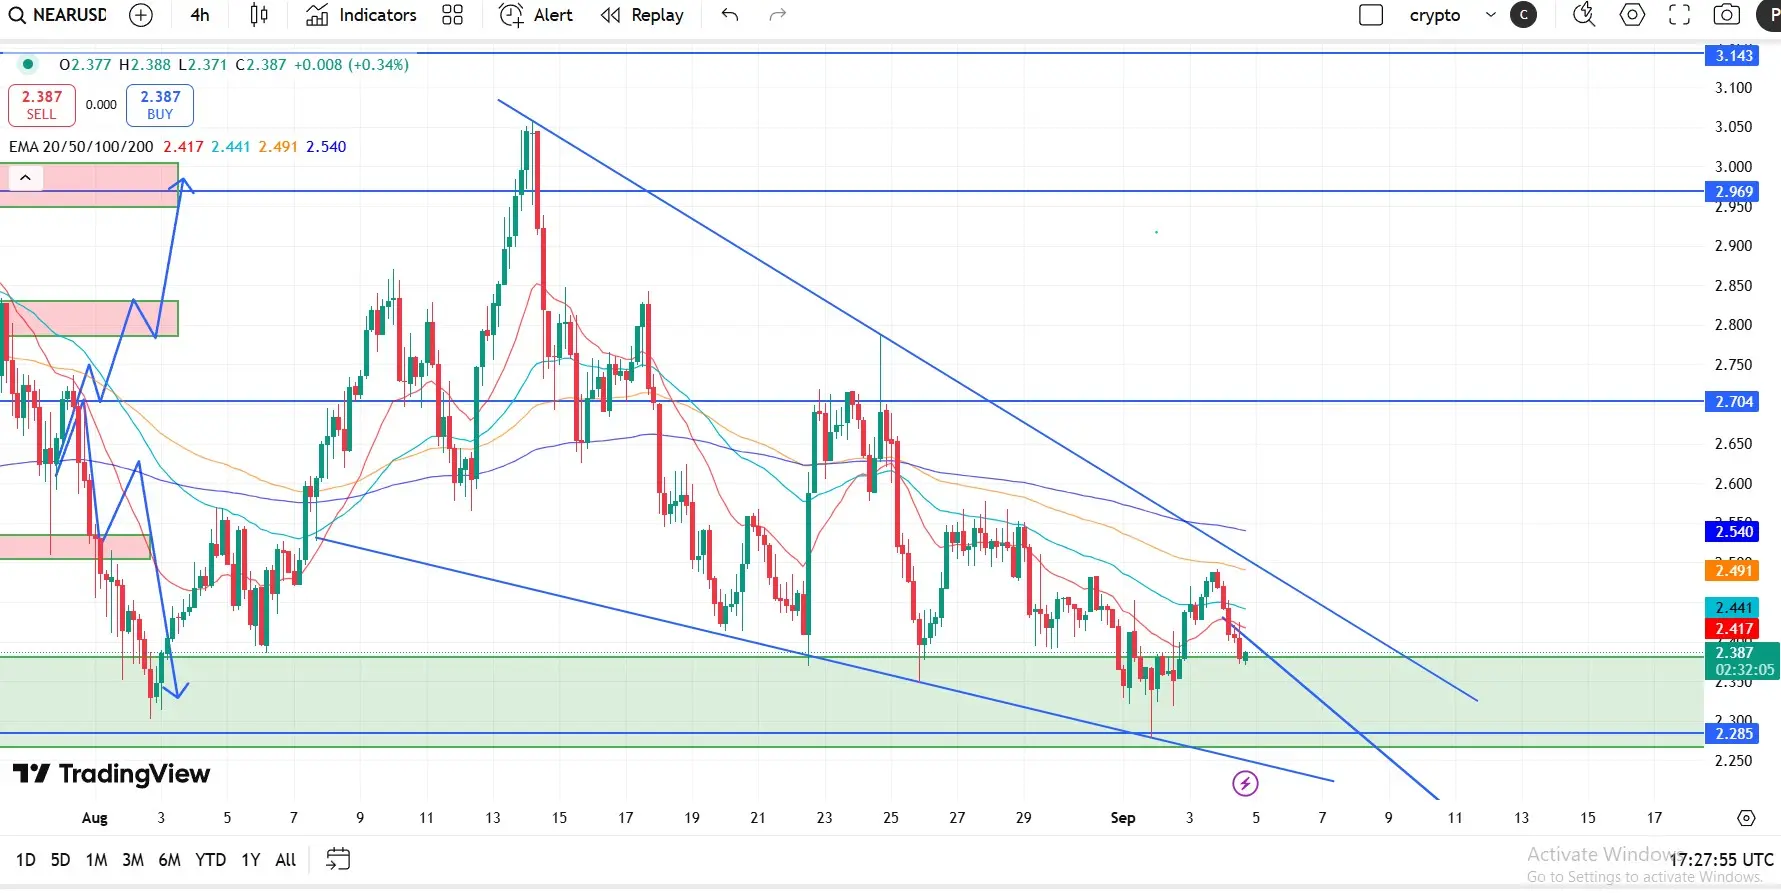
Near Protocol partners with Aptos for cross-chain swaps as NEAR eyes 20% breakout :
Near Protocol consolidates above $2.40 short-term support with bulls preparing for a falling wedge pattern breakout.
Near Protocol and Aptos launch cross-chain swap, eliminating the need for bridges.
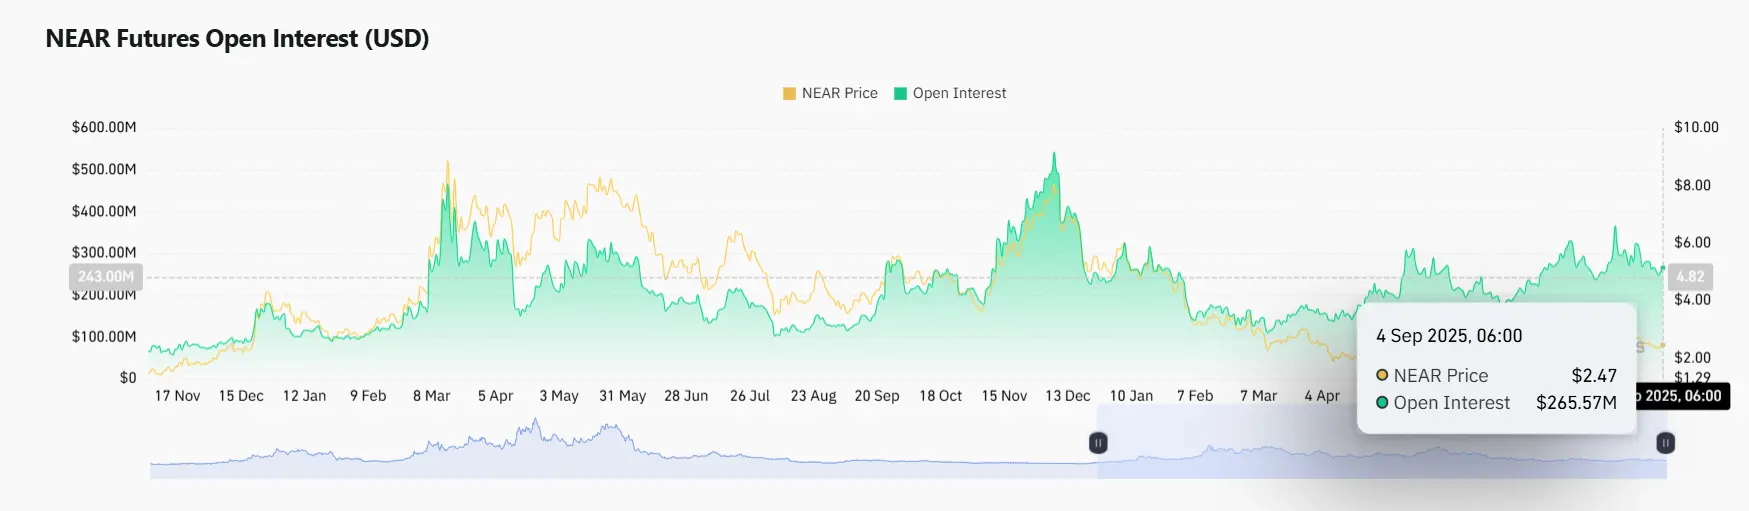
The NEAR futures Open Interest rebounds to $265 million, as risk-on sentiment builds.
Near Protocol (NEAR), the second-largest Artificial Intelligence (AI) token, is trading above $2.40 on Thursday. The AI token faces growing headwinds amid risk-off sentiment in the broader cryptocurrency market. Still, network dev
Near Protocol consolidates above $2.40 short-term support with bulls preparing for a falling wedge pattern breakout.
Near Protocol and Aptos launch cross-chain swap, eliminating the need for bridges.
The NEAR futures Open Interest rebounds to $265 million, as risk-on sentiment builds.
Near Protocol (NEAR), the second-largest Artificial Intelligence (AI) token, is trading above $2.40 on Thursday. The AI token faces growing headwinds amid risk-off sentiment in the broader cryptocurrency market. Still, network dev
- Reward
- 8
- 8
- Repost
- Share
Sakura_3434:
HODL Tight 💪View More
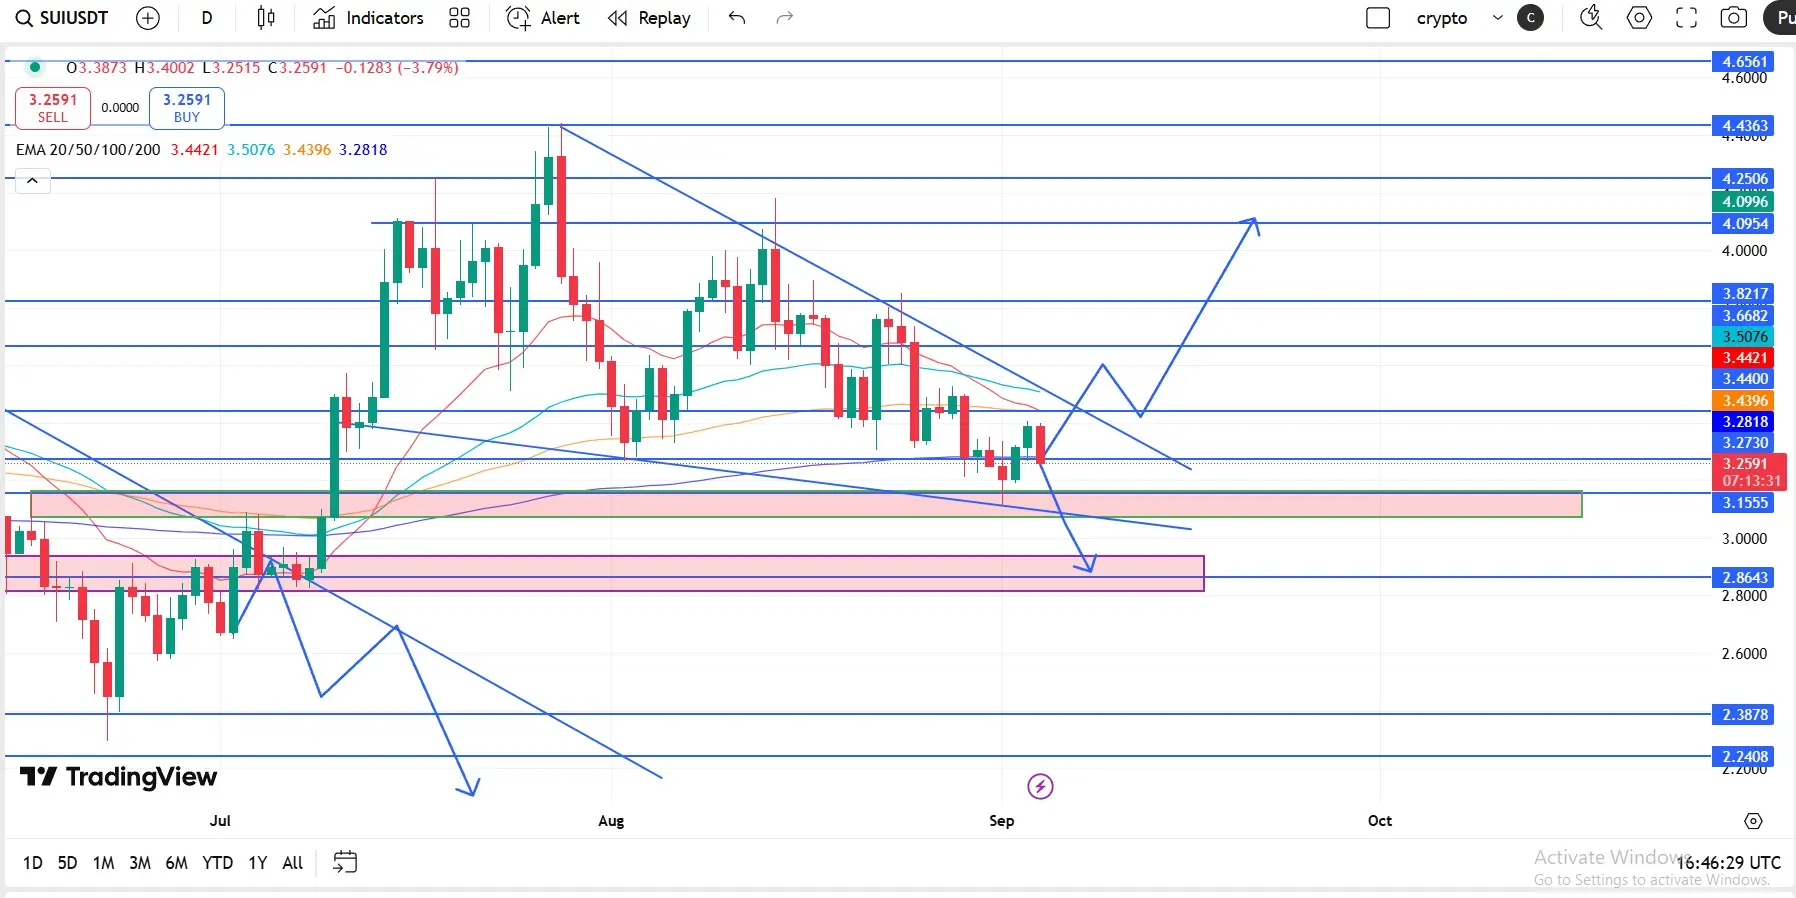
Sui Price Forecast: SUI could rally if it breaks above the falling wedge pattern:
Sui price trades within the falling wedge pattern (drawn by connecting multiple highs and lows with two trendlines since mid-July). A breakout of this pattern generally favors the bulls. SUI price found support around its 50% price retracement level at $3.08, which roughly coincides with the lower trendline boundary of the wedge pattern on Monday and recovered 6% in the next two days. At the time of writing on Thursday, it trades around $3.34.
If SUI breaks above the upper boundary of the wedge pattern and closes
- Reward
- 13
- 12
- Repost
- Share
Sakura_3434:
Just do it 💪View More
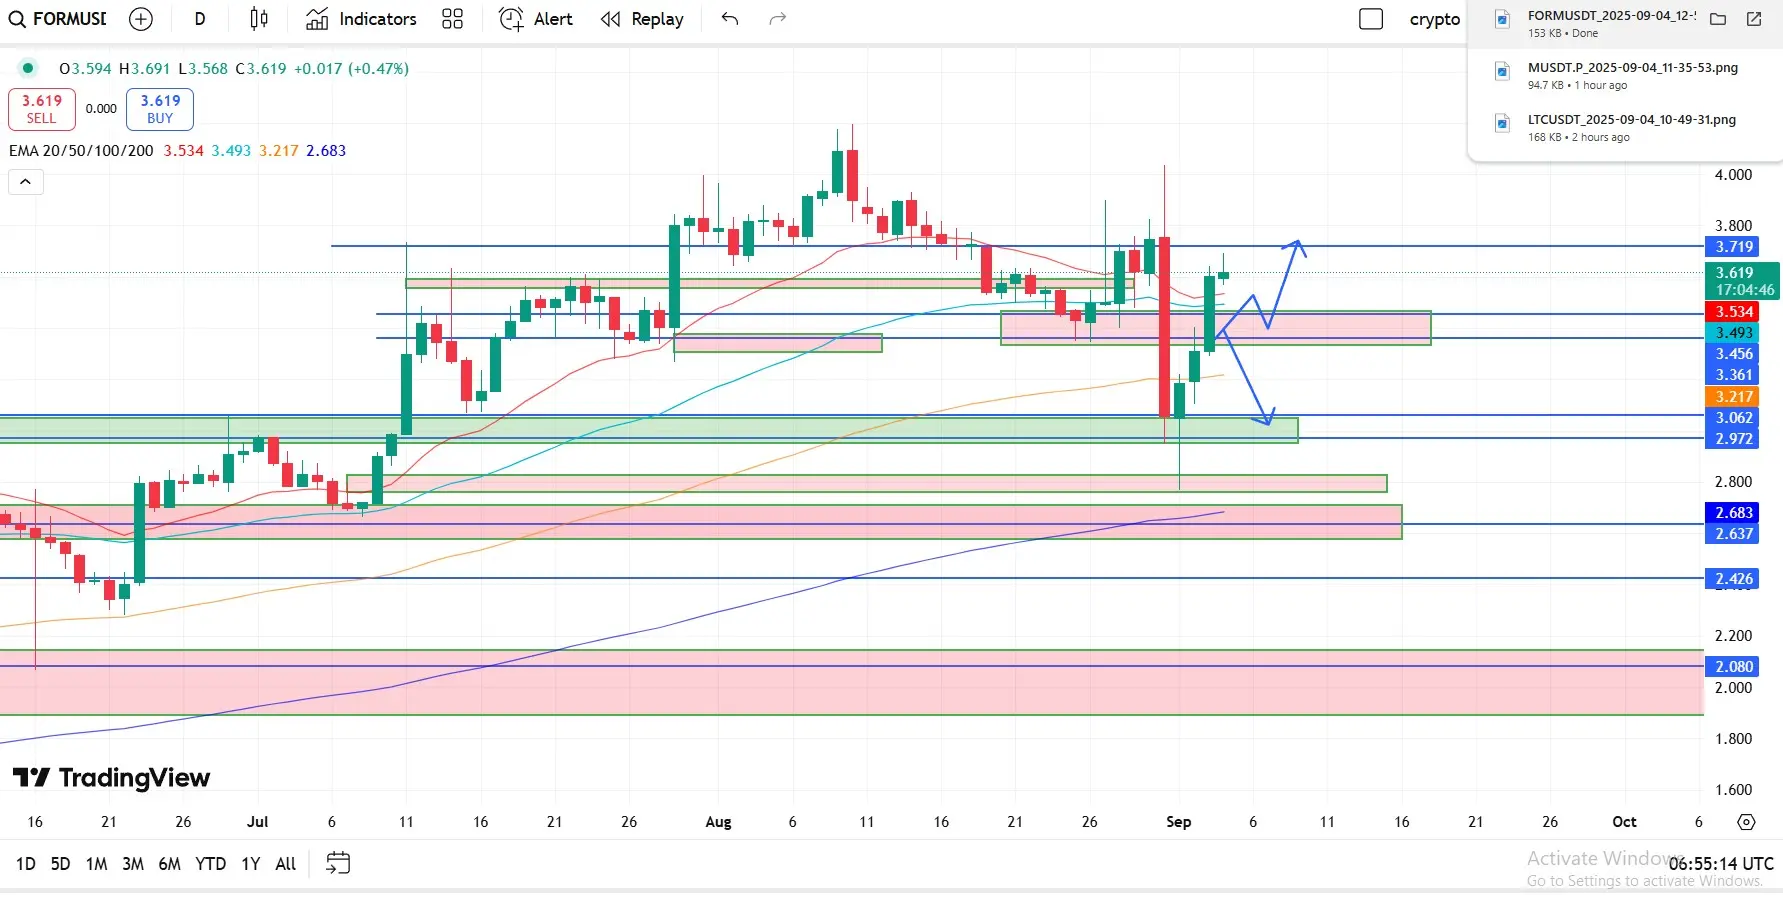
FORM (Four) recovery rally targets the $4 level :
FORM (Four) trades above the $3.50 level, extending the uptrend for the fourth consecutive day with a 2% rise, at the time of writing on Thursday. The GameFi token exhibits a V-shaped recovery run after the 18% drop on Sunday.
A clean push above $3.75 to recover from Sunday’s loss could extend the rally to $4.00 round figure.
The RSI at 53 on the daily chart has crossed above the midpoint line, indicating an increase in buying pressure. Additionally, the MACD line converges with its signal line, reflecting a bullish shift in trend momentum.
- Reward
- 7
- 4
- Repost
- Share
Ryakpanda:
Steadfast HODL💎View More
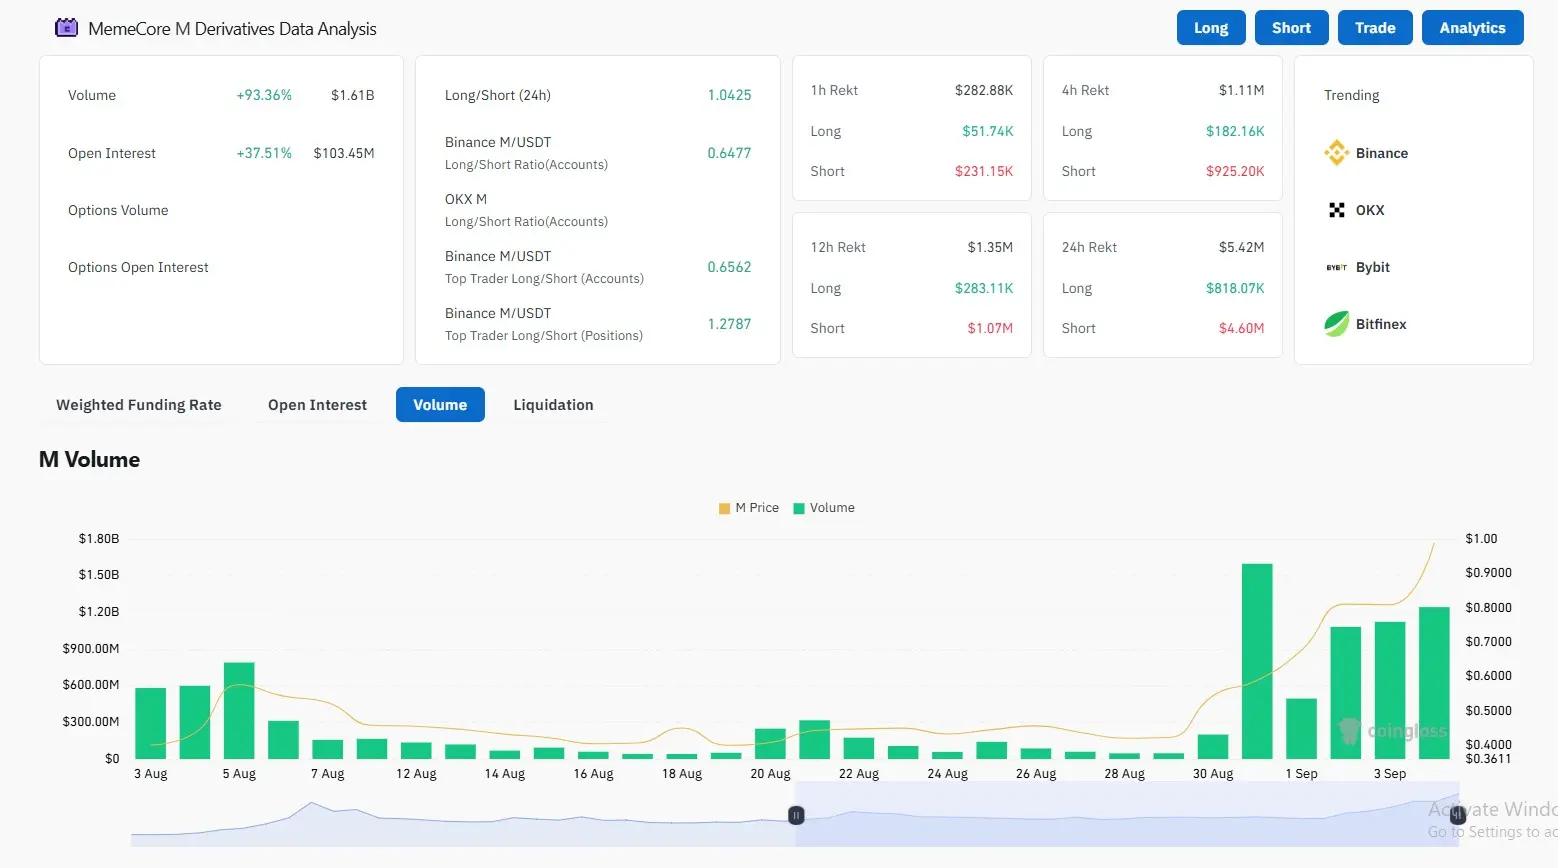
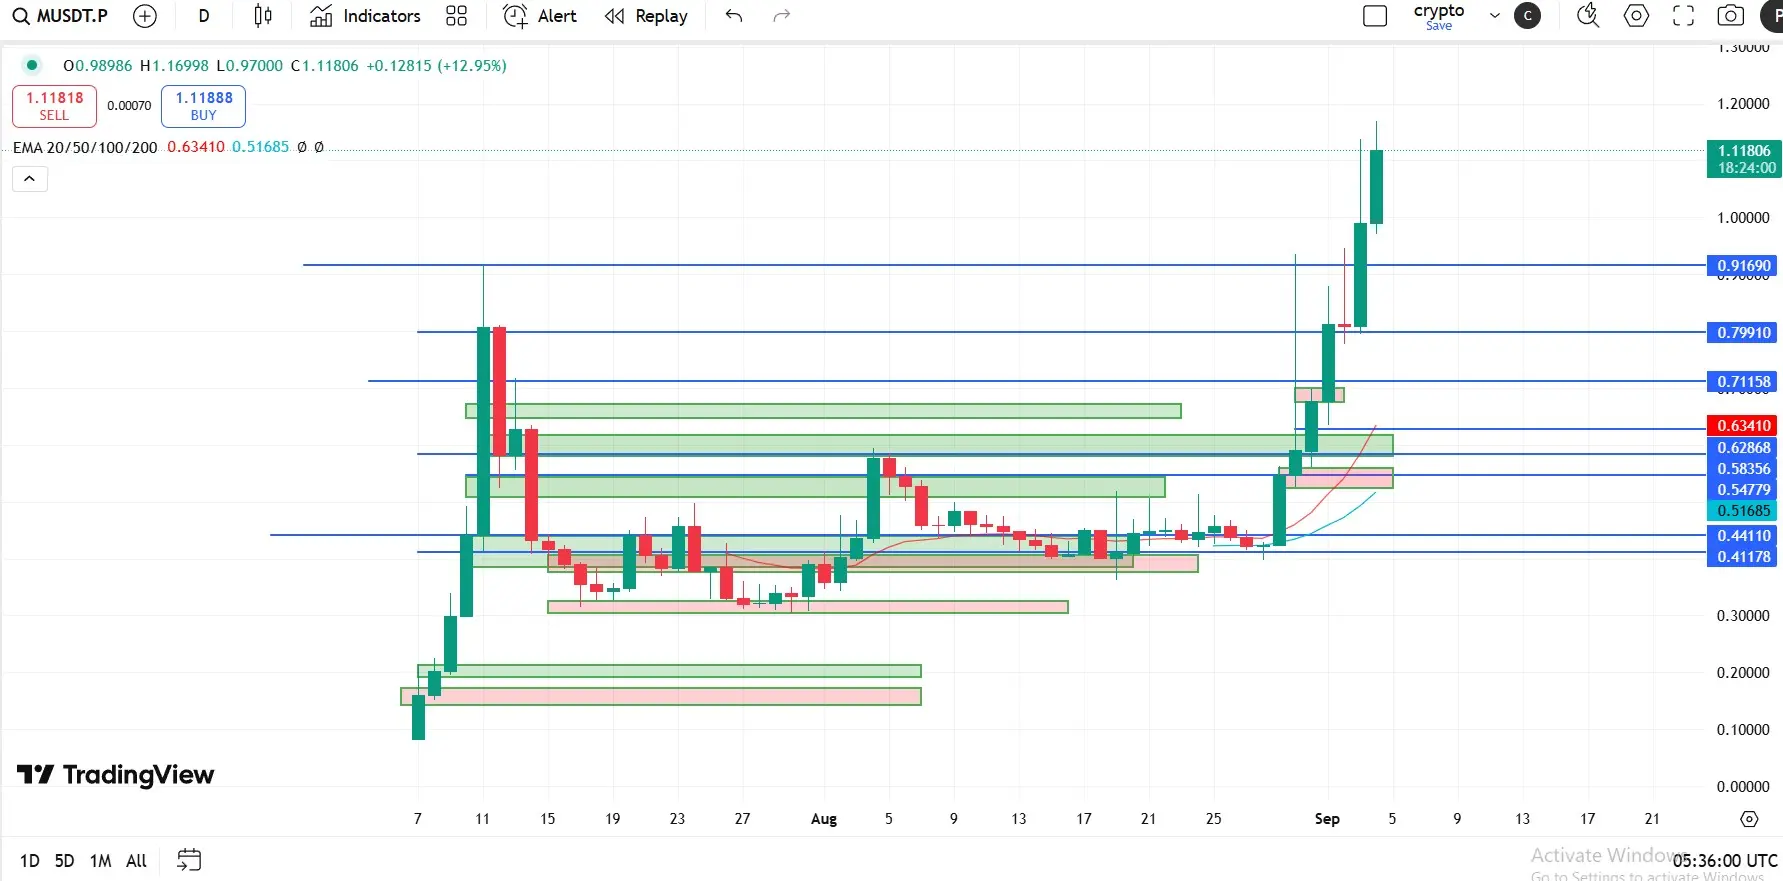
MemeCore holds above $1, targeting a new record high
MemeCore edges higher by 4% at press time on Thursday, extending the uptrend for the sixth day. The meme coin has shed minor gains after marking a record high of $1.14 on Wednesday.
Still, MemeCore holds dominance over the $1.00 psychological level and challenges the $1.07 resistance, marked by the R1 pivot resistance on the 4-hour chart. To extend the rally towards the R2 pivot resistance level at $1.47, the M token should mark a decisive close above the $1.07 level.
Adding to the optimism, the CoinGlass data reflected that MemeCore's Ope
- Reward
- 7
- 3
- Repost
- Share
You:
yesterday $M, MemeCore really done a marvelous pump and was available on almost All the tickers of crypto exchanges.View More
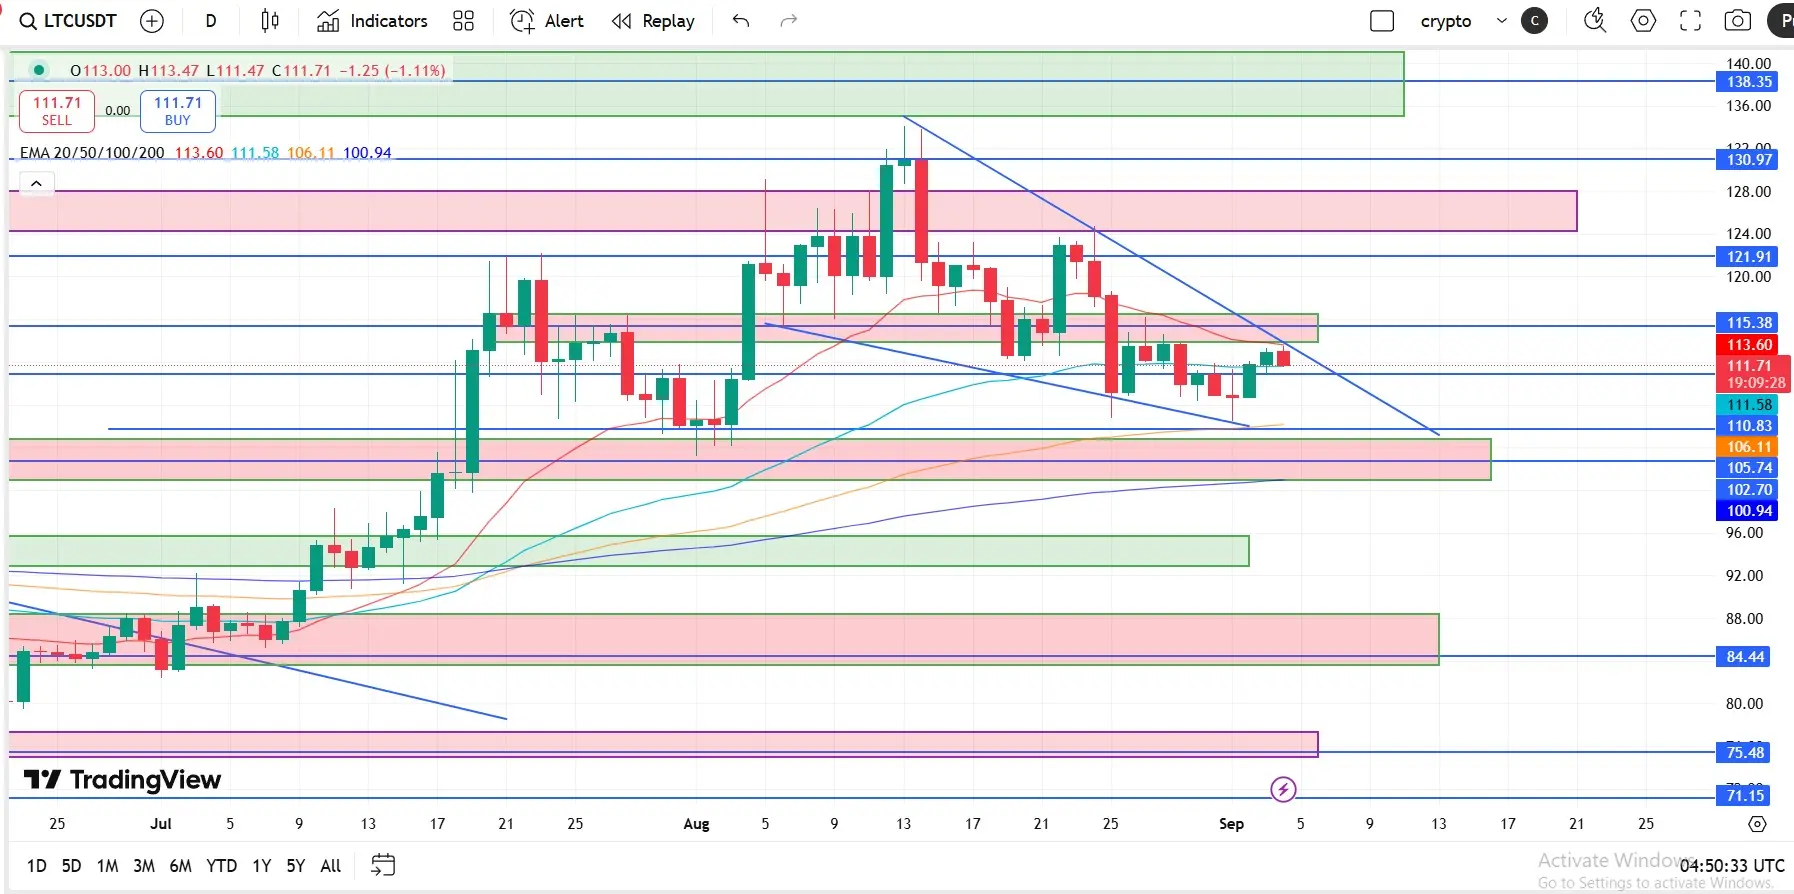
Litecoin Price Forecast: LTC could rally if it breaks above the falling wedge pattern
Litecoin price trades within the falling wedge pattern (drawn by connecting multiple highs and lows with two trendlines since early August). A breakout of this pattern generally favors the bulls. LTC price found support around its 100-day EMA at $106.13 on Monday and recovered 4% in the next two days. At the time of writing on Thursday, it trades around $112.54.
If LTC breaks above the upper boundary of the wedge pattern, it could extend the rally toward its August 14 high of $134.29.
The Relative Strength In
- Reward
- 8
- 7
- Repost
- Share
TheWorldOfDigitalCur:
The bullish market is at its peak 🐂View More
Crypto Today: Bitcoin, Ethereum, XRP extend consolidation as sentiment, institutional demand cools :
Bitcoin price breaks above a short-term descending channel, but sideways trading persists.
Ethereum traders near the range low as US ETFs extend outflows for two consecutive days.
XRP attempts recovery, but slows under the 50-period EMA on the 4-hour chart.
Bitcoin (BTC) struggles to hold $111,000 on Wednesday, following a breakout above a short-term descending channel. Despite several attempts to push higher, cooling market sentiment and low institutional demand continue to suppress price move
- Reward
- 13
- 10
- Repost
- Share
TheWorldOfDigitalCur:
1000x atmosphere coming 🤑View More
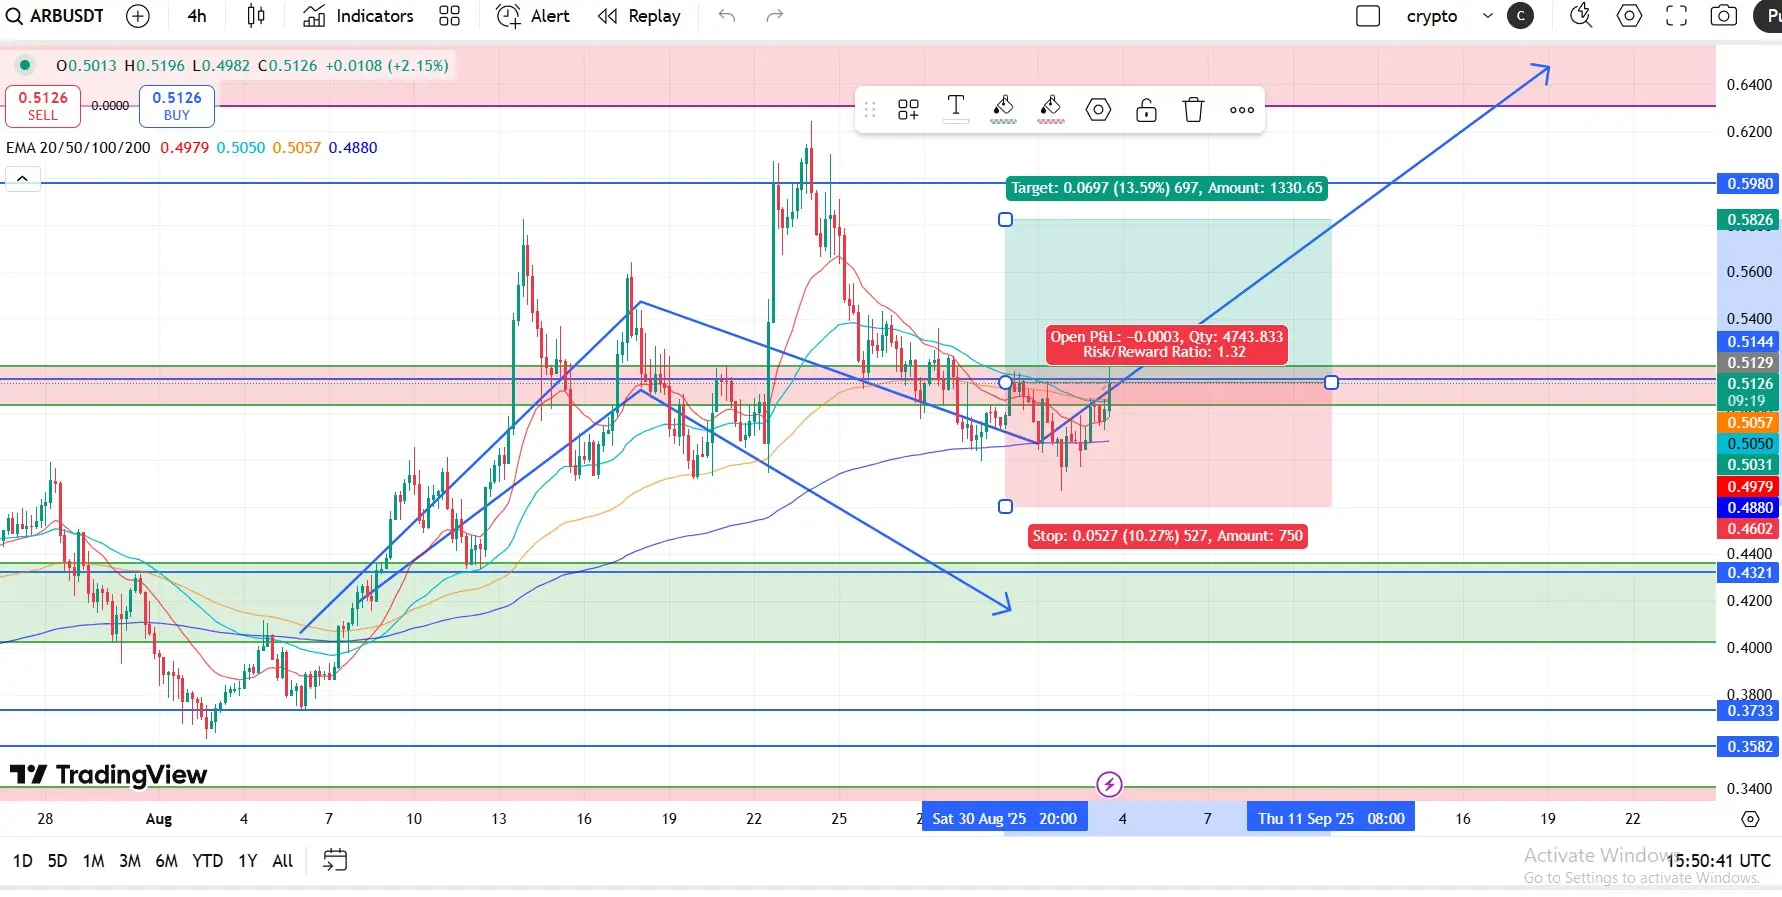
Arbitrum Price Forecast: ARB pares losses as network rolls out $40 million DeFi incentive :
Arbitrum gains bullish momentum, increasing the chances of a 16% breakout to $0.58 resistance.
Arbitrum launches a $40 million DeFi incentive program to reward targeted user actions.
The DeFi program is designed to span four seasons, starting with lending markets.
Arbitrum (ARB) price is poised for a breakout, trading above $0.50 on Wednesday. Renewed investor optimism in the broader cryptocurrency market and the launch of a Decentralized Finance (DeFi) incentive program, back ARB’s short-term bullish o
- Reward
- 10
- 5
- Repost
- Share
KatyPaty:
HODL Tight 💪View More
Pi Network holds at crucial support :
Pi Network holds above $0.3400, securing the gains from Tuesday. The largest KYC-based crypto project prevails a path of least resistance on the downside, risking the $0.3220 support, marked by the record low on August 1.
Still, the steady uptrend in the Relative Strength Index (RSI) reaching 43, indicates a bullish divergence with the price action taking multiple support from the area above $0.3220.
To reinforce an uptrend, the Supertrend indicator warrants a decisive close above its red line at $0.4100. This would mark a clear breakout from the falling
- Reward
- 9
- 7
- Repost
- Share
KatyPaty:
HODL Tight 💪View More