
Date: Sat, Jan 03, 2026 | 06:50 PM GMT
As 2026 kicks off, the broader cryptocurrency market is showing renewed stability. Ethereum (ETH) has reclaimed the $3,100 mark, and momentum is gradually spreading across major altcoins — including Bittensor (TAO).
TAO is trading around 3% higher on the day, extending its weekly gains to nearly 14%. While the short-term strength is encouraging, the more important development lies in the structure forming on the chart. Recent price action suggests a meaningful shift in market behavior — one that could signal the early stages of a bullish continuation if key levels are reclaimed.
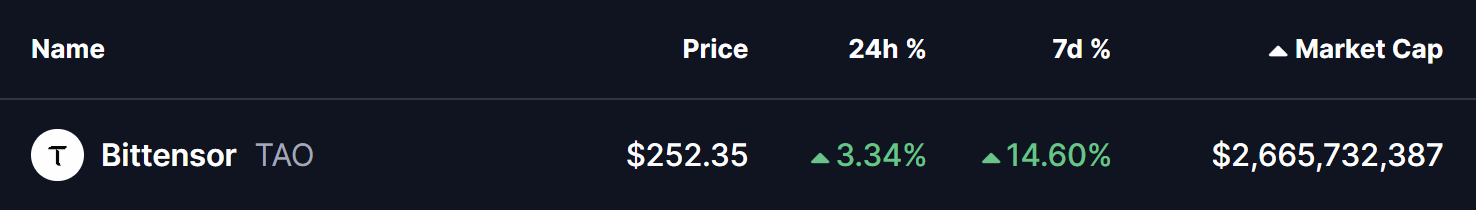
Source: Coinmarketcap
Rounding Bottom Pattern Takes Shape
On the 4-hour timeframe, Bittensor appears to be forming a rounding bottom pattern, a classic bullish reversal structure that typically develops after an extended corrective phase. This pattern reflects a gradual transition from distribution to accumulation, where selling pressure fades and buyers begin to step in more consistently.
The setup began after TAO faced a firm rejection near the $315 neckline resistance, which triggered a sharp decline through late November and December. That move eventually found strong demand near the $206 support zone, where selling momentum stalled. Multiple defenses of this level prevented any deeper breakdown and helped establish a solid base for a potential trend reversal.
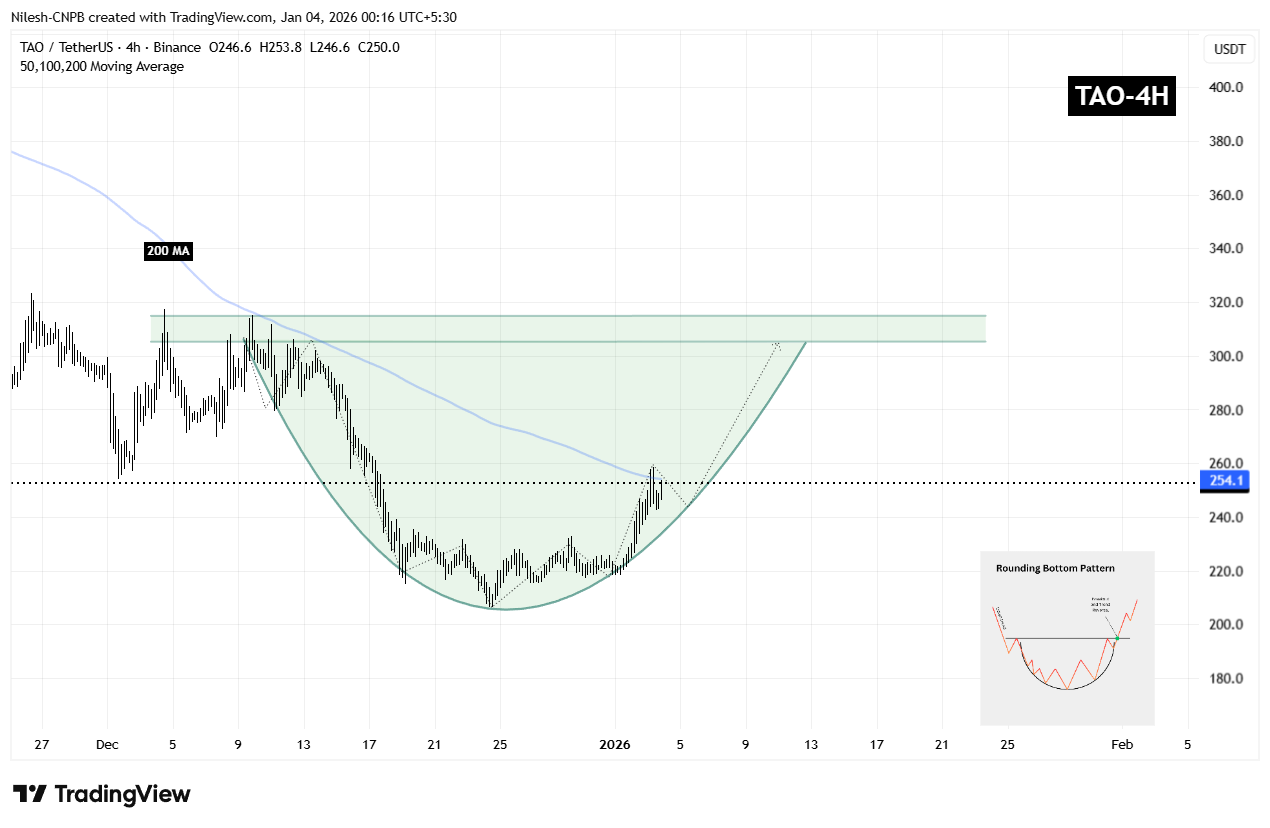
Bittensor (TAO) 4H Chart/Coinsprobe (Source: Tradingview)
Since carving out that bottom, TAO has started to curve higher in a smooth, rounded fashion — closely matching the textbook structure of a developing rounding bottom. The recent recovery has also brought price back toward the 200-period moving average near $254, a level that previously acted as resistance and is now being tested as potential support.
What’s Next for TAO?
If TAO manages to hold above the 200 MA, that level could act as short-term support and provide a foundation for further upside attempts. A clean breakout above the $315 resistance zone, followed by sustained acceptance above it, would validate the entire reversal structure and likely open the door for a broader bullish expansion phase, with momentum traders re-entering the market.
Until that breakout occurs, the pattern remains in development. Short-term consolidation or shallow pullbacks remain possible, particularly as price digests recent gains. However, as long as TAO continues to maintain higher lows above the established base, the broader bottoming structure remains intact and constructive.
For now, the chart suggests that TAO is approaching a critical confirmation phase — one that could determine whether this recovery evolves into a sustained bullish trend as the new year unfolds.
Disclaimer: The views and analysis presented in this article are for informational purposes only and reflect the author’s perspective, not financial advice. Technical patterns and indicators discussed are subject to market volatility and may or may not yield the anticipated results. Investors are advised to exercise caution, conduct independent research, and make decisions aligned with their individual risk tolerance.
About Author: Nilesh Hembade is the Founder and Lead Author of Coinsprobe, with over 5 years of experience in the cryptocurrency and blockchain industry. Since launching Coinsprobe in 2023, he has been providing daily, research-driven insights through in-depth market analysis, on-chain data, and technical research.
Disclaimer: The information on this page may come from third parties and does not represent the views or opinions of Gate. The content displayed on this page is for reference only and does not constitute any financial, investment, or legal advice. Gate does not guarantee the accuracy or completeness of the information and shall not be liable for any losses arising from the use of this information. Virtual asset investments carry high risks and are subject to significant price volatility. You may lose all of your invested principal. Please fully understand the relevant risks and make prudent decisions based on your own financial situation and risk tolerance. For details, please refer to
Disclaimer.
Related Articles
TRUMP Token Whales Hit Five-Month High, Trump Dinner Effect Drives 36% Surge
Trump meme coin TRUMP surged approximately 36% following the announcement of an exclusive dinner event, with whale holdings reaching a five-month high. Large holders are actively increasing positions, but losses are also present in the market, indicating divergent investment behavior. Controversy sparked by political criticism may have limited impact on market performance, but regulatory investigation risks remain a concern to monitor.
MarketWhisper25m ago
Bitcoin Spot ETF Saw $760 Million in Inflows Last Week! But Whether the Rally Continues Requires Monitoring 3 Key Factors
US cryptocurrency spot ETFs showed a significant rebound last week, with Bitcoin and Ethereum recording net inflows of approximately $763.4 million and $160.9 million respectively, with prices bouncing back accordingly. Although the market is showing incremental buying signals, it still faces variables from central bank policies and geopolitical risks in the future. The market will continue to monitor ETF capital inflows and macroeconomic impacts.
CryptoCity39m ago
Market rally continues! Bitcoin returns to $75,000 level, ETF inflows persist
Bitcoin broke through $74,000 on March 16 as institutional capital flowed back into the market, with ETF net inflows reaching $1 billion, shifting market sentiment to bullish. Analysts predict Bitcoin could reach $80,000, but it is currently in a consolidation phase. $75,000 is a key resistance level; a breakout could lead to a test of $90,000, otherwise it risks a pullback.
区块客47m ago
MICA Daily | BTC Stable Above 30-Day Moving Average, Continues to Show Bullish Outlook
According to Binance data, Bitcoin's moving average convergence divergence indicator shows significant improvement in its price trend structure, with current trading price around $73,000, and moving averages in a divergent state, reflecting a market transition phase. Technical analysis indicates that the 30-day moving average is of high importance; if the price maintains above this moving average, it indicates buying support, otherwise it may enter a correction phase. Investors will judge the trend based on changes in moving averages.
区块客50m ago
Bitcoin Surges Toward $75,000: $600 Million Short Liquidations Drive Rally, ETF Inflows Emerge as Key Variable
On March 17, Bitcoin tested the 75,000 US dollar level driven by short liquidations, briefly reaching 75,653 US dollars before retreating. This rally was accompanied by massive liquidations totaling approximately 609 million US dollars in 24 hours, with shorts accounting for a significant proportion. Market sentiment has recovered somewhat, with capital inflows into spot demand and ETF support driving Bitcoin's rally. Future price movements will be influenced by sustained capital inflows and macroeconomic data.
GateNews1h ago
