
Date: Sat, Dec 27, 2025 | 10:25 AM GMT
Dash (DASH), the privacy-focused token, has struggled alongside the broader altcoin market over the past month, shedding nearly 35% of its value amid persistent selling pressure. However, price action is now starting to stabilize, with DASH trading in the green today and posting a modest 4% recovery. More importantly, the latest chart structure suggests that the recent rebound may not be just a short-lived bounce, but part of a developing bullish setup.
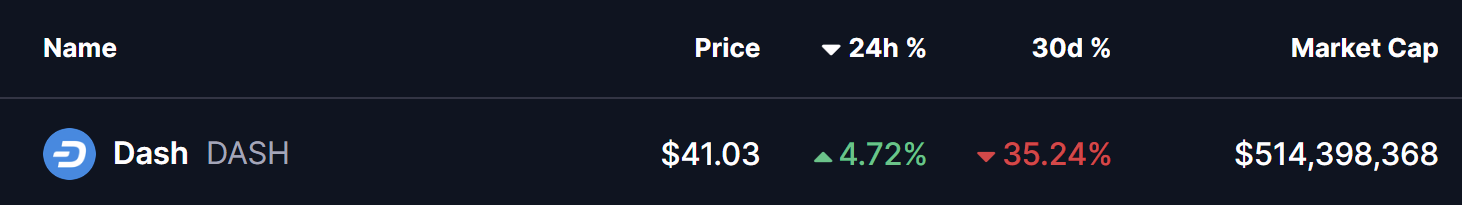
Source: Coinmarketcap
Harmonic Pattern Hints at Potential Upside
On the 4-hour timeframe, DASH is forming a Bearish Butterfly harmonic pattern. While the name may sound negative, this pattern typically allows for a strong upside move during its CD leg before price reaches the final reversal zone.
The structure began at Point X near $42.64, followed by a sharp decline into Point A. From there, DASH rebounded toward Point B, where sellers briefly reasserted control, before price dipped once again into Point C around $36.17. This region has since acted as a firm base, with buyers stepping in aggressively to defend the lows.
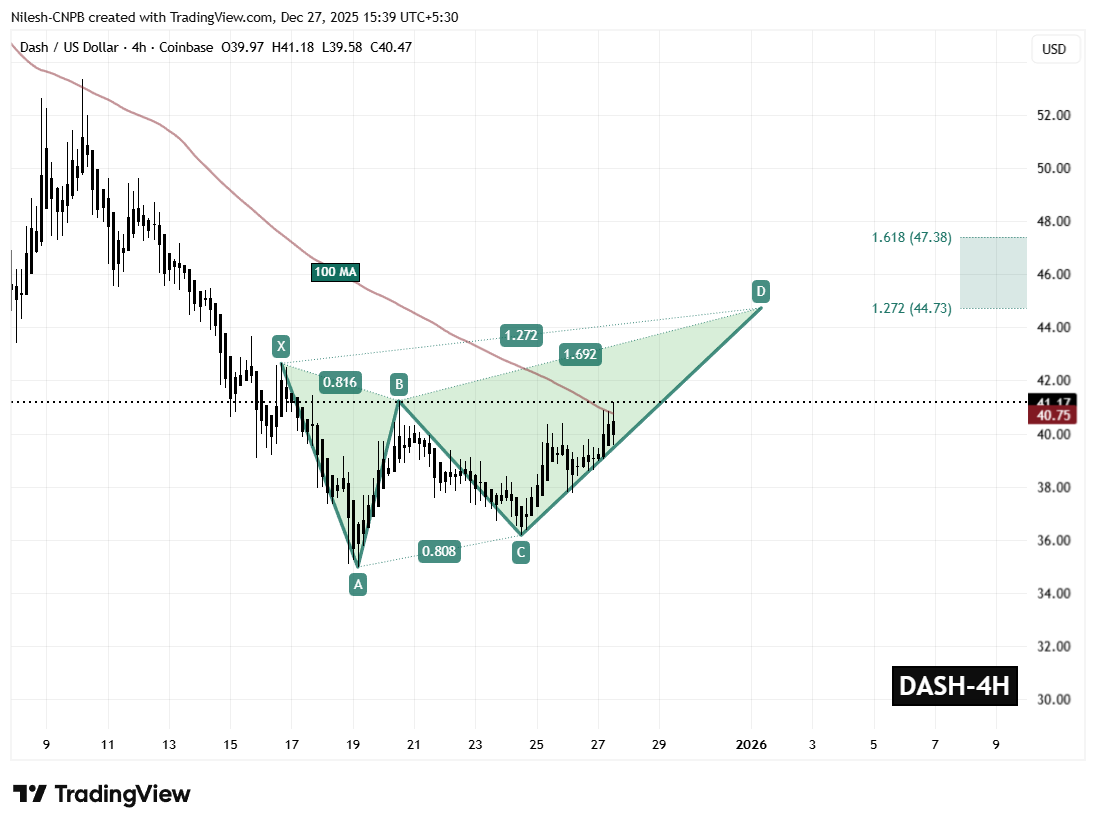
Dash (DASH) 4H Chart/Coinsprobe (Source: Tradingview)
From Point C, DASH has staged a steady recovery and is currently trading near $41.17. This move indicates improving momentum and suggests that the CD leg of the harmonic structure is actively unfolding.
Adding further strength to this setup is DASH’s successful reclaim of the 100-period moving average near $40.75. This level had previously acted as dynamic resistance throughout the downtrend, and flipping it into support marks a meaningful shift in short-term market structure.
What’s Next for DASH?
As long as DASH holds above the $39.58 support zone, the bullish harmonic structure remains intact. Continued strength above the 100 MA would likely reinforce buyer confidence and keep the CD leg in play.
If momentum persists, the Bearish Butterfly projection points toward the Potential Reversal Zone (PRZ) between $44.73 and $47.38. This area represents the typical completion zone for the pattern and offers an upside window of roughly 14% from current levels before sellers may attempt to regain control.
On the flip side, a breakdown below $39.58 would weaken the bullish outlook and risk invalidating the harmonic structure. Such a move could expose DASH to renewed downside pressure and delay any sustained recovery attempt.
For now, DASH’s ability to hold above reclaimed moving average support and continue building higher lows will be critical in determining whether this recovery can extend further in the sessions ahead.
Disclaimer: The views and analysis presented in this article are for informational purposes only and reflect the author’s perspective, not financial advice. Technical patterns and indicators discussed are subject to market volatility and may or may not yield the anticipated results. Investors are advised to exercise caution, conduct independent research, and make decisions aligned with their individual risk tolerance.
Disclaimer: The information on this page may come from third parties and does not represent the views or opinions of Gate. The content displayed on this page is for reference only and does not constitute any financial, investment, or legal advice. Gate does not guarantee the accuracy or completeness of the information and shall not be liable for any losses arising from the use of this information. Virtual asset investments carry high risks and are subject to significant price volatility. You may lose all of your invested principal. Please fully understand the relevant risks and make prudent decisions based on your own financial situation and risk tolerance. For details, please refer to
Disclaimer.
Related Articles
Analyst: April could be a key observation period for Bitcoin; the RSI is in the neutral range, and volatility may rise
April is typically a stronger month for Bitcoin’s performance, with a historical average monthly gain of about 11.3%. But since 2020, this pattern has become less stable. Bitcoin’s relative strength indicator is currently 47%, and market sentiment is being influenced by geopolitical and inflation concerns. This suggests that April’s volatility may rise, so it’s important to watch whether the market can form a clear direction.
GateNews12m ago
The Old Token Playbook Is Dead: Why Most Crypto Launches Failed in 2025
The old “token playbook” is over, according to 21Shares researcher Darius Moukhtarzade, who said that launching at high FDV, low float with a governance “meme coin” does not work anymore.
Moukhtarzade explained that there is a widening “sentiment-fundamentals gap” as the core reason behind
CryptoPotato19m ago
ETH 15-minute up 0.62%: Driven by ETF net inflows and a liquidity squeeze, short-term strength builds
2026-04-01 03:00 to 03:15 (UTC), the ETH price saw unusual movement, with a range return of +0.62%. The lowest point of the candlestick was 2088.43 USDT, and the highest point was 2106.93 USDT, with a swing of 0.89%. Against the backdrop of heightened volatility across crypto assets, ETH’s short-term trading activity was active, on-chain interest increased, and market attention rose significantly.
The main driver behind this unusual move is that net inflows into U.S. spot ETFs have continued to be amplified. ETF net inflows in early April continued the strong momentum from late March, driving a significant increase in spot demand for ETH.
GateNews1h ago
Is Bitcoin Approaching a Key “Buy Zone”? On-Chain Data Reveals That the Real BTC Bottom Signal Still Has Not Appeared
Bitcoin’s price is nearing the “buy zone” the market is watching, but the bottom signals have not fully formed yet. The current price is above the cost range, suggesting the market hasn’t undergone a major cleanup. The premium continues to narrow, reflecting that the bubble is being worked off. Although the market may face pressure in the short term, funds are positioning early, indicating optimism about future prospects.
GateNews1h ago
Analyst: Bitcoin supply structure is “changing hands”; whales and corporate trading are decoupling
XWIN Research’s analysis indicates that Bitcoin underwent a structural supply shift in the first quarter of 2026, with an increase in the exchange whale ratio. This suggests that large holders are selling Bitcoin, while publicly listed companies such as MicroStrategy have net-bought 62,000 Bitcoins. The market shows a dual trend of exchange whales and corporate accumulation: supply has shifted from early investors to companies’ balance sheets, and market liquidity has not improved significantly.
MarketWhisper1h ago
Bitcoin’s Most Dangerous Pattern Just Triggered: Will BTC Dump to $26K Next?
Although bitcoin has already dumped by over 50% from its all-time high of over $126,000 marked in October to a multi-year low of $60,000, the asset’s troubles might not be over, warned Merlijn The Trader.
The popular analyst indicated that the “most dangerous bitcoin pattern just completed phase
CryptoPotato2h ago
