what is volume divergence in trading with illustration examples
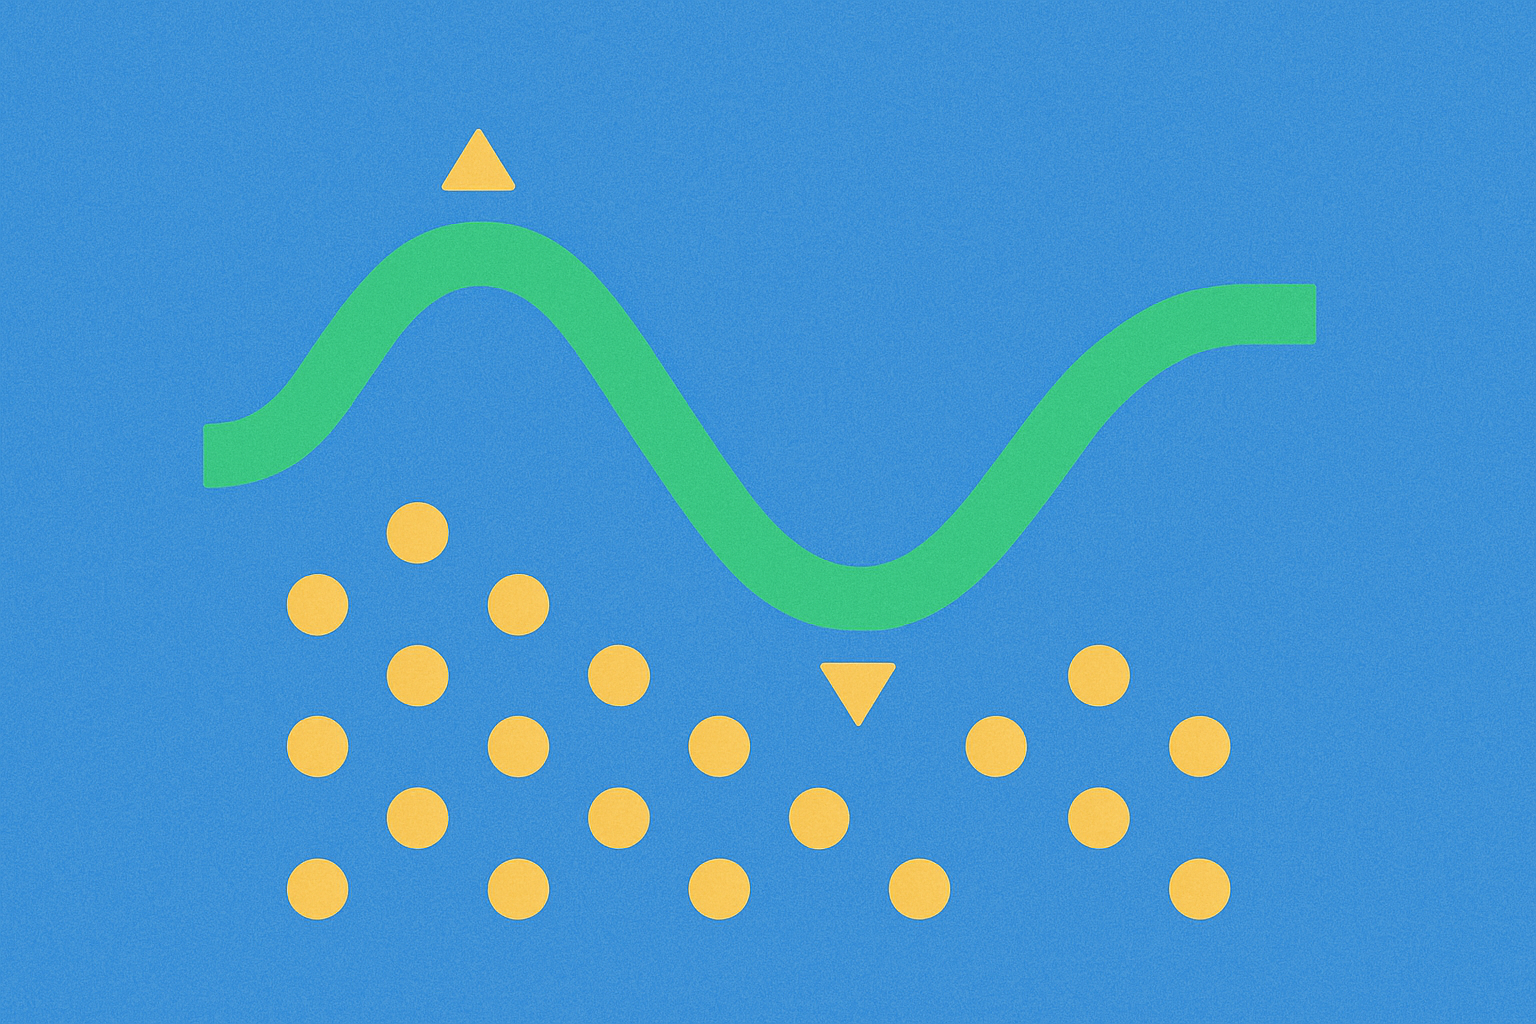
What Is Volume-Price Divergence?
Volume-price divergence refers to a situation where the direction of price highs or lows does not align with changes in trading volume. This concept is used to assess whether a trend is genuinely strong or only appears to be so. Divergence signals may arise when prices continue rising while volume decreases, or when prices fall but volume increases.
Think of trading volume as the level of market activity—much like foot traffic in a shopping mall. Price can be seen as the sticker price of goods, similar to promotional pricing. Generally, the higher the price climbs, the more “buzz” or trading activity is needed to sustain the move. If prices keep reaching new highs but trading activity (volume) declines, the rally may lose momentum and become unsustainable. Conversely, if prices hit new lows but market activity picks up, it may signal that selling pressure is weakening.
Why Does Volume-Price Divergence Occur?
Volume-price divergence commonly appears toward the end of trends or at key inflection points because different market participants act asynchronously. For example, large players might gradually reduce their positions while maintaining high prices, or quietly accumulate assets at the bottom, causing volume to rise even as prices have yet to reverse.
At the end of an uptrend, buying enthusiasm wanes and new buying volume decreases, resulting in “higher highs on lower volume.” Near the bottom of a downtrend, bottom-fishing and short covering increase, leading to “higher volume without new lows.” These behaviors cause price and volume to become misaligned, creating divergence.
Types of Volume-Price Divergence
There are two main types: bearish divergence and bullish divergence.
- Bearish divergence occurs when price makes new highs but trading volume or related indicators fail to do so.
- Bullish divergence happens when price hits new lows but volume or related indicators do not follow with new lows.
There’s also “hidden divergence,” which arises during retracements within a trend. Here, price may not make a new high (or low), but the volume structure signals alignment with the main trend—potentially indicating trend continuation. Hidden divergences are more advanced and often used alongside trendlines.
How to Identify Volume-Price Divergence
- Mark Two Adjacent Highs or Lows: On a chart, identify and connect two consecutive significant highs or lows to check if the price is reaching new extremes.
- Observe Volume Indicators: During the same period, examine volume bars or indicators like OBV (On-Balance Volume). OBV aggregates each candle’s volume according to price movement direction, creating a volume trend line.
- Compare Volume Extremes: Connect the corresponding highs or lows on the volume indicator. If price makes a new high while volume does not, or price makes a new low while volume rises, divergence is likely present.
- Confirm with Trend Context: In strong trends, divergence may indicate deceleration rather than an immediate reversal. Use with support/resistance levels and moving averages for confirmation.
Examples of Volume-Price Divergence in Trading
Example 1 (Bearish Divergence): A crypto asset rises from 100 to 105 while trading volume drops from 10 million to 7 million; it then rises further to 108 as volume falls to 6.5 million. Despite consecutive price highs, declining volume shows waning bullish momentum. If there’s a long upper wick and heavy selling near 108, this further validates the divergence and increases the likelihood of a pullback.
Example 2 (Bullish Divergence): A coin falls from 100 to 92 as volume increases from 9 million to 11 million; then drops further to 90 as volume decreases back to 8 million and OBV does not make a new low. Here, price reaches new lows but volume fails to follow—suggesting selling momentum may be fading. If stabilization and strong buying appear near 90, the divergence signal is confirmed and the probability of a rebound rises.
These are illustrative scenarios to demonstrate how to interpret “extreme price moves without matching volume.” In live markets, always consider timeframes and key levels before making decisions.
How to Use Volume-Price Divergence in Crypto Markets
In crypto markets, which are more volatile and prone to short-term noise, divergence works best as a filter rather than a standalone trading trigger. It helps confirm the reliability of breakouts or highlights optimal points for adjusting positions.
- Open Charts on Gate: Access spot or derivatives candlestick charts for your chosen trading pair and timeframe; load “Volume” and “OBV” indicators.
- Mark Key Extremes: Identify two recent significant highs or lows on both price and OBV; watch for “price break without volume confirmation.”
- Check Near Key Levels: Before acting near major support/resistance zones, see if divergence aligns with price patterns—for example, increased volume before a breakout, reduced volume on pullback, then renewed buying strength.
- Risk Management: Use Gate’s take-profit/stop-loss or conditional orders around potential reversal points to control position size and avoid over-leveraging based on a single signal.
Combining Volume-Price Divergence With Other Indicators
Volume-price divergence pairs well with trend and momentum indicators. Trendlines and moving averages provide overall market direction; divergence highlights potential changes in momentum.
You can combine it with RSI (Relative Strength Index), which acts like a “speedometer” for price movement. If price makes new highs but RSI does not—and volume contracts—the divergence signal becomes more reliable.
Divergence can also strengthen signals when aligned with chart patterns and key levels. For example: bearish divergence near a previous high combined with a breakdown below a short-term moving average; or bullish divergence near a previous low with strong buying reclaiming key support. Multiple aligned conditions typically increase success rates.
Common Misconceptions About Volume-Price Divergence
- Mistaking Any Pullback for Divergence: True divergence compares two consecutive structural highs or lows—not just ordinary fluctuations.
- Assuming All Divergences Signal Reversals: In strong trends, divergence may only indicate slowing momentum rather than an outright reversal.
- Ignoring Timeframe Differences: Divergence on a 5-minute chart versus daily chart carries very different significance; shorter timeframes are more prone to false signals and work best when aligned with larger trends.
- Overlooking Price Context: Relying on divergence without considering support/resistance or price structure can lead to false interpretations at irrelevant levels.
Risks and Risk Management for Volume-Price Divergence
The main risk with volume-price divergence is false signals—especially during news-driven events or sudden shifts in liquidity. Unexpected events can quickly invalidate divergence structures and trigger stop-loss failures.
Risk management steps include:
- Layered Confirmation: Wait for at least two other factors—trendline, key level, RSI—to confirm before acting on divergence.
- Test With Small Positions: Start with small trades to validate the signal before scaling up.
- Strict Stop-Loss Discipline: Use Gate’s take-profit/stop-loss or conditional orders to exit decisively if the pattern fails.
- Align Timeframes: Only use short-term divergence signals when they match the broader trend; be cautious trading against the prevailing direction.
Key Takeaways on Volume-Price Divergence
Volume-price divergence is a tool for assessing whether price and volume are moving in tandem—helpful for evaluating trend strength and spotting potential turning points. Bearish divergence usually appears when prices make new highs but volume fails to follow; bullish divergence arises when prices hit new lows but volume increases. Always compare adjacent structural extremes, and combine divergence with trend context, key levels, and momentum indicators for decision-making. Use Gate’s charting tools to load volume and OBV indicators, follow step-by-step analysis, and manage risk using take-profit/stop-loss orders. Remember: divergence is best used as a filter and alert—not as a standalone buy/sell trigger—for more stable participation in market trends.
FAQ
How Can I Quickly Identify Volume-Price Divergence in Actual Trading?
The core approach is comparing the direction of price movement with trading volume trends. A simple method: if price makes new highs while trading volume shrinks, or price hits new lows but trading volume rises—that’s a classic divergence signal. Use candlestick charts and compare the last 2–3 bars’ volumes instead of focusing on single data points to avoid misinterpretation.
How Do I Spot Volume-Price Divergence Opportunities on Gate?
On platforms like Gate, open any trading pair’s chart and switch to daily or 4-hour timeframes for analysis. Focus on how the lower-volume bars (usually displayed below the main chart) interact with price candlesticks: if price moves up but volume decreases, or if price drops while volume surges—that indicates possible divergence. Beginners should start with longer timeframes (daily), which offer higher reliability.
Does Price Always Reverse After Volume-Price Divergence? How Reliable Is It?
Volume-price divergence is considered a reversal signal but not an absolute one; its reliability is around 60–70%. It indicates an imbalance between buying and selling power and raises reversal probability—but there are no guarantees. Use it as a reference alongside support/resistance levels, trendlines, and other technical indicators for multi-factor confirmation before making decisions; this significantly increases your chances of success.
What Mistakes Do Beginners Often Make When Spotting Volume-Price Divergence?
Common pitfalls include judging solely by individual candlesticks rather than overall trends; confusing short-term fluctuations with real divergences; over-trusting signals leading to excessive trading; and misunderstanding different timeframe implications—daily divergences are more significant than those on hourly charts. New traders should stick to daily or 4-hour charts and avoid overtrading on minute intervals.
Does Combining Volume-Price Divergence With Candlestick Patterns Like Head-and-Shoulders Strengthen Trade Signals?
Absolutely—multiple confirmations greatly enhance signal reliability. When volume-price divergence appears alongside classic patterns such as head-and-shoulders or double tops/bottoms, reversal probability can increase to 75–85%. This is central to technical analysis: using multiple indicators for mutual confirmation. Gate’s charting tools allow you to overlay several indicators—beginners should learn how to use these combinations over time.
Related Articles

Exploring 8 Major DEX Aggregators: Engines Driving Efficiency and Liquidity in the Crypto Market

What Is Copy Trading And How To Use It?
