Trade
Basic
Futures
Futures
Hundreds of contracts settled in USDT or BTC
TradFi
Gold
Trade global traditional assets with USDT in one place
Options
Hot
Trade European-style vanilla options
Unified Account
Maximize your capital efficiency
Demo Trading
Futures Kickoff
Get prepared for your futures trading
Futures Events
Participate in events to win generous rewards
Demo Trading
Use virtual funds to experience risk-free trading
Earn
Launch
CandyDrop
Collect candies to earn airdrops
Launchpool
Quick staking, earn potential new tokens
HODLer Airdrop
Hold GT and get massive airdrops for free
Launchpad
Be early to the next big token project
Alpha Points
Trade on-chain assets and enjoy airdrop rewards!
Futures Points
Earn futures points and claim airdrop rewards
Investment
Simple Earn
Earn interests with idle tokens
Auto-Invest
Auto-invest on a regular basis
Dual Investment
Buy low and sell high to take profits from price fluctuations
Soft Staking
Earn rewards with flexible staking
Crypto Loan
0 Fees
Pledge one crypto to borrow another
Lending Center
One-stop lending hub
VIP Wealth Hub
Customized wealth management empowers your assets growth
Private Wealth Management
Customized asset management to grow your digital assets
Quant Fund
Top asset management team helps you profit without hassle
Staking
Stake cryptos to earn in PoS products
Smart Leverage
New
No forced liquidation before maturity, worry-free leveraged gains
GUSD Minting
Use USDT/USDC to mint GUSD for treasury-level yields
More
LanLianhua
Participate in horse racing betting, complete tasks to earn horse racing tickets, and enjoy a million red envelope rain daily, sharing a prize pool of 100,000 USDT at Gate 2026 Spring Festival Celebration. https://www.gate.com/competition/year-of-horse-2026?ref_type=165&utm_cmp=7EQB9Jba&ref=UgdDAV8
View Original
- Reward
- 1
- 1
- Repost
- Share
HowCanABornPrideful:
YSARB moving from a bear market to a bull market is definitely no easy feat!Crypto VC funding went from being labelled a scam to pure whiplash
In 2025, funding doubled to over $34 billion, blasting past $8 billion for the first time since 2022
Despite the milestone, 2025 was still a risk off year
Investors stayed nervous, treating crypto like a side hustle while parking real money in bonds and gold
Are we to expect more funding in 2026 than 2025?
- Reward
- like
- Comment
- Repost
- Share
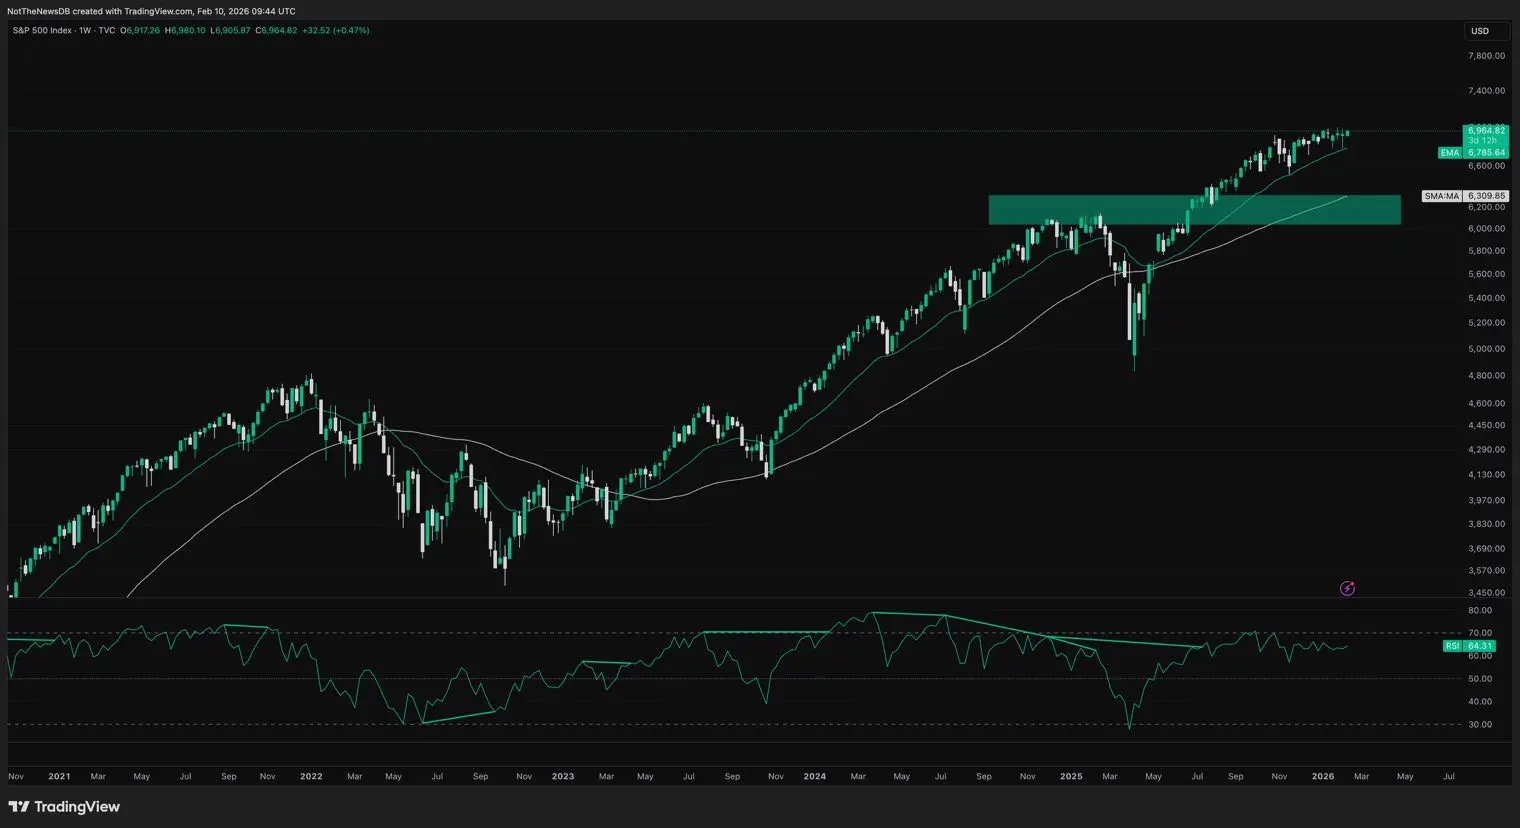
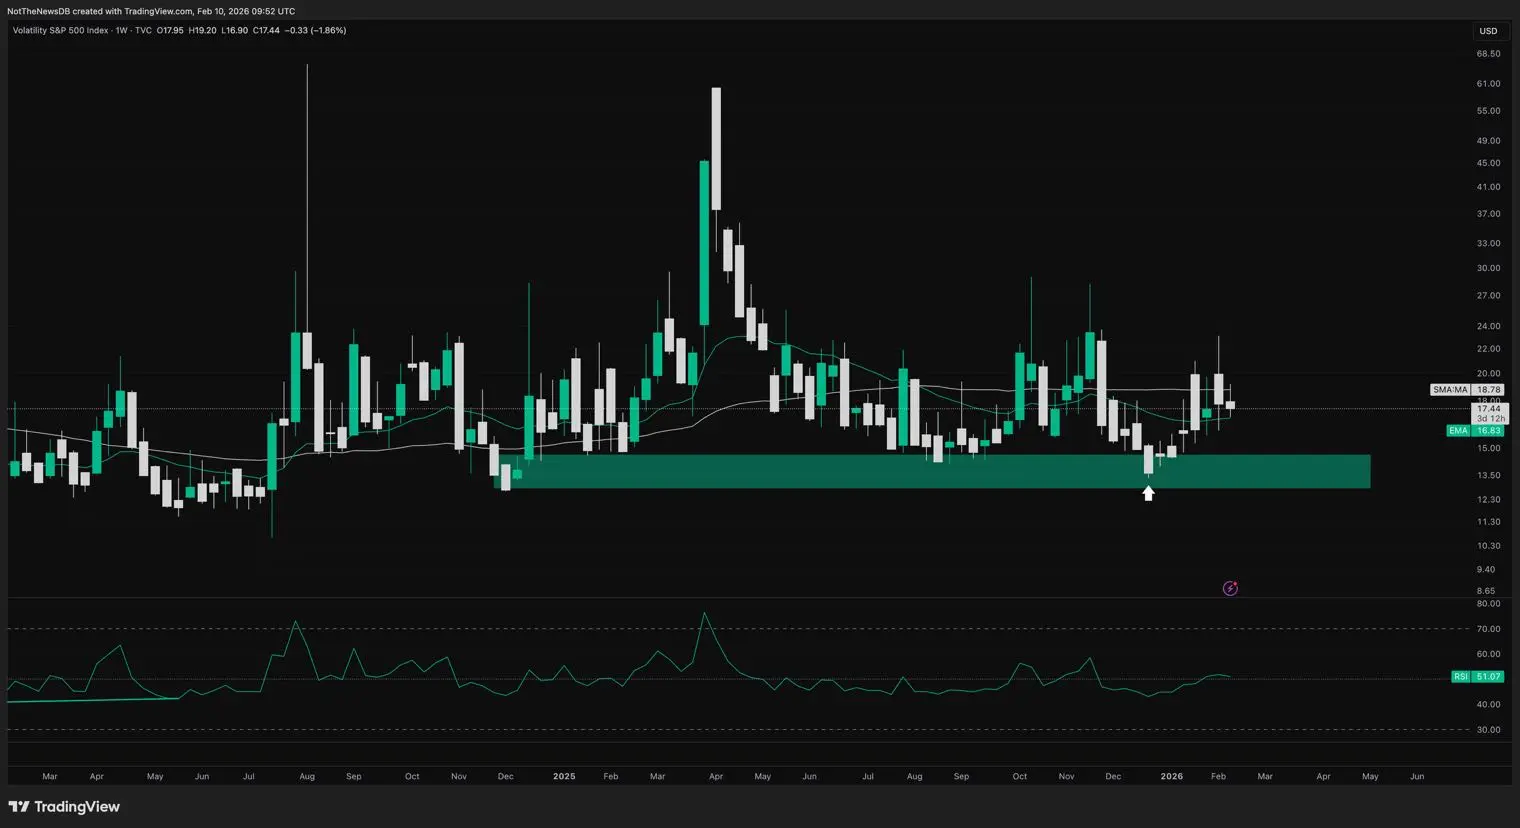
Last month, we discussed signs of a potential local top in stocks, including the 5-day bearish divergence in the SPX and the low VIX index, indicating investor complacency. A few weeks later, many tech stocks experienced a strong pullback, including TSLA, PLTR, and MSFT. The only reason I didn't increase my holdings in these stocks is that the SPX index remains strong and hasn't followed these individual stocks' recent declines, despite the sharp spike in the VIX. Usually, I look for a 5%-10% decline in the S&P 500 and NASDAQ to enter new stock trades.
Anyway, our warning proved correct, as
View OriginalAnyway, our warning proved correct, as
- Reward
- like
- Comment
- Repost
- Share
NGMI
Not Gonna Make It
Created By@DoraADream
Listing Progress
0.00%
MC:
$2.4K
More Tokens
- Reward
- like
- Comment
- Repost
- Share
- Reward
- like
- Comment
- Repost
- Share
🎁 Prize Pool Open Today | Watch-to-Earn Round 16
Watch streams and interact to unlock both physical prizes and trading rewards
Join by watching live:
1️⃣ Enter Gate Live: https://www.gate.com/live
2️⃣ Watch any stream for ≥ 5 minutes
3️⃣ Send comments and interact
4️⃣ Use the “One-Click Copy Trade” card in the live room
👉 Draw chances are credited automatically
Featured prizes this round:
Beast Valentine Gift Box | Starbucks Tumbler | Year of the Horse Maotai
GT | $50 Position Voucher
🎰 Enter the draw:
https://www.gate.com/activities/watch-to-earn?now_period=16
#CelebratingNewYearOnGateSqu
GT1.01%

- Reward
- 2
- 4
- Repost
- Share
Discovery :
:
Happy New Year! 🤑View More
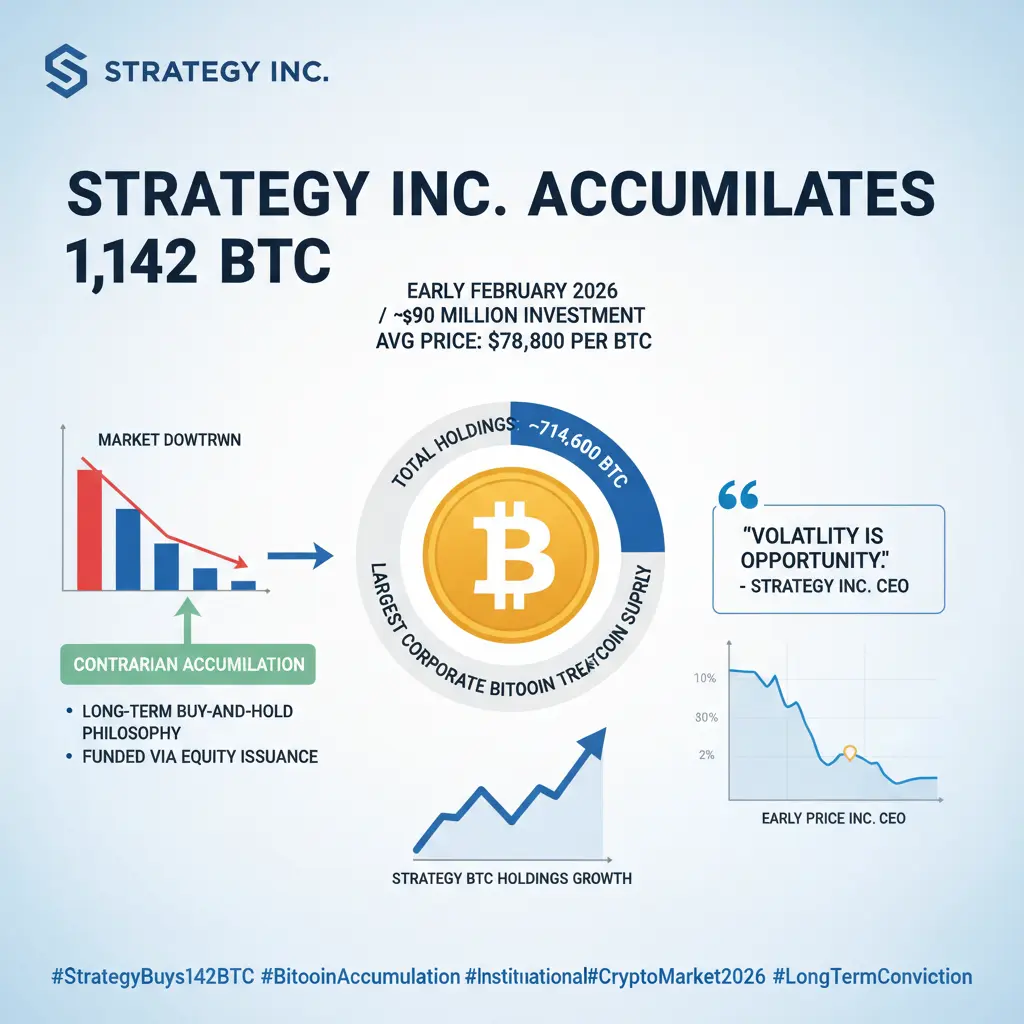
🚨 Strategy Buys 1,142 BTC During Market Weakness
#StrategyBuys1142BTC
Strategy Inc., led by Michael Saylor, has once again demonstrated unwavering conviction in Bitcoin by acquiring 1,142 BTC in early February 2026 for approximately $90 million, at an average price near $78,800 per BTC.
This purchase pushes Strategy’s total Bitcoin holdings to ~714,600 BTC, making it the largest corporate Bitcoin treasury in the world. The acquisition was executed during a period of market uncertainty, reinforcing the company’s long-standing belief that short-term price weakness represents long-term opportuni
BTC-0.24%

- Reward
- 1
- Comment
- Repost
- Share

Participate in horse racing betting, complete tasks to earn horse racing tickets, and enjoy a million red envelope rain daily, sharing a prize pool of 100,000 USDT at the Gate 2026 Spring Festival Celebration. https://www.gate.com/competition/year-of-horse-2026?ref_type=165&utm_cmp=7EQB9Jba&ref=Tingfeng
View Original
- Reward
- like
- Comment
- Repost
- Share
Participate in horse racing betting, complete tasks to earn horse racing tickets, and enjoy a million red envelope rain daily, sharing a prize pool of 100,000 USDT at the Gate 2026 Spring Festival Celebration. https://www.gate.com/competition/year-of-horse-2026?ref_type=165&utm_cmp=7EQB9Jba&ref=VQVHBFBCAG
View Original
- Reward
- like
- Comment
- Repost
- Share
I have been securely trading cryptocurrencies on the 12-year-old established exchange Gate. Join me now in participating in the hottest activity! https://www.gate.com/campaigns/4027?ref=VQVNVW9CAQ&ref_type=132&utm_cmp=7doQBcVs
View Original
- Reward
- like
- Comment
- Repost
- Share
Bitcoin rebound technical repair or demand revival The key lies in spot market capital flows
354
- Reward
- like
- Comment
- Repost
- Share
VALENTINE
情人节
Created By@0xd1b5...a733
Listing Progress
0.00%
MC:
$2.4K
More Tokens
Participate in horse racing betting, complete tasks to earn horse racing tickets, and enjoy a million red envelope rain daily, sharing a prize pool of 100,000 USDT at the Gate 2026 Spring Festival Celebration. https://www.gate.com/competition/year-of-horse-2026?ref_type=165&utm_cmp=7EQB9Jba&ref=VLJNV15YAW
View Original
- Reward
- like
- Comment
- Repost
- Share
Participate in horse racing betting, complete tasks to earn horse racing tickets, and enjoy a million red envelope rain daily, sharing a prize pool of 100,000 USDT at the Gate 2026 Spring Festival Celebration. https://www.gate.com/competition/year-of-horse-2026?ref_type=165&utm_cmp=7EQB9Jba&ref=VGDBVLPXUQ
View Original
- Reward
- like
- Comment
- Repost
- Share
Participate in horse racing betting, complete tasks to earn horse racing tickets, and enjoy a million red envelope rain daily, sharing a prize pool of 100,000 USDT at the Gate 2026 Spring Festival Celebration. https://www.gate.com/competition/year-of-horse-2026?ref_type=165&utm_cmp=7EQB9Jba&ref=VLVNAWHYUW
View Original
- Reward
- 1
- Comment
- Repost
- Share
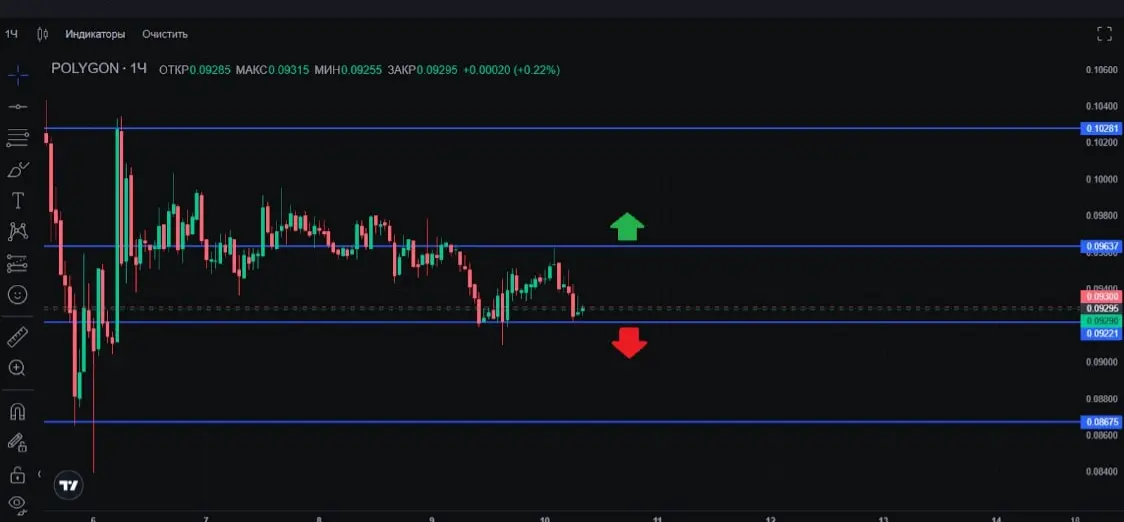
💎 Technical Analysis: Polygon ($POL )
Market Capitalization: $1B.
On the POL chart, we're observing a prolonged sideways range after a recent update of historical lows.
Price is testing critical levels, forming one triangle after another.
How to trade❔
💬 Buy on resistance breakout: wait for a break above the nearest level. Set stop-loss behind the nearest extremum. Target – the next resistance level.
💬 Sell on support breakdown: if price breaks below current lows – open a short. Stop behind the nearest extremum, take profit before the next support zone.
💬 Risk/reward ratio will look attrac
POL0.03%
- Reward
- like
- Comment
- Repost
- Share
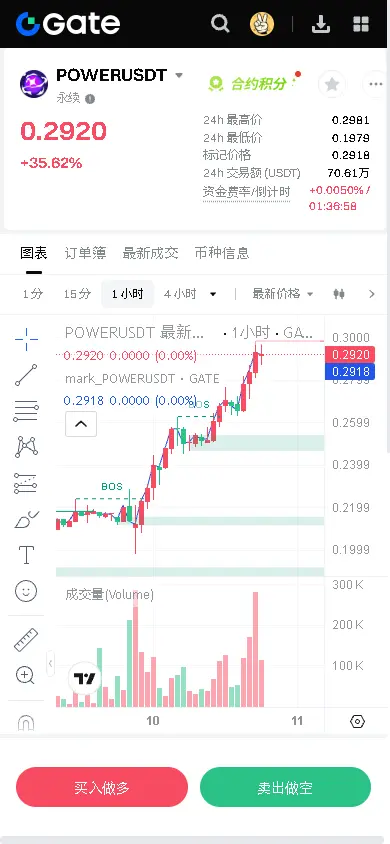
【$POWER Signal】Long | Short squeeze accelerating, deep imbalance supports breakout
$POWER Accelerates after breaking through key resistance, 4-hour candlestick shows consecutive bullish candles with increased volume. This is a typical short squeeze (Short Squeeze) pattern, not just overbought.
🎯Direction: Long (Long)
🎯Entry: 0.290 - 0.295
🛑Stop Loss: 0.272 (Break below the previous 4-hour low, rigid stop loss)
🚀Target 1: 0.320
🚀Target 2: 0.350
Market Analysis: Price has strongly broken above EMA20 (0.2346) and EMA50 (0.2161), establishing the trend structure. RSI is at 86.88, but combined
View Original$POWER Accelerates after breaking through key resistance, 4-hour candlestick shows consecutive bullish candles with increased volume. This is a typical short squeeze (Short Squeeze) pattern, not just overbought.
🎯Direction: Long (Long)
🎯Entry: 0.290 - 0.295
🛑Stop Loss: 0.272 (Break below the previous 4-hour low, rigid stop loss)
🚀Target 1: 0.320
🚀Target 2: 0.350
Market Analysis: Price has strongly broken above EMA20 (0.2346) and EMA50 (0.2161), establishing the trend structure. RSI is at 86.88, but combined
- Reward
- like
- Comment
- Repost
- Share
Participate in horse racing betting, complete tasks to earn horse racing tickets, and enjoy a million red envelope rain daily, sharing a prize pool of 100,000 USDT at the Gate 2026 Spring Festival Celebration. https://www.gate.com/competition/year-of-horse-2026?ref_type=165&utm_cmp=7EQB9Jba&ref=VQRGXV5XAG
View Original
- Reward
- like
- Comment
- Repost
- Share
Participate in horse racing betting, complete tasks to earn horse racing tickets, and enjoy a million red envelope rain daily, sharing a prize pool of 100,000 USDT at the Gate 2026 Spring Festival Celebration. https://www.gate.com/competition/year-of-horse-2026?ref_type=165&utm_cmp=7EQB9Jba&ref=VZSZFQVC
View Original
- Reward
- like
- Comment
- Repost
- Share
Load More
Join 40M users in our growing community
⚡️ Join 40M users in the crypto craze discussion
💬 Engage with your favorite top creators
👍 See what interests you
Trending Topics
View More204.21K Popularity
3.86K Popularity
5.18K Popularity
8.47K Popularity
3.17K Popularity
Hot Gate Fun
View More- MC:$2.42KHolders:20.00%
- MC:$2.4KHolders:10.00%
- MC:$2.4KHolders:10.00%
- MC:$0.1Holders:10.00%
- MC:$0.1Holders:00.00%
News
View Morerevert-test-prepublish-push-1770724175131
1 m
Gate contract points rules upgraded, TradFi trading volume officially incorporated into the statistics
2 m
Sam Altman co-founder of the identity verification project Tools for Humanity faces executive turnover
2 m
Gate Founder Dr. Han Attends Gate Ventures High-End Networking Dinner and Delivers Opening Speech
5 m
Solana's ultra-low transaction fees comparison released: surpassing Base, BNB, and Polygon, becoming the preferred execution layer for high-frequency DeFi.
8 m
Pin