Understanding Key Candlestick Patterns in Crypto Trading
How to Read the Most Popular Candlestick Patterns
What Are Candlesticks?
Candlesticks are a charting technique developed in 18th-century Japan to visualize price movements of financial assets. This method has been utilized for centuries to identify patterns that provide insights into asset price behavior. Today, traders across various markets, including digital assets and cryptocurrencies, leverage candlestick analysis to examine historical price data and forecast future price movements.
The fundamental principle of candlestick analysis is that multiple candlesticks arranged sequentially often form recognizable patterns. These patterns serve as indicators of market direction, revealing whether prices are more likely to rise, fall, or remain stable. By understanding these seven primary candlestick pattern types and their variations, traders can gain valuable insight into market sentiment and identify potential trading opportunities.
How Do Candlestick Charts Work?
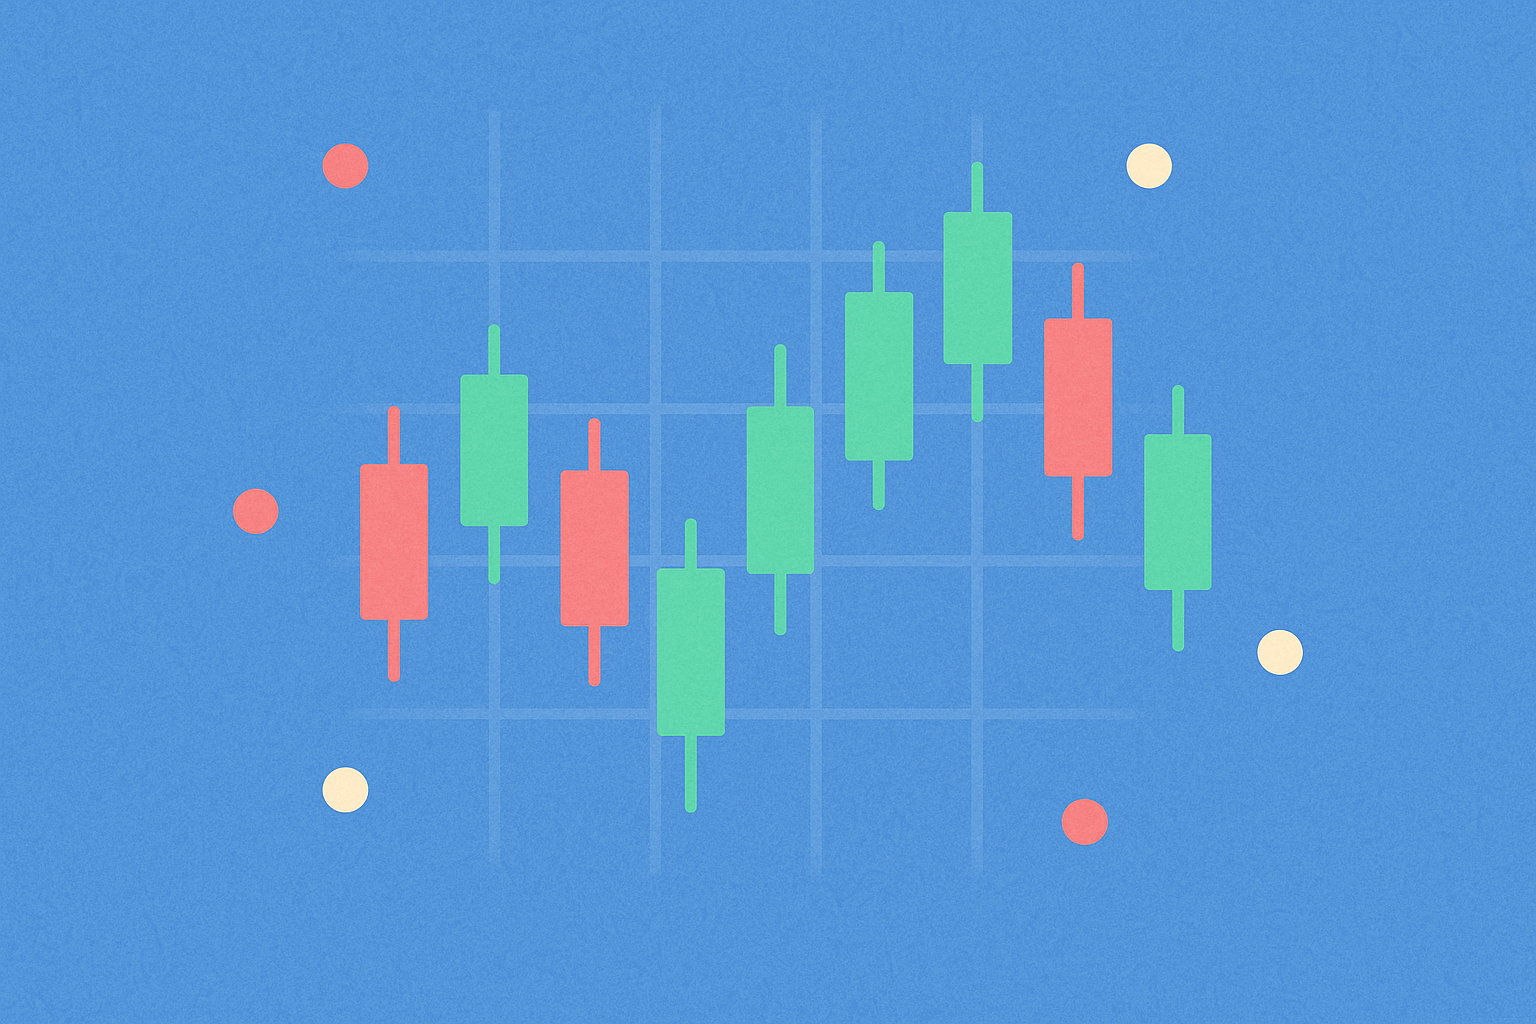
A candlestick chart is a visual representation of price data over a specific time period, whether that be a week, day, hour, or minute. Each candlestick consists of two primary components: a body and two wicks (also called shadows).
The body of the candlestick represents the range between the opening and closing prices during the specified period. The upper and lower wicks extend to show the highest and lowest prices reached within that same timeframe. The color of the body carries significant meaning: a green or white body indicates that the price increased during the period (bullish movement), while a red or black body indicates the price decreased (bearish movement).
This visual representation allows traders to quickly assess price action and identify potential turning points or continuations in market trends.
How to Read Candlestick Patterns
Candlestick patterns are formed by a specific sequence of multiple candles, each with distinct interpretations. Some patterns reveal the balance between buyers and sellers, while others indicate reversal points, trend continuation, or market indecision.
It is important to note that candlestick patterns themselves are not inherent buy or sell signals. Rather, they represent a framework for analyzing price action and market trends to identify potential opportunities. Effective trading strategy requires viewing patterns within their broader context.
To minimize trading losses, many professional traders combine candlestick pattern analysis with additional analytical methods, including the Wyckoff Method, Elliott Wave Theory, and Dow Theory. Technical analysis indicators such as trend lines, the Relative Strength Index (RSI), Stochastic RSI, Ichimoku Clouds, and Parabolic SAR are frequently incorporated alongside candlestick analysis. Additionally, candlestick patterns can be analyzed in conjunction with support and resistance levels—price points where buying or selling pressure is expected to be stronger.
Bullish Candlestick Patterns
Bullish candlestick patterns indicate potential upward price movements and are typically found at the bottom of downtrends or during consolidation phases.
Hammer: A hammer appears at the bottom of a downtrend and features a long lower wick that is at least twice the size of the body. This pattern demonstrates that despite significant selling pressure, buyers successfully pushed the price back up near the opening level. The hammer indicates potential bullish reversal, with green hammers typically signaling stronger bullish reactions than red ones.
Inverted Hammer: Similar to the hammer but inverted, this pattern has a long upper wick instead of a lower one. Appearing at the bottom of a downtrend, the inverted hammer suggests potential reversal to the upside. The upper wick indicates that downward price movement has been halted, even though sellers temporarily drove the price back down. This pattern suggests that selling pressure is weakening and buyers may soon take control.
Three White Soldiers: This pattern consists of three consecutive green candlesticks where each opens within the body of the previous candle and closes above the previous candle's high. With minimal or absent lower wicks, this pattern demonstrates that buyers are significantly stronger than sellers. The pattern strengthens when candlestick bodies are larger, indicating more robust buying pressure.
Bullish Harami: A bullish harami is composed of a long red candlestick followed by a smaller green candlestick that fits entirely within the body of the preceding red candle. This pattern, which may develop over multiple days, indicates that selling momentum is decelerating and may be coming to an end, suggesting potential bullish reversal.
Bearish Candlestick Patterns
Bearish candlestick patterns suggest potential downward price movements and are typically observed at the peaks of uptrends or during consolidation phases.
Hanging Man: The hanging man is the bearish counterpart to the hammer, typically appearing at the end of an uptrend with a small body and a long lower wick. This pattern indicates that while a significant sell-off occurred, bulls managed to recover and push the price back up temporarily. The hanging man represents a point of uncertainty where buying pressure conflicts with increasing selling pressure, potentially warning of forthcoming downside reversal.
Shooting Star: The shooting star consists of a candlestick with a long upper wick, minimal or absent lower wick, and a small body positioned near the bottom. Visually similar to the inverted hammer but formed at the end of an uptrend, the shooting star indicates that the market reached a local peak before sellers regained control and drove the price downward. This pattern is often used as a signal for potential downtrend commencement.
Three Black Crows: Composed of three consecutive red candlesticks that open within the body of the previous candle and close below the low of the preceding candle, this pattern is the bearish equivalent of three white soldiers. The absence of long upper wicks indicates sustained selling pressure pushing prices progressively lower. The size and wick structure can help assess the likelihood of downtrend continuation.
Bearish Harami: A bearish harami consists of a long green candlestick followed by a small red candlestick whose body fits entirely within the previous green candle's body. Appearing typically at the end of an uptrend over multiple periods, this pattern can signal reversal as buyers lose momentum and selling interest emerges.
Dark Cloud Cover: The dark cloud cover comprises a red candlestick that opens above the close of the preceding green candlestick but closes below its midpoint. This pattern is particularly significant when accompanied by high trading volume, suggesting momentum may shift from bullish to bearish. Some traders await confirmation from an additional red candlestick before acting on this pattern.
Continuation Candlestick Patterns
Continuation patterns indicate that the existing trend is likely to resume rather than reverse.
Rising Three Methods: This pattern occurs within an uptrend where three consecutive small-bodied red candlesticks are followed by a large-bodied green candlestick that confirms the uptrend continuation. The red candles should ideally not break below the previous candle's low, indicating that despite pullback pressure, the overall uptrend remains intact.
Falling Three Methods: The inverse of rising three methods, this pattern indicates the continuation of a downtrend. Three small-bodied green candlesticks within a downtrend are followed by a large-bodied red candlestick that confirms downtrend resumption.
Doji Candlestick Pattern: A doji forms when the open and close prices are identical or extremely similar. Despite price movement above and below the opening level, the price ultimately closes at or near the opening price. The doji represents a point of indecision between buying and selling forces. The interpretation of doji patterns is highly contextual and depends on several factors.
Doji variations include the gravestone doji (long upper wick with open/close near the low), the long-legged doji (wicks on both sides with open/close near the midpoint), and the dragonfly doji (long lower wick with open/close near the high). In volatile digital asset markets where exact doji formations are rare, the spinning top (where open and close are very close but not identical) is often used interchangeably with the doji term.
How to Use Candlestick Patterns in Crypto Trading
Effective implementation of candlestick patterns in cryptocurrency and digital asset trading requires adherence to several key principles.
Understand the Basics: Before utilizing candlestick patterns for trading decisions, traders must develop solid foundational knowledge. This includes understanding how to read candlestick charts, recognizing the seven primary candlestick pattern types and their variations, and comprehending what each pattern suggests. Trading without fundamental knowledge significantly increases risk exposure.
Combine Various Indicators: While candlestick patterns provide valuable insights, they should never be used in isolation. Combining patterns with other technical indicators such as moving averages, RSI, and MACD creates more comprehensive and reliable market analysis, improving decision-making accuracy.
Use Multiple Timeframes: Analyzing candlestick patterns across multiple timeframes provides a more complete understanding of market sentiment. For instance, traders analyzing daily charts should also examine hourly and 15-minute timeframes to observe how patterns develop and interact across different time scales.
Practice Risk Management: All trading strategies carry inherent risk. Traders must implement robust risk management techniques including stop-loss orders to protect capital, avoid overtrading, and only enter positions that offer favorable risk-reward ratios.
Conclusion
Candlestick patterns represent a fundamental tool in technical analysis that all traders can benefit from understanding, regardless of whether they incorporate them into their primary trading strategy. These patterns, including the seven major types discussed throughout this guide, provide visual representations of market psychology and the forces driving asset prices. However, it is essential to recognize that candlestick patterns are not infallible indicators and should always be used in conjunction with other analytical tools and proper risk management practices. By combining candlestick analysis with additional technical indicators, multiple timeframes, and disciplined risk management, traders can develop more robust trading strategies that better account for market complexity and reduce potential losses.
Share
Content
How to Buy Cryptocurrency


Trending Cryptocurrencies


Trading Simulator: The Complete Guide to Paper, Backtests, and Live Drills

What Does TP Mean in Crypto Trading Slang?

PNL in Crypto: A Complete Guide to Calculating Profit and Loss

What does POI mean in trading?
Understanding Cross Trade: Definition and Insights
What does "take profit" mean in trading?
Is ROA CORE (ROA) a good investment?: An In-Depth Analysis of Tokenomics, Market Performance, and Risk Factors for 2024
Is GameStop (GME) a good investment?: A Comprehensive Analysis of Risk, Volatility, and Long-Term Potential in 2024
Is Diamante (DIAM) a good investment?: A comprehensive analysis of tokenomics, market potential, and risk factors for 2024
Is Symbiosis (SIS) a good investment?: A Comprehensive Analysis of Tokenomics, Market Potential, and Risk Factors in 2024
XTER vs VET: A Comprehensive Comparison of Two Leading Blockchain Supply Chain Solutions