TOSHI vs STX: Comparing Two Emerging Blockchain Platforms for Smart Contracts
Introduction: Investment Comparison between TOSHI and STX
In the cryptocurrency market, the comparison between TOSHI vs STX has always been an unavoidable topic for investors. The two not only have significant differences in market cap ranking, application scenarios, and price performance, but also represent different positioning in crypto assets. TOSHI (TOSHI): Since its launch in 2024, it has gained market recognition as a community-centric meme token. STX (STX): Since its inception in 2019, it has been hailed as a new decentralized internet platform, and is one of the cryptocurrencies with significant market capitalization. This article will comprehensively analyze the investment value comparison between TOSHI vs STX, focusing on historical price trends, supply mechanisms, institutional adoption, technological ecosystems, and future predictions, attempting to answer the question that investors are most concerned about:
"Which is the better buy right now?"
I. Price History Comparison and Current Market Status
TOSHI and STX Historical Price Trends
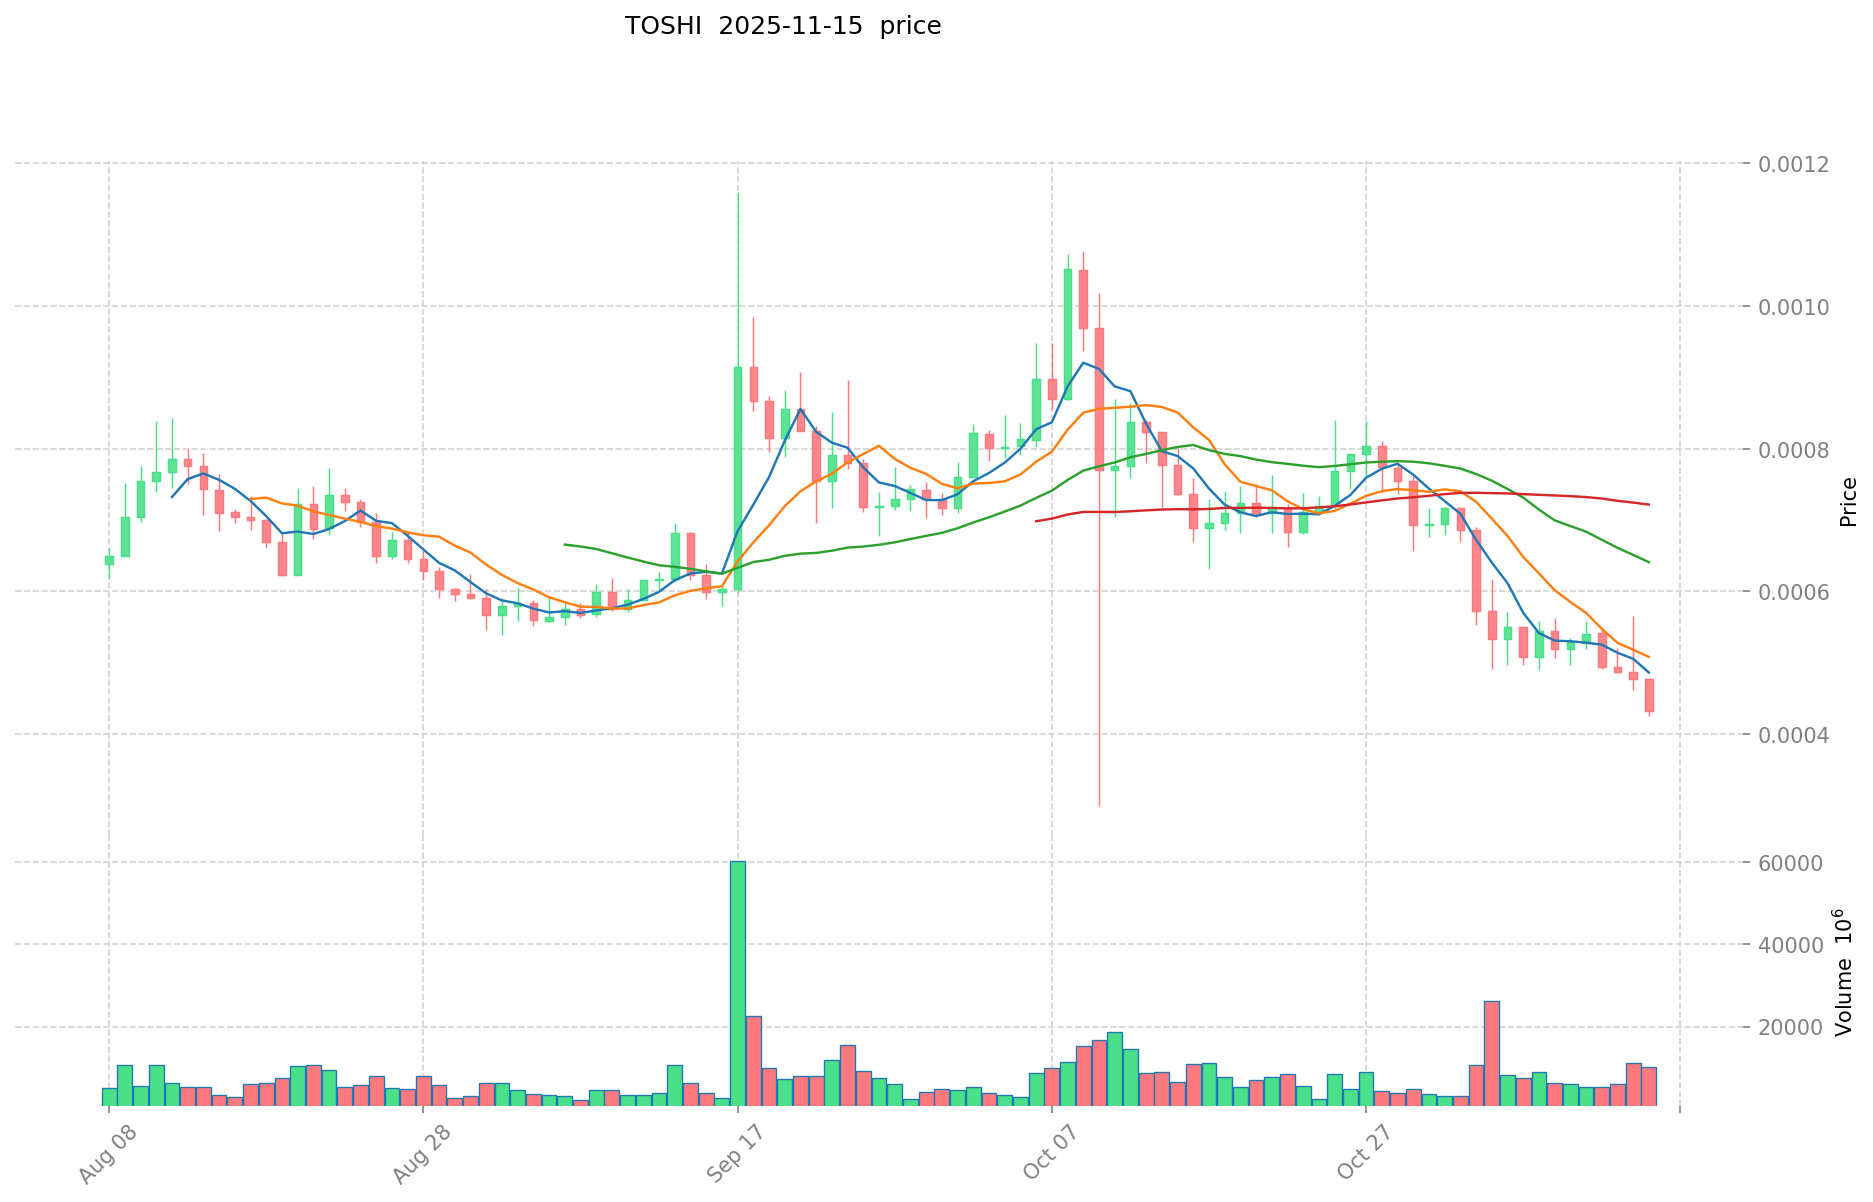
- 2025: TOSHI reached its all-time high of $0.002325 on January 26, 2025.
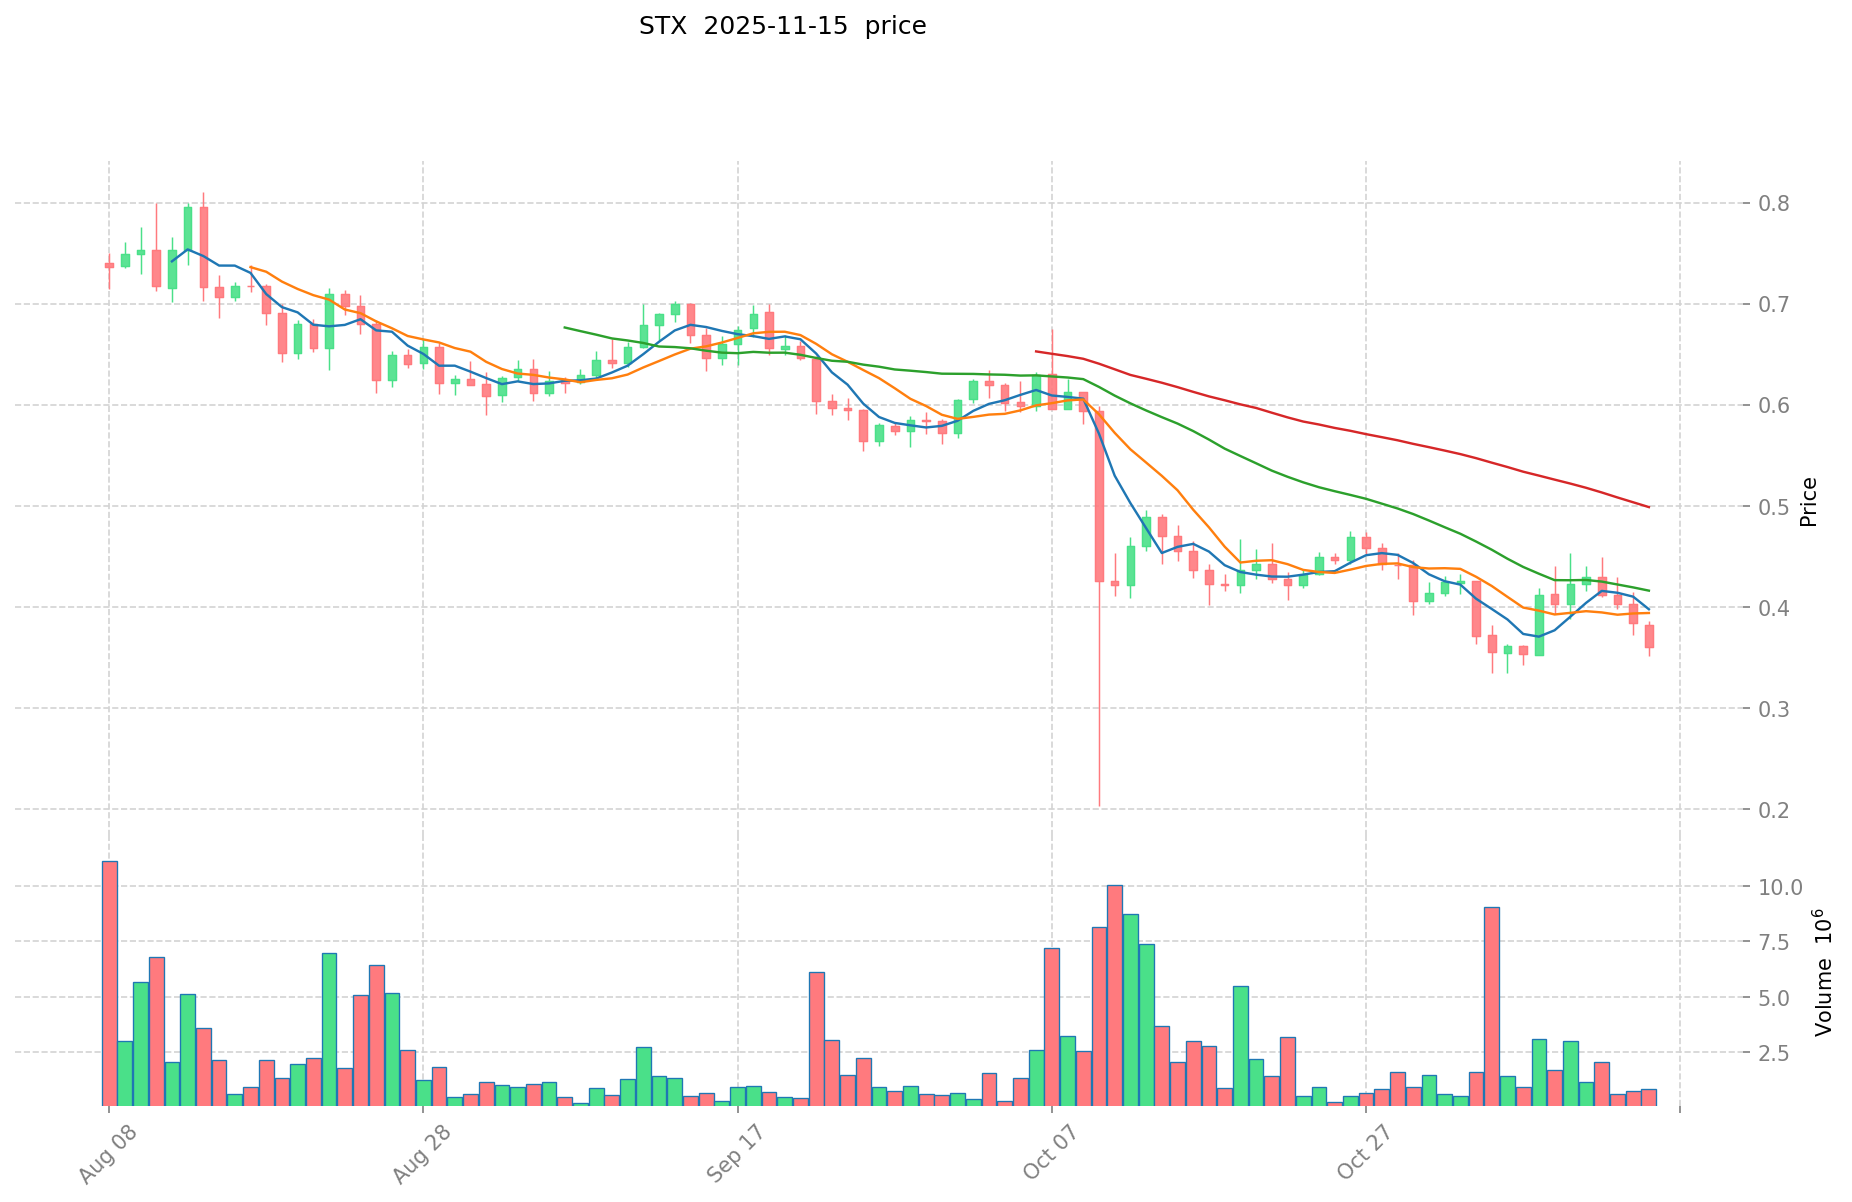
- 2024: STX hit its all-time high of $3.86 on April 1, 2024.
- Comparative analysis: In the recent market cycle, TOSHI dropped from its high of $0.002325 to a low of $0.0000738, while STX declined from $3.86 to its current price of $0.3614.
Current Market Situation (2025-11-16)
- TOSHI current price: $0.0004502
- STX current price: $0.3614
- 24-hour trading volume: TOSHI $2,293,292.04 vs STX $296,321.67
- Market Sentiment Index (Fear & Greed Index): 10 (Extreme Fear)
Click to view real-time prices:
- Check TOSHI current price Market Price
- Check STX current price Market Price
II. Core Factors Affecting TOSHI vs STX Investment Value
Supply Mechanism Comparison (Tokenomics)
-
TOSHI: Fixed supply cap of 1 billion tokens, with a declining emissions schedule over time, creating a deflationary model
-
STX: Reducing block rewards with Bitcoin halving cycles, coupled with 1:1 BTC mining relationship
-
📌 Historical Pattern: Deflationary supply mechanisms for both tokens have typically supported price appreciation during bull markets, with TOSHI showing higher volatility due to its newer market presence.
Institutional Adoption and Market Applications
- Institutional Holdings: STX has gained more institutional adoption through investment products like ETPs, while TOSHI is still establishing institutional presence
- Enterprise Adoption: STX has more established enterprise applications through its Bitcoin Layer-2 functionality, while TOSHI focuses on providing essential services to Bitcoin developers
- Regulatory Attitude: Both tokens benefit from regulatory clarity in jurisdictions that recognize their utility tokens status, with STX having a longer regulatory track record
Technical Development and Ecosystem Building
- TOSHI Technical Upgrades: Integration with Bitcoin Ordinals, improvement in developer tools, and expansion of Bitoshi script capabilities
- STX Technical Development: Nakamoto release improving scalability, implementation of sBTC for better Bitcoin interoperability
- Ecosystem Comparison: STX has a more mature ecosystem with established DeFi protocols and NFT marketplaces, while TOSHI is rapidly expanding its developer tools and infrastructure offerings
Macroeconomic and Market Cycles
- Performance in Inflationary Environments: Both tokens demonstrate some store-of-value properties due to their connection to Bitcoin, with STX having a longer track record
- Macroeconomic Monetary Policy: Interest rate changes and dollar strength impact both tokens similarly to other crypto assets, with high correlation to Bitcoin movements
- Geopolitical Factors: Growing demand for Bitcoin-adjacent assets in regions with currency instability benefits both tokens as Bitcoin layer solutions
III. 2025-2030 Price Prediction: TOSHI vs STX
Short-term Prediction (2025)
- TOSHI: Conservative $0.000292825 - $0.0004505 | Optimistic $0.0004505 - $0.000626195
- STX: Conservative $0.335916 - $0.3612 | Optimistic $0.3612 - $0.447888
Mid-term Prediction (2027)
- TOSHI may enter a growth phase, with prices expected in the range of $0.000393855031 - $0.00093457126
- STX may enter a volatile phase, with prices expected in the range of $0.22806168 - $0.613693248
- Key drivers: Institutional capital inflow, ETF, ecosystem development
Long-term Prediction (2030)
- TOSHI: Base scenario $0.000943009103376 - $0.001310782653692 | Optimistic scenario up to $0.001310782653692
- STX: Base scenario $0.6707675493792 - $0.764675006292288 | Optimistic scenario up to $0.764675006292288
Disclaimer: This analysis is for informational purposes only and should not be considered as financial advice. Cryptocurrency markets are highly volatile and unpredictable. Always conduct your own research before making any investment decisions.
TOSHI:
| 年份 | 预测最高价 | 预测平均价格 | 预测最低价 | 涨跌幅 |
|---|---|---|---|---|
| 2025 | 0.000626195 | 0.0004505 | 0.000292825 | 0 |
| 2026 | 0.0007967543 | 0.0005383475 | 0.00037684325 | 19 |
| 2027 | 0.00093457126 | 0.0006675509 | 0.000393855031 | 48 |
| 2028 | 0.0009452520744 | 0.00080106108 | 0.0006969231396 | 77 |
| 2029 | 0.001012861629552 | 0.0008731565772 | 0.000812035616796 | 93 |
| 2030 | 0.001310782653692 | 0.000943009103376 | 0.000744977191667 | 109 |
STX:
| 年份 | 预测最高价 | 预测平均价格 | 预测最低价 | 涨跌幅 |
|---|---|---|---|---|
| 2025 | 0.447888 | 0.3612 | 0.335916 | 0 |
| 2026 | 0.4247712 | 0.404544 | 0.37218048 | 11 |
| 2027 | 0.613693248 | 0.4146576 | 0.22806168 | 14 |
| 2028 | 0.63243577152 | 0.514175424 | 0.42676560192 | 42 |
| 2029 | 0.7682295009984 | 0.57330559776 | 0.3955808624544 | 58 |
| 2030 | 0.764675006292288 | 0.6707675493792 | 0.583567767959904 | 85 |
IV. Investment Strategy Comparison: TOSHI vs STX
Long-term vs Short-term Investment Strategy
- TOSHI: Suitable for investors focused on community-driven projects and meme token potential
- STX: Suitable for investors interested in Bitcoin Layer-2 solutions and decentralized internet platforms
Risk Management and Asset Allocation
- Conservative investors: TOSHI: 10% vs STX: 90%
- Aggressive investors: TOSHI: 30% vs STX: 70%
- Hedging tools: Stablecoin allocation, options, cross-currency combinations
V. Potential Risk Comparison
Market Risk
- TOSHI: Higher volatility due to its newer market presence and meme token nature
- STX: Potential market saturation in the Bitcoin Layer-2 space
Technical Risk
- TOSHI: Scalability, network stability
- STX: Hash power concentration, security vulnerabilities
Regulatory Risk
- Global regulatory policies may have different impacts on both tokens, with STX potentially facing more scrutiny due to its longer market presence
VI. Conclusion: Which Is the Better Buy?
📌 Investment Value Summary:
- TOSHI advantages: Strong community engagement, potential for rapid growth
- STX advantages: Established ecosystem, institutional adoption, Bitcoin Layer-2 functionality
✅ Investment Advice:
- New investors: Consider a small allocation to TOSHI for exposure to meme token potential, with a larger allocation to STX for its more established ecosystem
- Experienced investors: Balanced approach with a slight tilt towards STX, while monitoring TOSHI's ecosystem development
- Institutional investors: Focus on STX for its regulatory track record and institutional-grade offerings
⚠️ Risk Warning: The cryptocurrency market is highly volatile, and this article does not constitute investment advice. None
VII. FAQ
Q1: What are the main differences between TOSHI and STX? A: TOSHI is a community-centric meme token launched in 2024, while STX is a decentralized internet platform that has been around since 2019. TOSHI has a fixed supply cap of 1 billion tokens, while STX has a reducing block reward system tied to Bitcoin halving cycles. STX has more established enterprise applications and institutional adoption, while TOSHI is still building its ecosystem and institutional presence.
Q2: Which token has shown better price performance recently? A: In the recent market cycle, TOSHI dropped from its all-time high of $0.002325 to a low of $0.0000738, while STX declined from $3.86 to $0.3614. As of November 16, 2025, TOSHI's current price is $0.0004502, and STX's is $0.3614. Both tokens have experienced significant price declines from their all-time highs.
Q3: How do the supply mechanisms of TOSHI and STX compare? A: TOSHI has a fixed supply cap of 1 billion tokens with a declining emissions schedule, creating a deflationary model. STX has reducing block rewards that align with Bitcoin halving cycles and maintains a 1:1 BTC mining relationship. Both mechanisms are designed to support price appreciation during bull markets, with TOSHI potentially showing higher volatility due to its newer market presence.
Q4: What are the key factors affecting the investment value of TOSHI and STX? A: Key factors include supply mechanisms, institutional adoption, market applications, technical development, ecosystem building, macroeconomic conditions, and market cycles. STX generally has more established presence in these areas, while TOSHI is rapidly developing its ecosystem and services.
Q5: What are the long-term price predictions for TOSHI and STX? A: By 2030, the base scenario for TOSHI predicts a range of $0.000943009103376 - $0.001310782653692, with an optimistic scenario up to $0.001310782653692. For STX, the base scenario predicts $0.6707675493792 - $0.764675006292288, with an optimistic scenario up to $0.764675006292288. However, these predictions are speculative and should not be considered as financial advice.
Q6: How should investors allocate their assets between TOSHI and STX? A: Conservative investors might consider allocating 10% to TOSHI and 90% to STX, while more aggressive investors could allocate 30% to TOSHI and 70% to STX. New investors might start with a small allocation to TOSHI for exposure to meme token potential, with a larger allocation to STX for its more established ecosystem. Experienced investors could take a balanced approach with a slight tilt towards STX.
Q7: What are the main risks associated with investing in TOSHI and STX? A: Both tokens face market risks, technical risks, and regulatory risks. TOSHI may experience higher volatility due to its newer market presence and meme token nature. STX may face potential market saturation in the Bitcoin Layer-2 space. Technical risks include scalability and network stability for TOSHI, and hash power concentration and security vulnerabilities for STX. Regulatory risks may impact both tokens differently, with STX potentially facing more scrutiny due to its longer market presence.
Share
Content
Introduction: Investment Comparison between TOSHI and STX
I. Price History Comparison and Current Market Status
II. Core Factors Affecting TOSHI vs STX Investment Value
III. 2025-2030 Price Prediction: TOSHI vs STX
IV. Investment Strategy Comparison: TOSHI vs STX
V. Potential Risk Comparison
VI. Conclusion: Which Is the Better Buy?
VII. FAQ

