MET vs KAVA: Comparing Two Promising Blockchain Platforms for DeFi Innovation
Introduction: Investment Comparison between MET and KAVA
In the cryptocurrency market, the comparison between Meteora (MET) vs Kava (KAVA) has been an unavoidable topic for investors. The two not only show significant differences in market cap ranking, application scenarios, and price performance, but also represent different positioning in the crypto asset space.
Meteora (MET): Since its launch, it has gained market recognition for its focus on providing secure and sustainable liquidity infrastructure for the Solana ecosystem and broader DeFi space.
Kava (KAVA): Introduced in 2019, it has been recognized as a cross-chain DeFi platform offering lending and stablecoin services for mainstream digital assets.
This article will provide a comprehensive analysis of the investment value comparison between MET and KAVA, focusing on historical price trends, supply mechanisms, institutional adoption, technological ecosystems, and future predictions, while attempting to answer the question most crucial to investors:
"Which is the better buy right now?"
I. Price History Comparison and Current Market Status
MET (Coin A) and KAVA (Coin B) Historical Price Trends
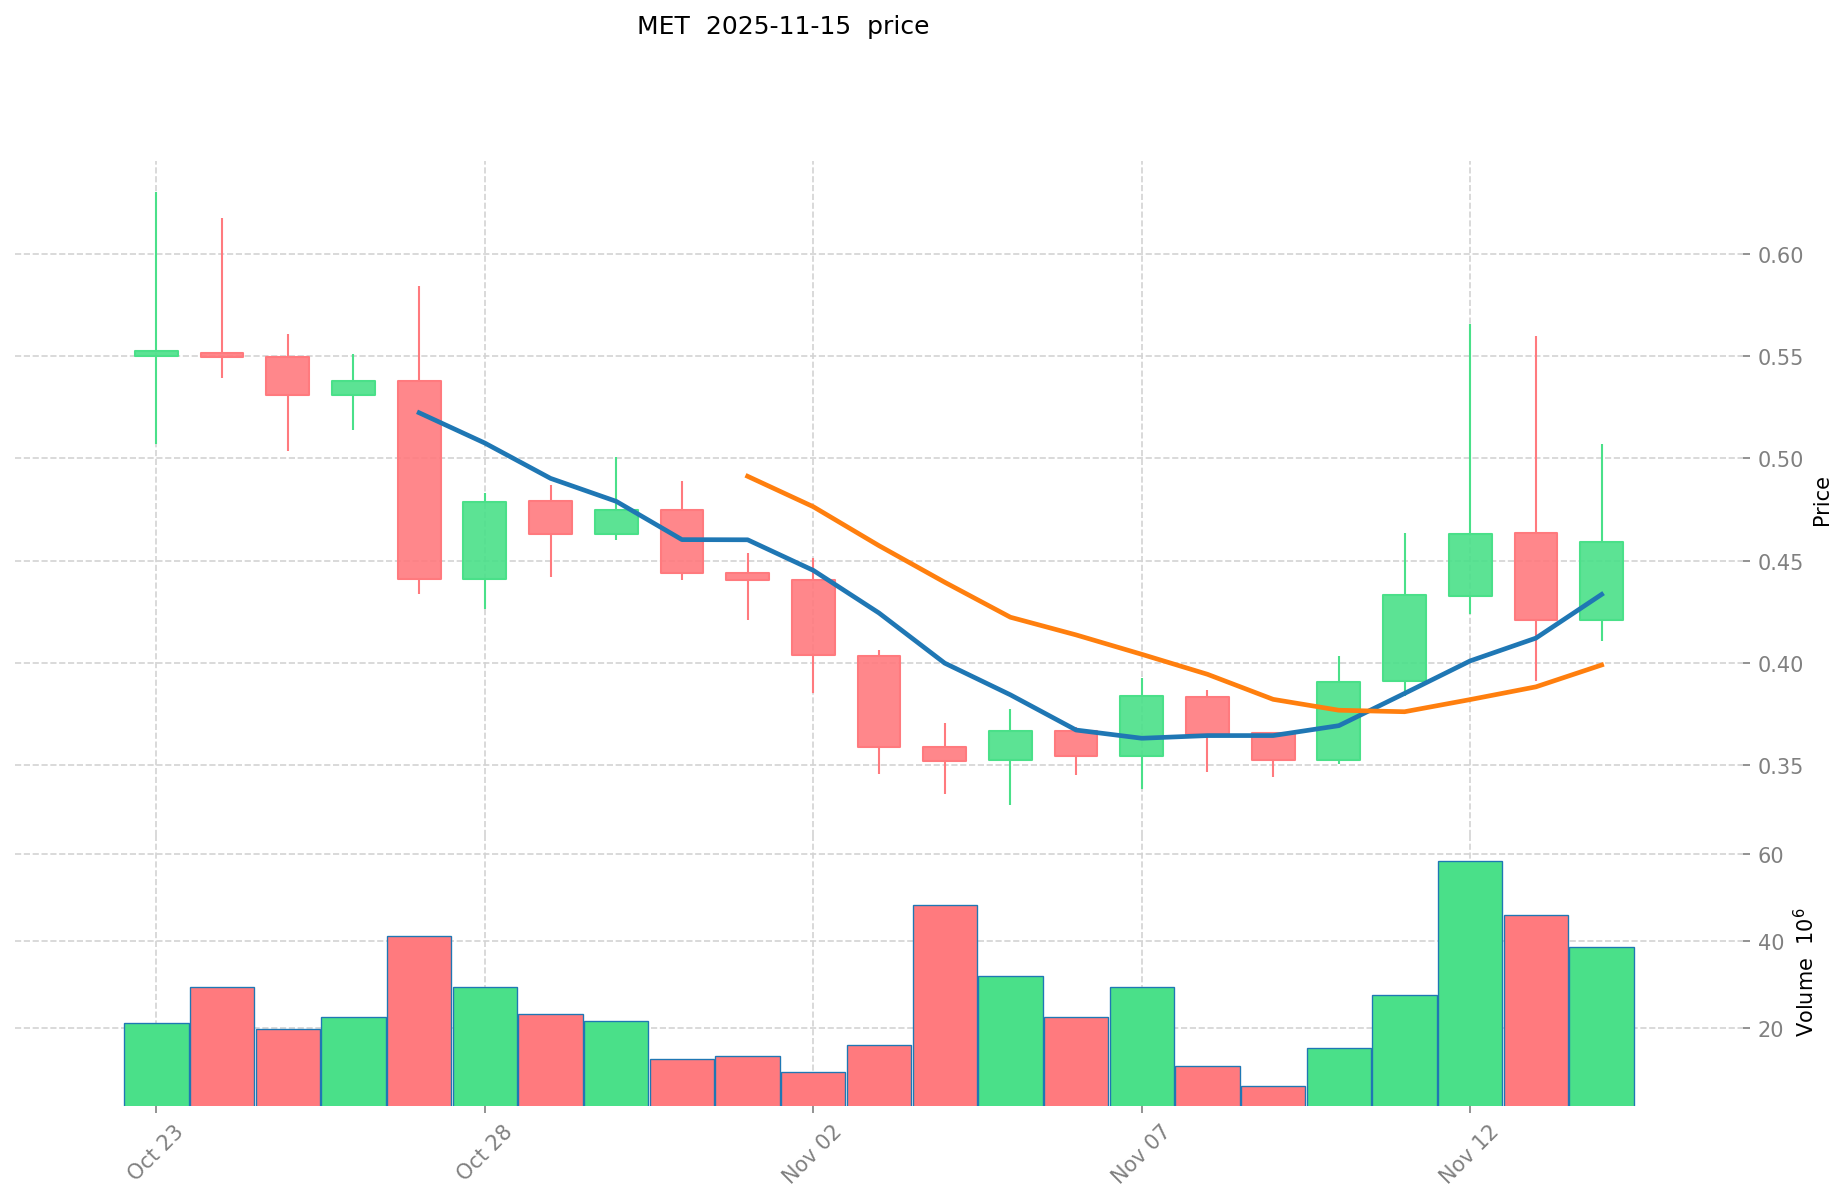
- 2025: MET reached its all-time high of $0.6304 on October 23, followed by a significant drop to its all-time low of $0.3303 on November 5.
- 2021: KAVA hit its all-time high of $9.12 on August 30, showing a strong market performance during the bull run.
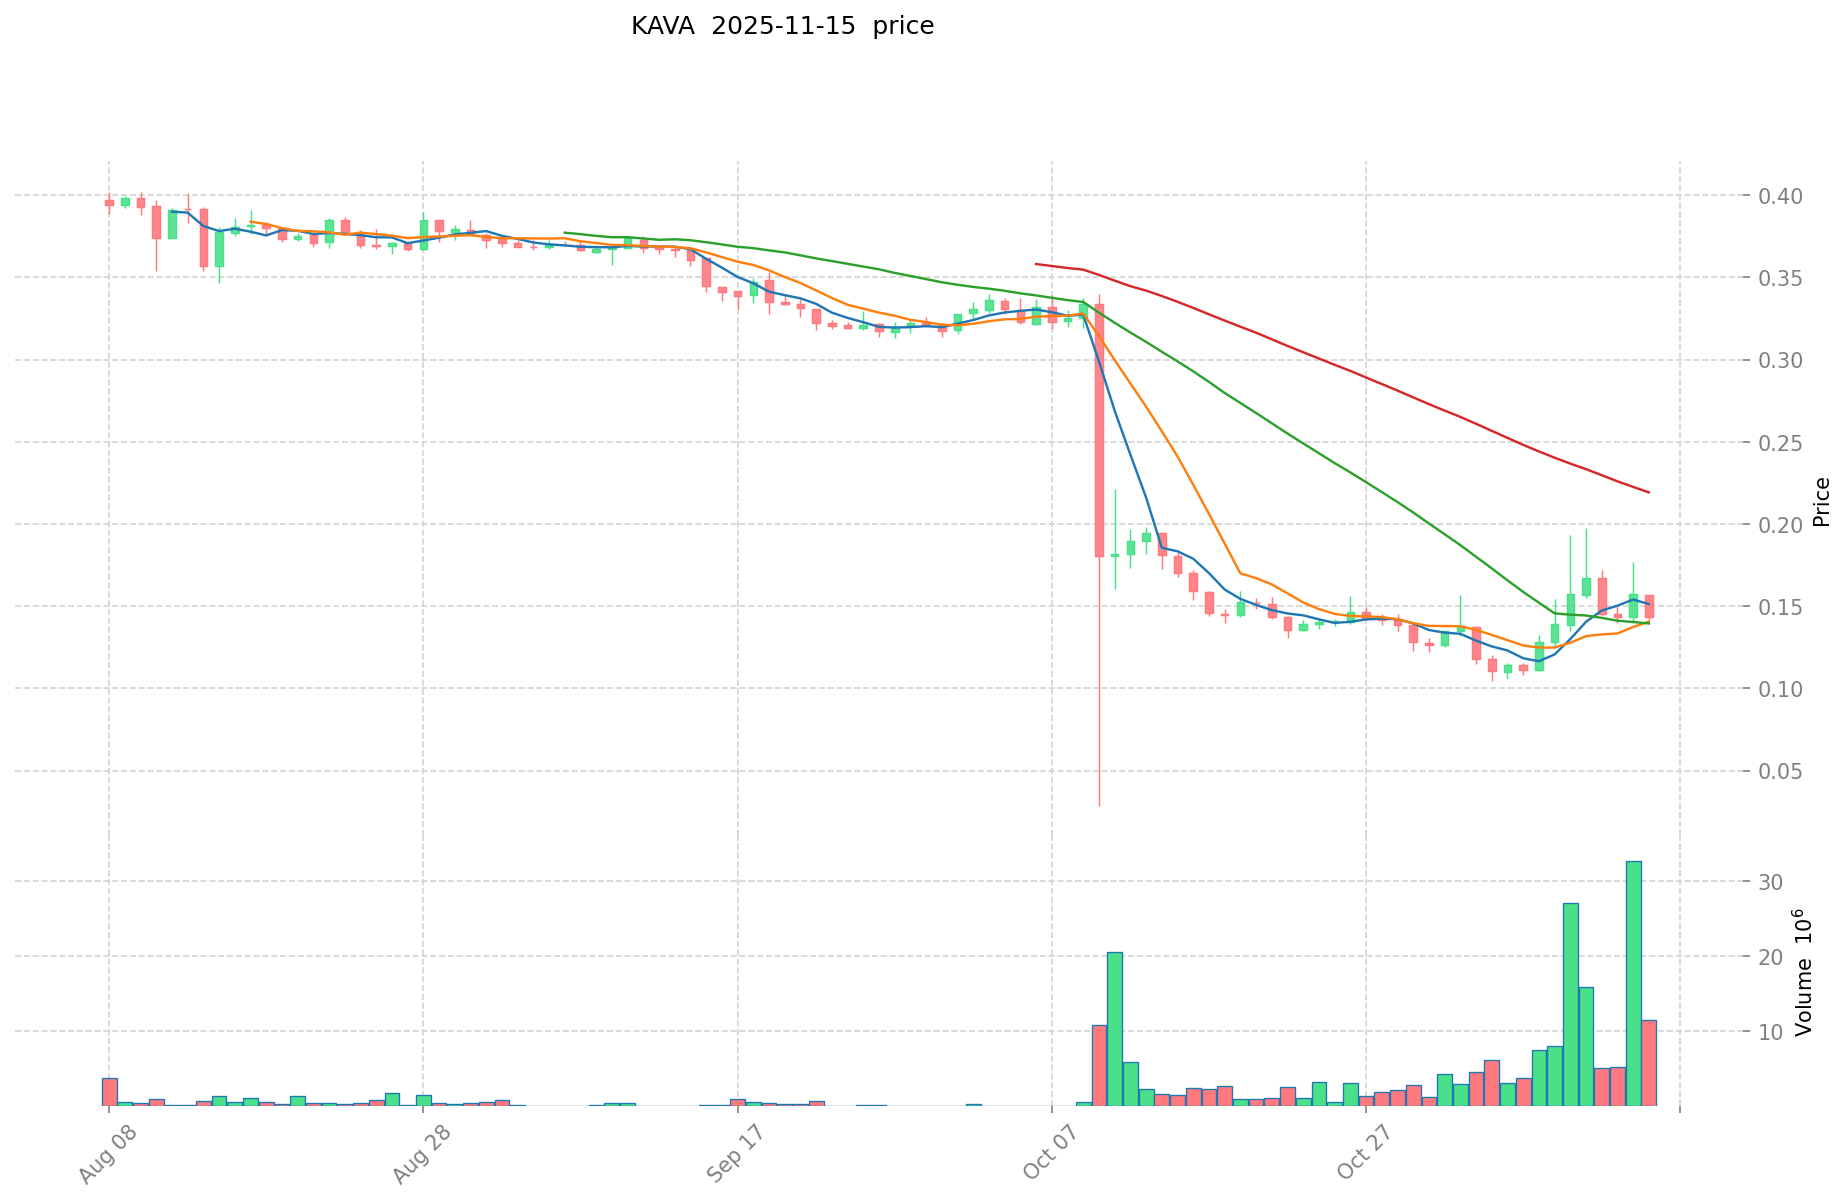
- Comparative analysis: In the recent market cycle, MET has shown high volatility, dropping from $0.6304 to $0.3303 within a short period. KAVA, on the other hand, has experienced a long-term decline from its 2021 high, reaching a new all-time low of $0.105588 on November 5, 2025.
Current Market Situation (2025-11-16)
- MET current price: $0.4477
- KAVA current price: $0.14171
- 24-hour trading volume: MET $8,988,282.48 vs KAVA $1,354,726.12
- Market Sentiment Index (Fear & Greed Index): 10 (Extreme Fear)
Click to view real-time prices:
- View MET current price Market Price
- View KAVA current price Market Price
II. Core Factors Affecting the Investment Value of MET vs KAVA
Supply Mechanisms (Tokenomics)
- MET: Fixed supply cap, with an initial daily auction distribution mechanism
- KAVA: Inflationary model with block rewards that are distributed to stakers and participants in the network
- 📌 Historical pattern: Limited supply cryptocurrencies like MET tend to be more resilient during bearish markets, while KAVA's staking rewards incentivize long-term holding despite inflation.
Institutional Adoption and Market Applications
- Institutional holdings: KAVA has gained more institutional interest through its cross-chain DeFi platform catering to both crypto-native and traditional finance institutions
- Enterprise adoption: KAVA's focus on cross-chain capabilities makes it more versatile for enterprise payment solutions, while MET has seen limited enterprise integration
- Regulatory attitudes: Both tokens face varying regulatory scrutiny across jurisdictions, with KAVA's DeFi functionality attracting more regulatory attention
Technical Development and Ecosystem Building
- MET technical upgrades: Enhanced smart contract capabilities and improved interoperability with Ethereum ecosystem
- KAVA technical development: Layer-1 blockchain with Cosmos SDK implementation, supporting multiple assets across different chains
- Ecosystem comparison: KAVA has a more robust DeFi ecosystem with lending, borrowing, and staking products, while MET has focused more on value preservation and stability features
Macroeconomic Factors and Market Cycles
- Performance during inflation: MET's fixed supply model theoretically positions it better as an inflation hedge
- Macroeconomic monetary policy: Interest rate hikes have historically impacted both tokens negatively, with KAVA showing higher volatility
- Geopolitical factors: Cross-border transaction demand benefits both tokens, though KAVA's interoperability gives it an edge during periods of regional financial instability
III. 2025-2030 Price Prediction: MET vs KAVA
Short-term Prediction (2025)
- MET: Conservative $0.368508 - $0.4494 | Optimistic $0.4494 - $0.588714
- KAVA: Conservative $0.113296 - $0.14162 | Optimistic $0.14162 - $0.1543658
Mid-term Prediction (2027)
- MET may enter a growth phase, with an estimated price range of $0.5147488269 - $0.5804614431
- KAVA may enter a volatile phase, with an estimated price range of $0.09184439374 - $0.22802746032
- Key drivers: Institutional capital inflow, ETFs, ecosystem development
Long-term Prediction (2030)
- MET: Base scenario $0.815169110999512 - $1.206450284279278 | Optimistic scenario $1.206450284279278+
- KAVA: Base scenario $0.235889736305151 - $0.25004312048346 | Optimistic scenario $0.25004312048346+
Disclaimer
MET:
| 年份 | 预测最高价 | 预测平均价格 | 预测最低价 | 涨跌幅 |
|---|---|---|---|---|
| 2025 | 0.588714 | 0.4494 | 0.368508 | 0 |
| 2026 | 0.57615327 | 0.519057 | 0.39448332 | 15 |
| 2027 | 0.5804614431 | 0.547605135 | 0.5147488269 | 22 |
| 2028 | 0.823488602013 | 0.56403328905 | 0.383542636554 | 25 |
| 2029 | 0.936577276467525 | 0.6937609455315 | 0.367693301131695 | 54 |
| 2030 | 1.206450284279278 | 0.815169110999512 | 0.578770068809653 | 82 |
KAVA:
| 年份 | 预测最高价 | 预测平均价格 | 预测最低价 | 涨跌幅 |
|---|---|---|---|---|
| 2025 | 0.1543658 | 0.14162 | 0.113296 | 0 |
| 2026 | 0.168711906 | 0.1479929 | 0.113954533 | 4 |
| 2027 | 0.22802746032 | 0.158352403 | 0.09184439374 | 11 |
| 2028 | 0.2337598173086 | 0.19318993166 | 0.1120501603628 | 36 |
| 2029 | 0.258304598126003 | 0.2134748744843 | 0.177184145821969 | 50 |
| 2030 | 0.25004312048346 | 0.235889736305151 | 0.205224070585481 | 66 |
IV. Investment Strategy Comparison: MET vs KAVA
Long-term vs Short-term Investment Strategies
- MET: Suitable for investors focused on ecosystem potential and value preservation
- KAVA: Suitable for investors seeking DeFi exposure and cross-chain functionality
Risk Management and Asset Allocation
- Conservative investors: MET 40% vs KAVA 60%
- Aggressive investors: MET 60% vs KAVA 40%
- Hedging tools: Stablecoin allocation, options, cross-currency portfolios
V. Potential Risk Comparison
Market Risk
- MET: High volatility due to recent market cycles
- KAVA: Susceptibility to broader DeFi market trends
Technical Risk
- MET: Scalability, network stability
- KAVA: Cross-chain vulnerabilities, smart contract risks
Regulatory Risk
- Global regulatory policies may impact both differently, with KAVA potentially facing more scrutiny due to its DeFi functionalities
VI. Conclusion: Which Is the Better Buy?
📌 Investment Value Summary:
- MET advantages: Fixed supply, focus on Solana ecosystem, potential for value preservation
- KAVA advantages: Cross-chain capabilities, established DeFi ecosystem, institutional interest
✅ Investment Advice:
- Novice investors: Consider a balanced approach with exposure to both tokens
- Experienced investors: Analyze ecosystem growth and adapt allocation based on market trends
- Institutional investors: Evaluate KAVA's cross-chain solutions and MET's liquidity infrastructure
⚠️ Risk Warning: Cryptocurrency markets are highly volatile. This article does not constitute investment advice. None
VII. FAQ
Q1: What are the main differences between MET and KAVA? A: MET focuses on providing liquidity infrastructure for the Solana ecosystem, while KAVA is a cross-chain DeFi platform offering lending and stablecoin services. MET has a fixed supply cap, whereas KAVA has an inflationary model with block rewards.
Q2: Which token has shown better price performance recently? A: As of November 16, 2025, MET is trading at $0.4477, recovering from its recent all-time low of $0.3303. KAVA, on the other hand, is trading at $0.14171, near its all-time low of $0.105588. MET has shown higher volatility but better recovery in the recent market cycle.
Q3: How do the supply mechanisms of MET and KAVA differ? A: MET has a fixed supply cap with an initial daily auction distribution mechanism, which can make it more resilient during bearish markets. KAVA has an inflationary model with block rewards distributed to stakers and network participants, incentivizing long-term holding despite inflation.
Q4: Which token has gained more institutional interest? A: KAVA has gained more institutional interest through its cross-chain DeFi platform, which caters to both crypto-native and traditional finance institutions. Its focus on cross-chain capabilities also makes it more versatile for enterprise payment solutions.
Q5: What are the long-term price predictions for MET and KAVA? A: By 2030, MET is predicted to reach a base scenario of $0.815169110999512 - $1.206450284279278, with an optimistic scenario above $1.206450284279278. KAVA's base scenario for 2030 is $0.235889736305151 - $0.25004312048346, with an optimistic scenario above $0.25004312048346.
Q6: What are the main risks associated with investing in MET and KAVA? A: Both tokens face market risks, with MET showing high volatility due to recent market cycles and KAVA being susceptible to broader DeFi market trends. Technical risks include scalability and network stability for MET, and cross-chain vulnerabilities and smart contract risks for KAVA. Regulatory risks may impact both, with KAVA potentially facing more scrutiny due to its DeFi functionalities.
Q7: How should different types of investors approach MET and KAVA? A: Novice investors should consider a balanced approach with exposure to both tokens. Experienced investors should analyze ecosystem growth and adapt allocation based on market trends. Institutional investors should evaluate KAVA's cross-chain solutions and MET's liquidity infrastructure to determine the best fit for their investment strategy.
Share
Content
Introduction: Investment Comparison between MET and KAVA
I. Price History Comparison and Current Market Status
II. Core Factors Affecting the Investment Value of MET vs KAVA
III. 2025-2030 Price Prediction: MET vs KAVA
IV. Investment Strategy Comparison: MET vs KAVA
V. Potential Risk Comparison
VI. Conclusion: Which Is the Better Buy?
VII. FAQ

