DBR vs MANA: Analyzing the Performance of Two Leading Crypto Assets in the Metaverse Space
Introduction: DBR vs MANA Investment Comparison
In the cryptocurrency market, the comparison between DBR and MANA has always been a topic that investors can't avoid. The two not only have significant differences in market cap ranking, application scenarios, and price performance, but also represent different cryptocurrency asset positions.
deBridge (DBR): Since its launch, it has gained market recognition for its role as DeFi's internet of liquidity, enabling real-time movement of assets and information across the DeFi landscape.
Decentraland (MANA): Since its inception in 2017, it has been hailed as a virtual world platform based on blockchain, aiming to solve the problem of platform providers earning intermediate profits for decentralized open source projects.
This article will comprehensively analyze the investment value comparison between DBR and MANA, focusing on historical price trends, supply mechanisms, institutional adoption, technological ecosystems, and future predictions, and attempt to answer the question most concerning to investors:
"Which is the better buy right now?"
I. Price History Comparison and Current Market Status
DBR (Coin A) and MANA (Coin B) Historical Price Trends
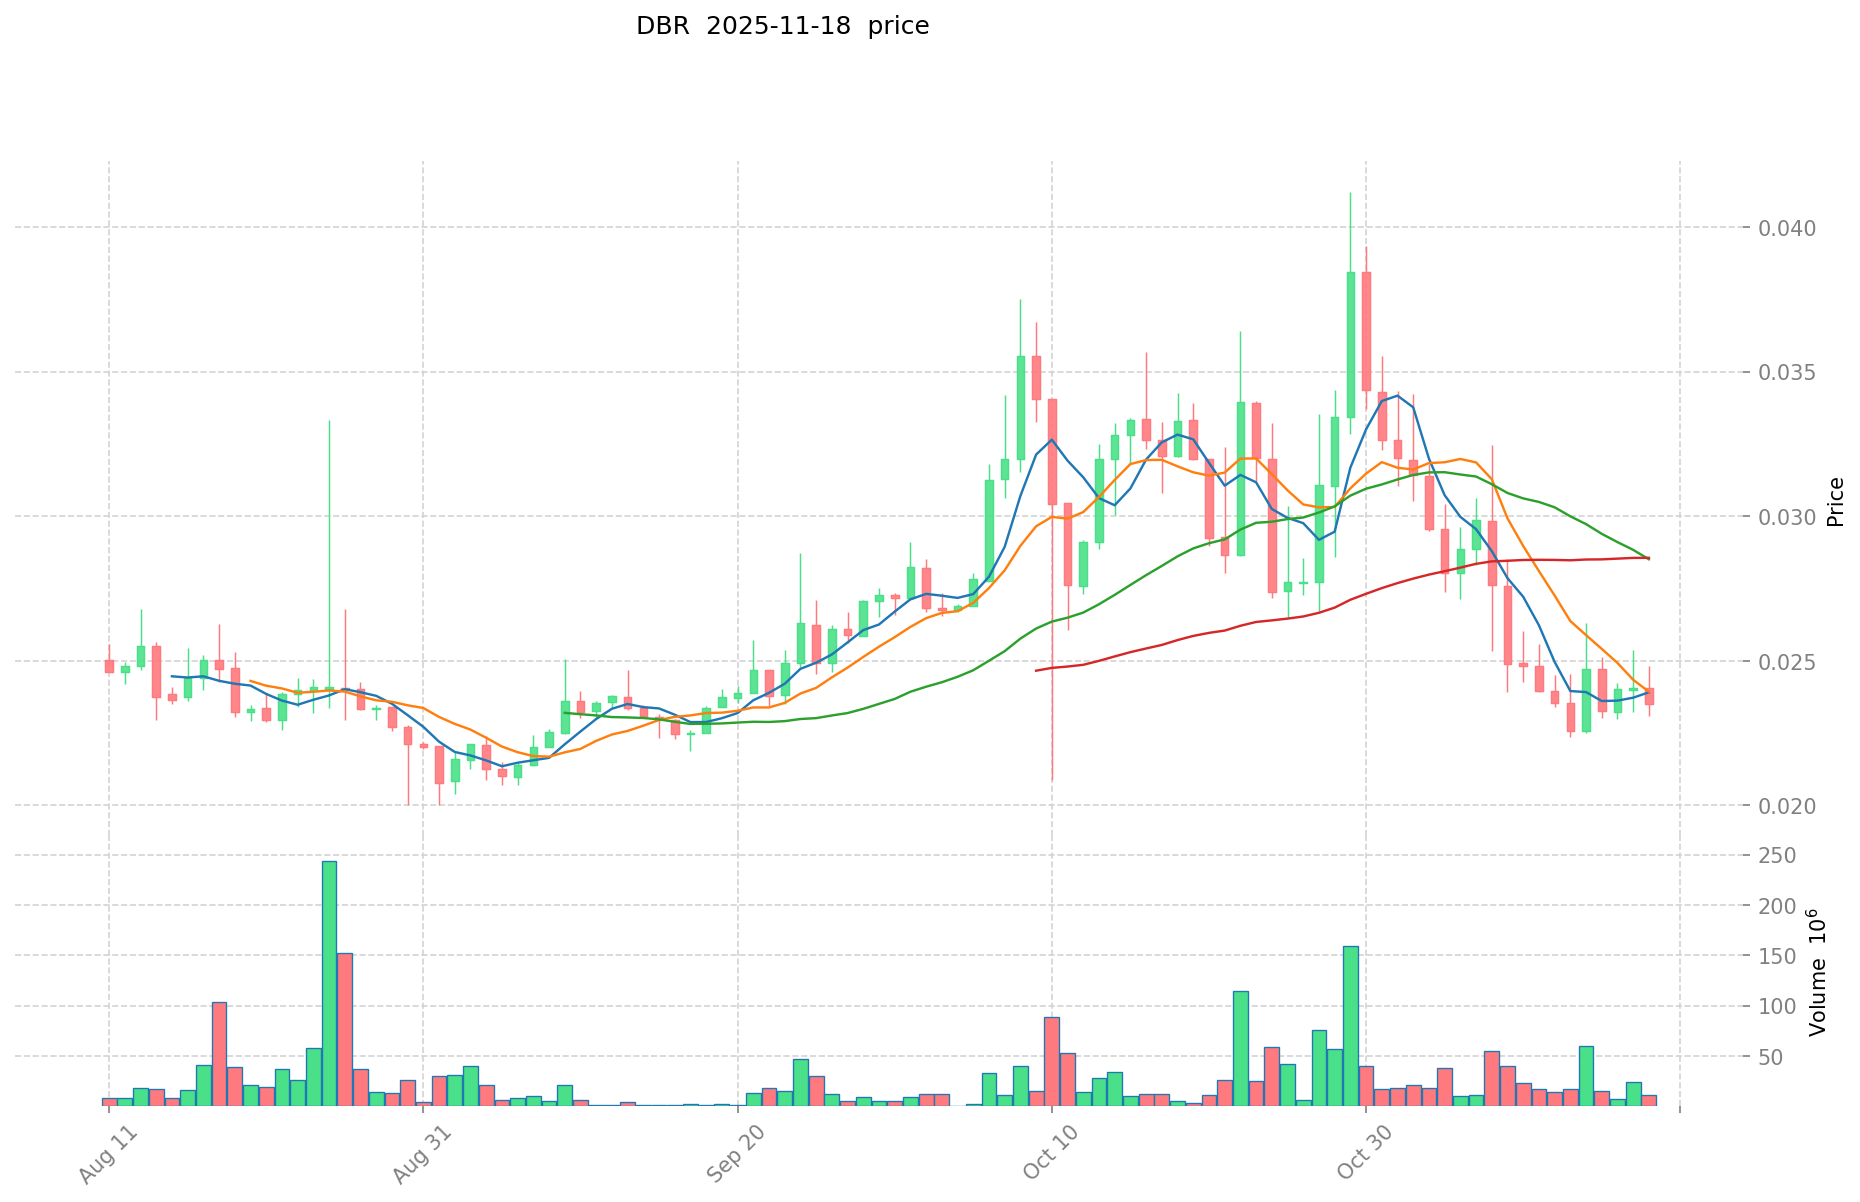
- 2024: DBR reached its all-time low of $0.005 on October 17, 2024.
- 2024: DBR hit its all-time high of $0.05764 on December 22, 2024.
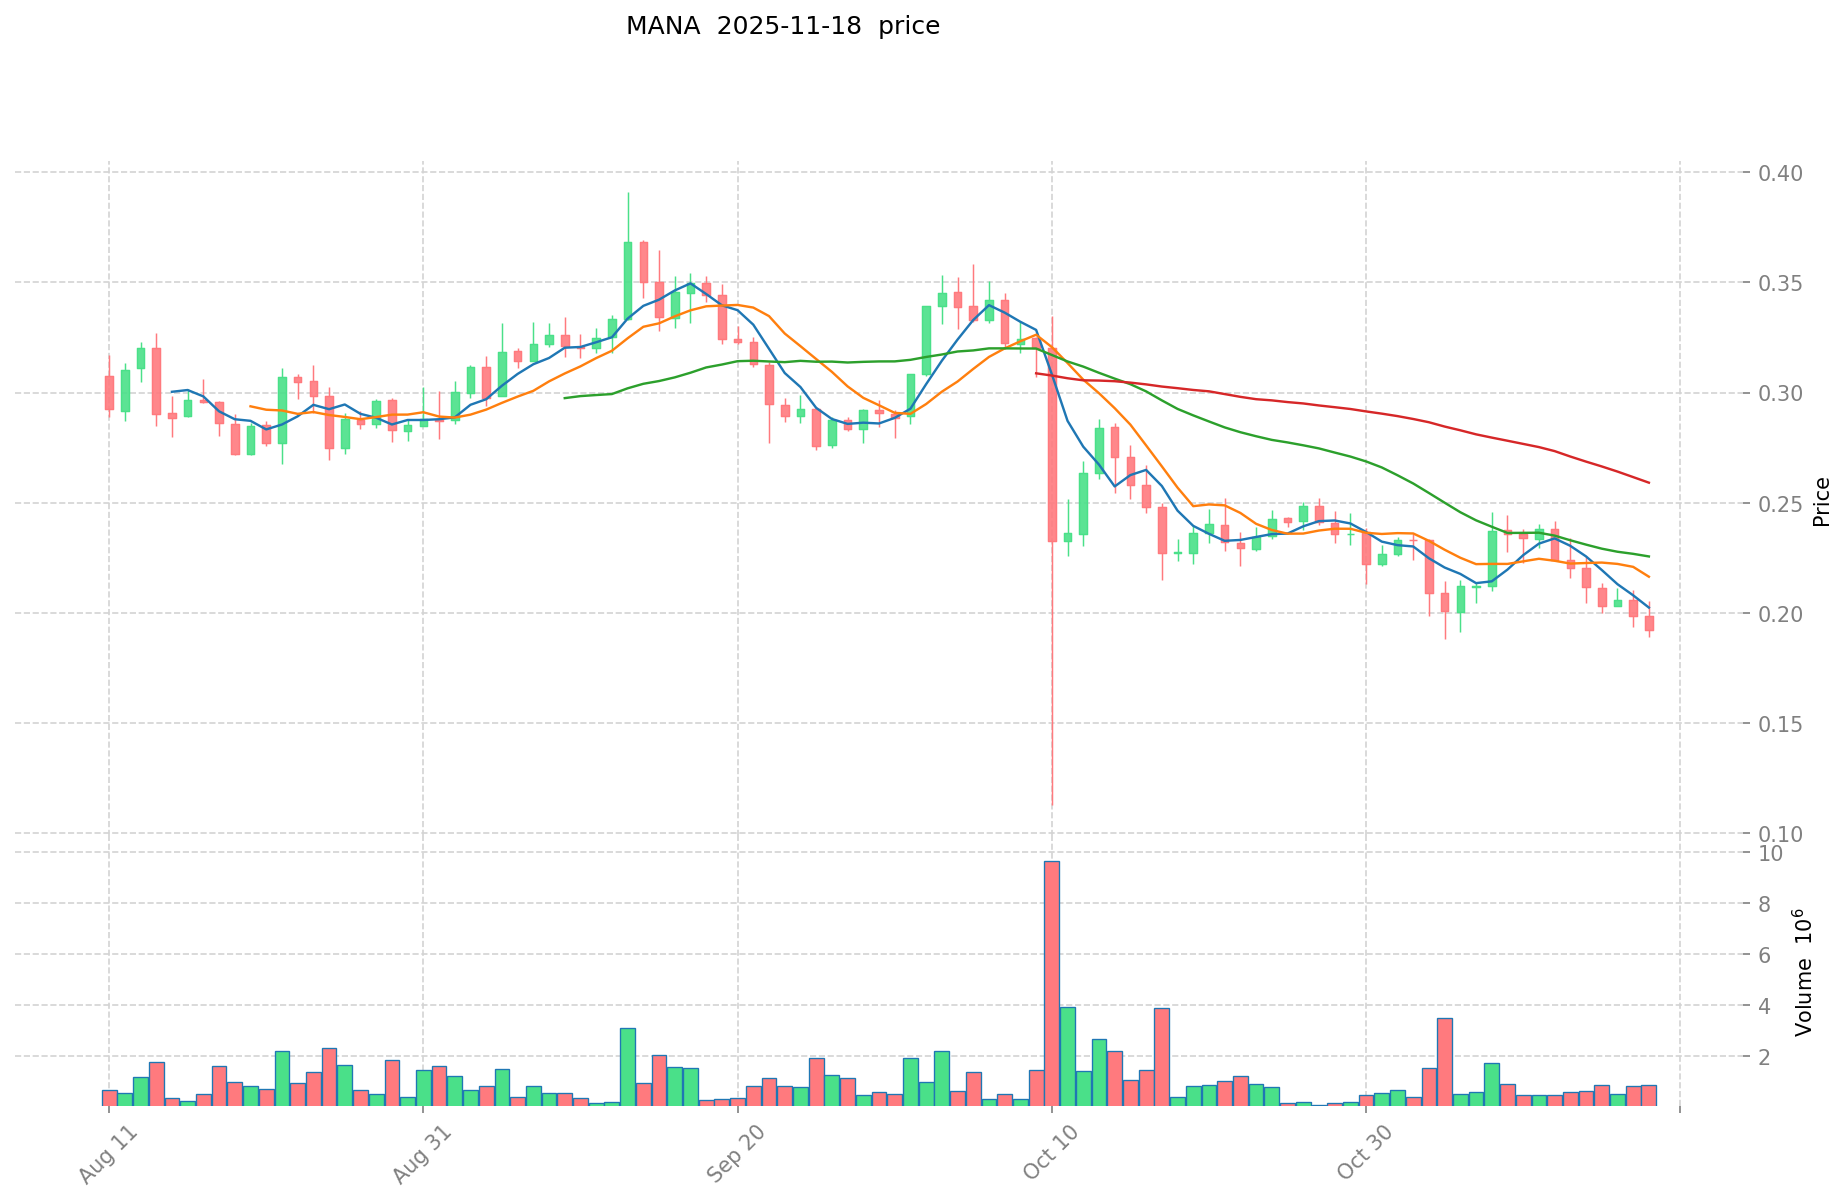
- 2021: MANA reached its all-time high of $5.85 on November 25, 2021.
- 2017: MANA hit its all-time low of $0.00923681 on October 31, 2017.
- Comparative analysis: In recent market cycles, DBR has shown significant volatility, ranging from $0.005 to $0.05764, while MANA has experienced a much wider price range from $0.00923681 to $5.85 over a longer period.
Current Market Situation (2025-11-18)
- DBR current price: $0.02351
- MANA current price: $0.1924
- 24-hour trading volume: DBR $265,034.27 vs MANA $167,215.47
- Market Sentiment Index (Fear & Greed Index): 14 (Extreme Fear)
Click to view real-time prices:
- Check DBR current price Market Price
- Check MANA current price Market Price
II. Core Factors Affecting Investment Value of MANA vs DBR
Supply Mechanism Comparison (Tokenomics)
-
MANA: Fixed supply cap of 2.19 billion MANA with deflationary mechanism through LAND purchases and marketplace transactions that burn MANA
-
DBR: Limited supply token with total cap of 20 million tokens, featuring initial allocation to DAO Treasury and gradual distribution to ecosystem participants
-
📌 Historical Pattern: Deflationary tokens like MANA tend to appreciate in value during high platform usage periods, while new tokens like DBR may experience higher volatility during initial distribution phases.
Institutional Adoption and Market Applications
- Institutional Holdings: MANA has attracted institutional investors through Grayscale's Decentraland Trust, while DBR currently has limited institutional presence
- Enterprise Adoption: MANA benefits from established partnerships with major brands for metaverse experiences, whereas DBR's adoption is primarily within the DeBank ecosystem for governance
- Regulatory Stance: Both tokens face varied regulatory treatment globally, with metaverse tokens generally receiving less scrutiny than financial-focused tokens
Technical Development and Ecosystem Building
- MANA Technical Upgrades: Continuous development of the Decentraland platform with improvements to the virtual world experience, SDK tools, and creator economy
- DBR Technical Development: Integration with DeBank's multi-chain portfolio tracker and development of DAO governance mechanisms
- Ecosystem Comparison: MANA offers a mature NFT marketplace, virtual land economy, and developer tools; DBR focuses on governance utility within DeBank's data analytics ecosystem
Macroeconomic Factors and Market Cycles
- Performance During Inflation: MANA has historically shown mixed correlation with inflation, while DBR is too new to establish clear patterns
- Macroeconomic Monetary Policy: Interest rate increases have generally impacted both metaverse and DeFi governance tokens negatively
- Geopolitical Factors: Growing metaverse adoption globally provides MANA with geographic diversification, while DBR remains primarily focused on DeFi users
III. 2025-2030 Price Prediction: DBR vs MANA
Short-term Prediction (2025)
- DBR: Conservative $0.014805 - $0.0235 | Optimistic $0.0235 - $0.030315
- MANA: Conservative $0.14415 - $0.1922 | Optimistic $0.1922 - $0.25947
Mid-term Prediction (2027)
- DBR may enter a growth phase, with an estimated price range of $0.028156008 - $0.03372855125
- MANA may enter a bullish market, with an estimated price range of $0.230487201 - $0.28262121075
- Key drivers: Institutional capital inflow, ETF developments, ecosystem growth
Long-term Prediction (2030)
- DBR: Base scenario $0.033356906608987 - $0.041696133261234 | Optimistic scenario $0.041696133261234 - $0.04628270791997
- MANA: Base scenario $0.19956580640451 - $0.3070243175454 | Optimistic scenario $0.3070243175454 - $0.396061369633566
Disclaimer
DBR:
| 年份 | 预测最高价 | 预测平均价格 | 预测最低价 | 涨跌幅 |
|---|---|---|---|---|
| 2025 | 0.030315 | 0.0235 | 0.014805 | 0 |
| 2026 | 0.03175085 | 0.0269075 | 0.016413575 | 14 |
| 2027 | 0.03372855125 | 0.029329175 | 0.028156008 | 24 |
| 2028 | 0.04067223343125 | 0.031528863125 | 0.0195478951375 | 34 |
| 2029 | 0.047291718244343 | 0.036100548278125 | 0.025631389277468 | 53 |
| 2030 | 0.04628270791997 | 0.041696133261234 | 0.033356906608987 | 77 |
MANA:
| 年份 | 预测最高价 | 预测平均价格 | 预测最低价 | 涨跌幅 |
|---|---|---|---|---|
| 2025 | 0.25947 | 0.1922 | 0.14415 | 0 |
| 2026 | 0.32294405 | 0.225835 | 0.14227605 | 17 |
| 2027 | 0.28262121075 | 0.274389525 | 0.230487201 | 42 |
| 2028 | 0.300785797305 | 0.278505367875 | 0.233944509015 | 44 |
| 2029 | 0.3244030525008 | 0.28964558259 | 0.231716466072 | 50 |
| 2030 | 0.396061369633566 | 0.3070243175454 | 0.19956580640451 | 59 |
IV. Investment Strategy Comparison: DBR vs MANA
Long-term vs Short-term Investment Strategies
- DBR: Suitable for investors focused on DeFi governance and ecosystem potential
- MANA: Suitable for investors interested in metaverse growth and virtual economy
Risk Management and Asset Allocation
- Conservative investors: DBR: 20% vs MANA: 80%
- Aggressive investors: DBR: 40% vs MANA: 60%
- Hedging tools: Stablecoin allocation, options, cross-currency portfolio
V. Potential Risk Comparison
Market Risk
- DBR: High volatility due to lower market cap and newer token status
- MANA: Susceptibility to metaverse market trends and overall crypto market sentiment
Technical Risk
- DBR: Scalability, network stability
- MANA: Platform adoption, virtual world performance issues
Regulatory Risk
- Global regulatory policies may have different impacts on DeFi governance tokens (DBR) and metaverse tokens (MANA)
VI. Conclusion: Which Is the Better Buy?
📌 Investment Value Summary:
- DBR advantages: DeFi governance utility, potential for growth within DeBank ecosystem
- MANA advantages: Established metaverse platform, brand partnerships, deflationary mechanism
✅ Investment Advice:
- New investors: Consider a larger allocation to MANA due to its established market presence
- Experienced investors: Balanced approach with exposure to both DBR and MANA
- Institutional investors: MANA for metaverse exposure, DBR for DeFi governance participation
⚠️ Risk Warning: Cryptocurrency markets are highly volatile. This article does not constitute investment advice. None
VII. FAQ
Q1: What are the main differences between DBR and MANA? A: DBR is a DeFi governance token for the DeBank ecosystem, while MANA is the native currency of the Decentraland metaverse platform. DBR has a total supply cap of 20 million tokens, whereas MANA has a fixed supply of 2.19 billion tokens with a deflationary mechanism.
Q2: Which token has shown better historical price performance? A: MANA has shown a wider price range over a longer period, reaching an all-time high of $5.85 in November 2021. DBR, being newer, has experienced significant volatility within a smaller price range, with an all-time high of $0.05764 in December 2024.
Q3: How do institutional adoption and market applications differ between DBR and MANA? A: MANA has attracted institutional investors through Grayscale's Decentraland Trust and has established partnerships with major brands for metaverse experiences. DBR currently has limited institutional presence and is primarily adopted within the DeBank ecosystem for governance purposes.
Q4: What are the key factors affecting the future price predictions for DBR and MANA? A: Key factors include institutional capital inflow, ETF developments, ecosystem growth, macroeconomic conditions, regulatory developments, and the overall adoption of DeFi and metaverse technologies.
Q5: How should investors approach asset allocation between DBR and MANA? A: Conservative investors might consider allocating 20% to DBR and 80% to MANA, while aggressive investors could opt for a 40% DBR and 60% MANA split. The exact allocation should be based on individual risk tolerance and investment goals.
Q6: What are the main risks associated with investing in DBR and MANA? A: Both tokens face market risks related to crypto volatility. DBR has higher volatility due to its lower market cap and newer status. MANA is susceptible to metaverse market trends. Technical risks include scalability issues for DBR and platform adoption challenges for MANA. Both face varying degrees of regulatory risk depending on global policies towards DeFi and metaverse tokens.
Share
Content
Introduction: DBR vs MANA Investment Comparison
I. Price History Comparison and Current Market Status
II. Core Factors Affecting Investment Value of MANA vs DBR
III. 2025-2030 Price Prediction: DBR vs MANA
IV. Investment Strategy Comparison: DBR vs MANA
V. Potential Risk Comparison
VI. Conclusion: Which Is the Better Buy?
VII. FAQ

