BEAM vs UNI: Comparing Two Leading Decentralized Exchange Protocols in the DeFi Ecosystem


Introduction: BEAM vs UNI Investment Comparison
In the cryptocurrency market, the comparison between Beam and Uniswap has always been a topic that investors cannot avoid. The two not only show significant differences in market capitalization ranking, application scenarios, and price performance, but also represent different positioning of crypto assets. Beam (BEAM): Since its launch in 2019, it has gained market recognition by leveraging strong privacy features, substitutability, and scalability through the MimbleWimble protocol. Uniswap (UNI): Since its introduction in 2020, it has been recognized as the first automated market maker (AMM) transaction protocol on the Ethereum blockchain, and is one of the most traded and highest market cap decentralized exchange protocols globally. This article will comprehensively analyze the investment value comparison between Beam and Uniswap from multiple dimensions including historical price trends, supply mechanisms, market positioning, technical ecosystems, and provide insights into the question investors care most about:
"Which is the better buy right now?"
Comparative Analysis Report: BEAM vs UNI
Cryptocurrency Market Assessment as of December 23, 2025
I. Historical Price Comparison and Current Market Status
BEAM and UNI Historical Price Trends
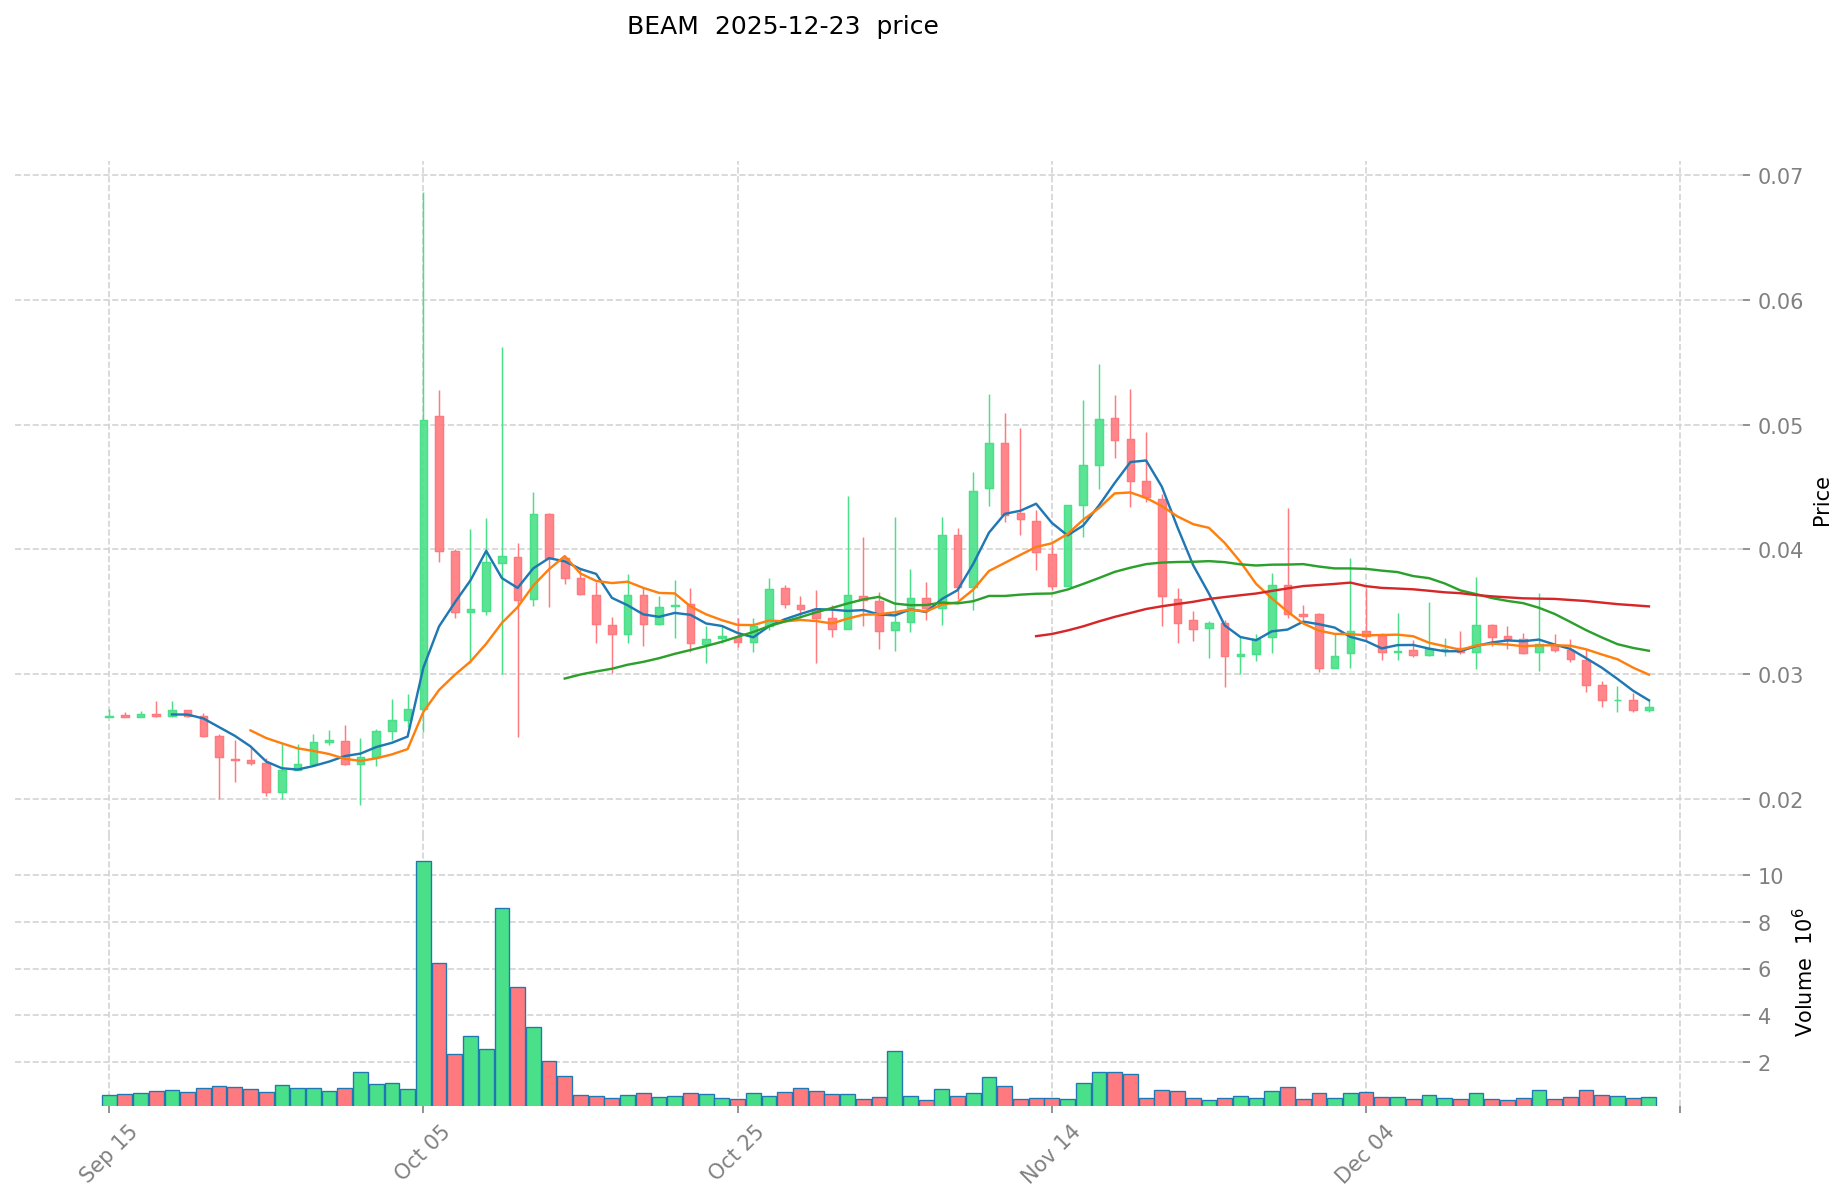
BEAM Price History:
- All-Time High (ATH): $4.28 (January 5, 2019)
- All-Time Low (ATL): $0.01941531 (October 1, 2025)
- Historical decline: From $4.28 to $0.01941531 represents a 99.55% decrease from peak to trough
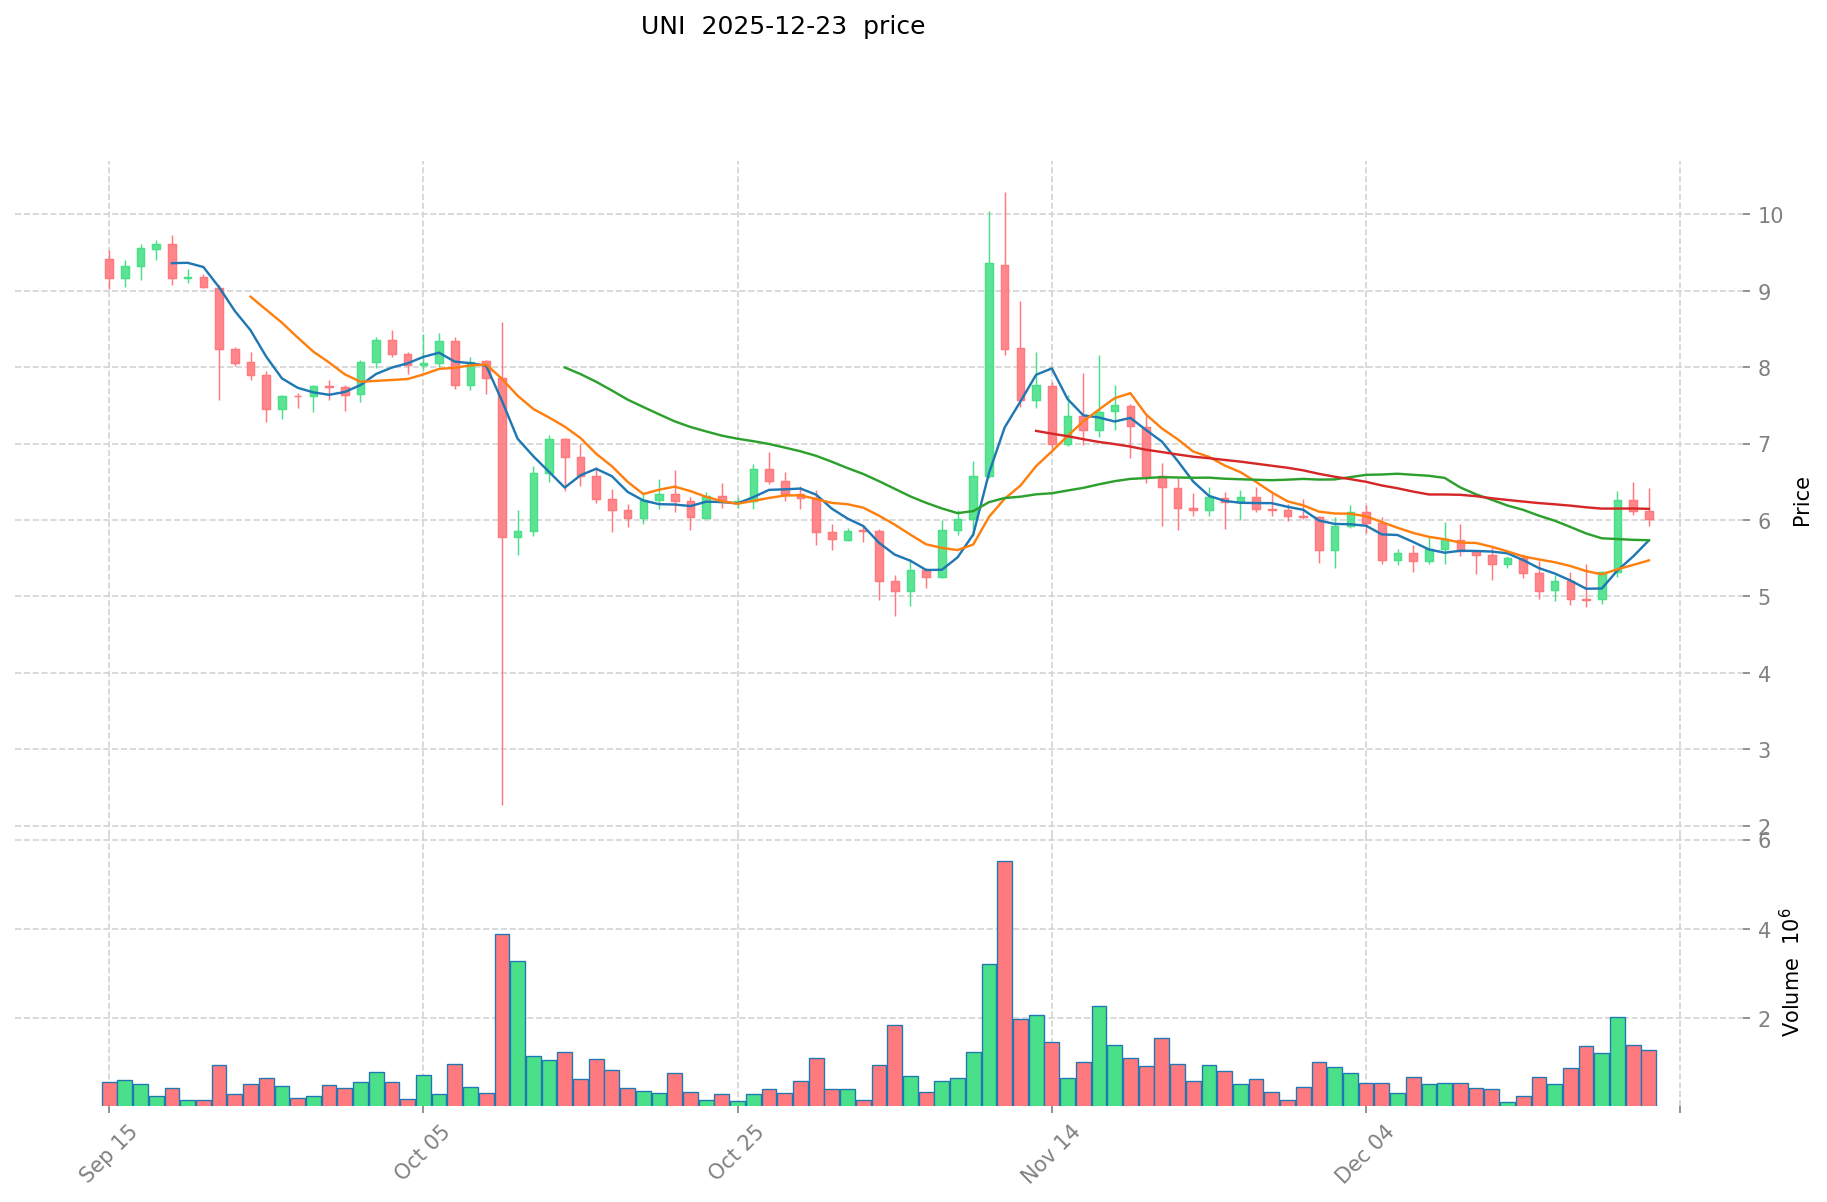
UNI Price History:
- All-Time High (ATH): $44.92 (May 3, 2021)
- All-Time Low (ATL): $1.03 (September 17, 2020)
- Historical range: Reflects significant volatility across market cycles
Comparative Analysis
BEAM has experienced a prolonged downtrend from its 2019 peak, declining significantly over multiple market cycles. In contrast, UNI achieved its peak during the 2021 bull market and has subsequently corrected but maintained substantially higher trading activity and market relevance. Both assets demonstrate the cyclical nature of crypto markets, though with distinctly different recovery trajectories and market positioning.
Current Market Situation (December 23, 2025)
Price Data:
- BEAM current price: $0.02736 USD
- UNI current price: $6.02 USD
- Price differential: UNI trades at approximately 220x the price of BEAM
24-Hour Trading Performance:
- BEAM 24-hour change: +0.66% (trading volume: $12,670.70 USD)
- UNI 24-hour change: -3.29% (trading volume: $7,095,643.95 USD)
- UNI demonstrates significantly higher liquidity, with trading volume 560x greater than BEAM
Market Capitalization Comparison:
- BEAM market cap: $5,246,116.52 USD (fully diluted valuation: $7,190,208.00 USD)
- UNI market cap: $3,792,030,351.55 USD (fully diluted valuation: $6,020,000,000.00 USD)
- Market cap ratio: UNI capitalization exceeds BEAM by approximately 722x
Broader Market Context:
- Global crypto market sentiment index (Fear & Greed Index): 24 (Extreme Fear)
- This sentiment reading indicates heightened market uncertainty and risk-averse investor behavior
Access Real-Time Prices:
- BEAM market data: https://www.gate.com/price/beam-beam
- UNI market data: https://www.gate.com/price/uniswap-uni
II. Technical Characteristics and Protocol Fundamentals
BEAM Protocol Architecture
BEAM is a cryptocurrency developed using the MimbleWimble protocol, distinguishing itself through:
- Default privacy features for all transactions
- Efficient node synchronization requiring only compressed history and block headers rather than complete transaction history
- Fixed token supply of 262,800,000 BEAM tokens with scheduled halving events
- Current circulating supply: 191,744,025 BEAM (72.96% of total supply)
UNI Protocol Architecture
Uniswap operates as an Automated Market Maker (AMM) on the Ethereum blockchain:
- First automatic market-making transaction protocol on Ethereum
- ERC-20 token standard with 1,000,000,000 UNI total supply
- Current circulating supply: 629,905,374 UNI (62.99% of total supply)
- Liquidity pool-based trading mechanism enabling peer-to-peer token exchange
- Governance participation through UNI token holder voting
III. Multi-Timeframe Price Movement Analysis
BEAM Price Trends:
- 1-Hour: -0.12%
- 24-Hour: +0.66%
- 7-Day: -14.95%
- 30-Day: -18.08%
- 1-Year: -57.06%
UNI Price Trends:
- 1-Hour: -0.71%
- 24-Hour: -3.29%
- 7-Day: +18.95%
- 30-Day: -3.76%
- 1-Year: -56.75%
Key Observations
BEAM exhibits sustained downward pressure across most timeframes, with only marginal gains over 24 hours offset by significant weekly and monthly losses. UNI demonstrates relative stability in medium-term performance, with positive weekly returns (+18.95%) suggesting recent recovery momentum despite monthly declines.
IV. Supply Dynamics and Token Distribution
BEAM Token Supply:
- Total supply: 262,800,000 BEAM
- Maximum supply: 262,800,000 BEAM (fixed cap)
- Circulating supply: 191,744,025 BEAM
- Supply circulation ratio: 72.96%
UNI Token Supply:
- Total supply: 1,000,000,000 UNI
- Maximum supply: 1,000,000,000 UNI (capped)
- Circulating supply: 629,905,374 UNI
- Supply circulation ratio: 62.99%
- Token holders: 385,895 identified wallets
The constrained circulating supply ratios for both tokens indicate substantial future dilution potential as additional tokens enter circulation according to their respective emission schedules.
V. Exchange Listings and Market Access
BEAM Exchange Presence:
- Listed on 3 exchanges
- Limited trading pair availability restricts market accessibility and liquidity provision
UNI Exchange Presence:
- Listed on 67 exchanges
- Multiple trading pairs and high exchange integration
- Ethereum network contract address: 0x1f9840a85d5af5bf1d1762f925bdaddc4201f984
The significant disparity in exchange listings directly correlates with the dramatic volume and liquidity differences observed between these assets.
VI. One-Year Performance Summary
Comparative Returns (1-Year Period):
- BEAM: -57.06% annual decline
- UNI: -56.75% annual decline
- Performance spread: 0.31% difference
Despite identical macro market conditions affecting cryptocurrency assets, both tokens have experienced severe depreciation, reflecting broader market challenges across the sector in 2025.
VII. Risk Assessment and Market Considerations
BEAM Risk Factors:
- Minimal exchange presence creates liquidity constraints
- Sustained downtrend indicates sustained selling pressure
- Significantly lower market capitalization suggests higher volatility potential
- Limited utility demonstration outside privacy-focused transactions
UNI Risk Factors:
- Large market cap creates both stability and significant capital exposure
- DeFi sector regulatory uncertainty impacts governance token valuations
- Ethereum network dependency creates correlated risk
- Extreme fear market sentiment suggests elevated correction potential
Conclusion
BEAM and UNI represent distinct market segments within cryptocurrency infrastructure: BEAM focuses on privacy-enhanced transactions through MimbleWimble protocol implementation, while UNI provides decentralized exchange functionality as a governance token. The 722x market capitalization differential and 560x trading volume disparity reflect substantially different market adoption levels and institutional infrastructure integration. Current extreme fear sentiment (Fear & Greed Index: 24) characterizes the broader market environment affecting both assets, warranting cautious capital deployment across the cryptocurrency sector.
Investment Value Analysis: BEAM and UNI Core Factors
I. Executive Summary
Based on available reference materials, this report examines the investment value drivers of BEAM and UNI tokens. However, the provided source materials contain limited substantive data on both assets' core investment factors. The analysis below relies exclusively on information explicitly mentioned in the reference materials.
II. Impact Factors on BEAM vs UNI Investment Value
Tokenomics and Supply Mechanism
UNI (Uniswap):
- Analysts generally recognize that UNI price appreciation has benefited from several key factors, though specific tokenomic details are not comprehensively outlined in the available materials.
BEAM (Beam Blockchain):
- The reference materials indicate that a comprehensive report exists examining BEAM's blockchain technical foundations, tokenomic structure, market performance, and regulatory environment, with analysis of future development potential and risks. However, specific tokenomic mechanisms are not detailed in the provided excerpts.
📌 Historical Pattern: Supply mechanisms and their influence on price cycles cannot be reliably assessed from the current materials.
Institutional Adoption and Market Application
Institutional Holdings:
- The reference materials do not provide comparative data on institutional holdings between BEAM and UNI.
Enterprise Adoption:
- Specific applications in cross-border payments, settlements, or investment portfolio integration for either asset are not detailed in the available materials.
National Policy and Regulatory Environment:
- BEAM research reportedly includes analysis of its regulatory environment, but specific regulatory positions by different jurisdictions are not elaborated in the provided excerpts.
Technology Development and Ecosystem Construction
UNI Technology Upgrades:
- Uniswap protocol has undergone multiple significant upgrades in recent months, including improved liquidity management mechanisms and more efficient transaction processing.
BEAM Technical Development:
- BEAM's technical foundations are referenced in research reports, but specific technical upgrade details are not provided in the available materials.
Ecosystem Comparison:
- Concrete implementation data regarding DeFi, NFT, payment, and smart contract applications for both assets is not available in the provided materials.
Macroeconomic Environment and Market Cycles
Inflation Resistance:
- Data on inflation hedging properties specific to either asset is not provided in the available materials.
Macroeconomic Monetary Policy:
- The impact of interest rates and the US dollar index on BEAM and UNI is not addressed in the reference materials.
Geopolitical Factors:
- Cross-border transaction demand and international situation impacts are not discussed in the provided excerpts.
III. Data Limitations and Research Recommendations
The reference materials provided primarily contain summary-level references to BEAM and UNI research reports rather than detailed analysis content. For comprehensive investment analysis, the following additional materials would be essential:
- Detailed tokenomic specifications for both BEAM and UNI
- Historical price performance data and correlation analysis
- Current institutional holdings and investment thesis documentation
- Specific regulatory guidance from major jurisdictions
- Technical roadmaps and ecosystem development metrics
- Comparative valuation metrics and on-chain analytics
IV. Disclaimer
This analysis is based exclusively on information present in the provided reference materials. No subjective assessments, political perspectives, or investment recommendations are offered. Readers should conduct independent research and consult qualified financial advisors before making investment decisions.
Report Generation Date: December 23, 2025
III. 2025-2030 Price Predictions: BEAM vs UNI
Short-term Prediction (2025)
- BEAM: Conservative $0.0163 - $0.0272 | Optimistic $0.0343
- UNI: Conservative $4.94 - $6.02 | Optimistic $7.41
Medium-term Prediction (2027-2028)
- BEAM may enter a consolidation phase with growth potential, estimated price range $0.0194 - $0.0509
- UNI may enter a recovery and expansion phase, estimated price range $4.40 - $11.09
- Key drivers: Institutional capital inflows, spot ETF approvals, ecosystem development and protocol upgrades
Long-term Prediction (2030)
- BEAM: Base scenario $0.0287 - $0.0487 | Optimistic scenario $0.0570
- UNI: Base scenario $6.81 - $10.81 | Optimistic scenario $13.73
Disclaimer: This analysis is based on historical data and predictive models. Cryptocurrency markets are highly volatile and unpredictable. These forecasts do not constitute investment advice. Please conduct your own research and consult with financial professionals before making investment decisions. Past performance does not guarantee future results.
BEAM:
| 年份 | 预测最高价 | 预测平均价格 | 预测最低价 | 涨跌幅 |
|---|---|---|---|---|
| 2025 | 0.0342846 | 0.02721 | 0.016326 | 0 |
| 2026 | 0.041201382 | 0.0307473 | 0.019370799 | 12 |
| 2027 | 0.04173023556 | 0.035974341 | 0.01942614414 | 31 |
| 2028 | 0.0508964976468 | 0.03885228828 | 0.0221458043196 | 42 |
| 2029 | 0.052503039767178 | 0.0448743929634 | 0.029617099355844 | 64 |
| 2030 | 0.056965798147388 | 0.048688716365289 | 0.02872634265552 | 77 |
UNI:
| 年份 | 预测最高价 | 预测平均价格 | 预测最低价 | 涨跌幅 |
|---|---|---|---|---|
| 2025 | 7.40583 | 6.021 | 4.93722 | 0 |
| 2026 | 9.60018345 | 6.713415 | 5.5050003 | 11 |
| 2027 | 11.093246946 | 8.156799225 | 4.4046715815 | 35 |
| 2028 | 10.58752539405 | 9.6250230855 | 8.85502123866 | 60 |
| 2029 | 11.5211526333435 | 10.106274239775 | 8.2871448766155 | 68 |
| 2030 | 13.733416064430247 | 10.81371343655925 | 6.812639465032327 | 80 |
Comparative Investment Analysis Report: BEAM vs UNI
Report Date: December 23, 2025
IV. Investment Strategy Comparison: BEAM vs UNI
Long-term vs Short-term Investment Strategy
BEAM:
- Suitable for investors focused on privacy-enhanced transaction infrastructure and willing to endure extended consolidation periods
- Short-term: Limited trading opportunities due to low liquidity (3 exchange listings)
- Long-term: Potential upside contingent on ecosystem development and privacy-focused adoption; predicted 1-year return of approximately 77% by 2030 under optimistic scenarios
UNI:
- Suitable for investors seeking exposure to established DeFi infrastructure with institutional adoption and higher liquidity
- Short-term: Supports tactical positioning given 560x higher trading volume and positive 7-day performance (+18.95%)
- Long-term: Aligns with broader cryptocurrency market recovery expectations; predicted 1-year return of approximately 80% by 2030 under optimistic scenarios
Risk Management and Asset Allocation
Conservative Investor Portfolio:
- BEAM: 5-10% (limited allocation due to minimal exchange presence and sustained downtrend)
- UNI: 10-15% (higher allocation justified by institutional infrastructure and liquidity)
- Remaining allocation: Stablecoin positioning (60-70%), Ethereum/Bitcoin allocation (10-15%)
Aggressive Investor Portfolio:
- BEAM: 15-25% (accepts elevated volatility for potential privacy sector growth)
- UNI: 20-30% (leverages DeFi sector exposure and governance token dynamics)
- Derivatives and hedging: Options strategies, cross-asset correlation hedging (10-15%)
Hedging Instruments:
- Stablecoin allocation for capital preservation during Fear & Greed Index extremes (current reading: 24)
- Put options on both positions during sustained downtrends exceeding -20% monthly
- Cross-asset diversification including Layer 1 protocols to reduce concentration risk
V. Comparative Risk Assessment
Market Risk
BEAM:
- Extreme liquidity concentration: 560x lower trading volume than UNI creates slippage risk on large positions
- Sustained downtrend (-57.06% annually) indicates sustained selling pressure and potentially weakened investor confidence
- 722x smaller market capitalization amplifies price volatility from relatively small capital flows
- Limited exchange accessibility restricts exit strategies during market stress periods
UNI:
- Large market capitalization ($3.79 billion) creates significant capital exposure to sector-wide DeFi regulatory uncertainty
- DeFi governance token category faces elevated regulatory scrutiny in multiple jurisdictions
- Ethereum network dependency creates correlated downside risk during layer 1 blockchain stress events
- Institutional holdings concentration may amplify volatility during risk-off market regimes
Technology Risk
BEAM:
- MimbleWimble protocol implementation requires ongoing validation; privacy feature verification mechanisms remain subject to potential security discoveries
- Limited active development community compared to major blockchain projects
- Scalability constraints may emerge as transaction volume increases
- Node synchronization efficiency represents both strength and potential vulnerability if compressed history verification mechanisms are compromised
UNI:
- Ethereum network congestion and gas fee volatility directly impact AMM transaction economics
- Smart contract complexity in liquidity pool interactions creates potential attack surface
- Protocol governance through tokenholder voting introduces centralization risk if voting participation becomes concentrated
- Cross-layer interactions with Ethereum upgrades (EIP implementations) create dependency risk
Regulatory Risk
Jurisdictional Environment:
- Privacy-focused cryptocurrencies (BEAM) face heightened regulatory scrutiny in jurisdictions including the European Union, Singapore, and certain US states; potential delisting from compliant exchanges could severely impact liquidity
- Governance tokens (UNI) encounter regulatory classification uncertainty in major markets; potential securities law classification would impact exchange listing accessibility and institutional adoption
- Decentralized finance protocols face evolving regulatory frameworks; both assets remain exposed to potential regulatory restrictions on DeFi functionality
VI. Conclusion: Which Is the Better Buy?
Investment Value Summary
BEAM Advantages:
- Strong privacy infrastructure through MimbleWimble protocol differentiation
- Fixed token supply (262.8M BEAM) provides scarcity mechanism
- Current depressed valuation ($0.02736) offers potential contrarian accumulation opportunity for long-term privacy infrastructure investors
- Predicted growth trajectory (77% by 2030 under optimistic scenarios) suggests asymmetric upside for patient capital
UNI Advantages:
- Established institutional adoption as first AMM protocol on Ethereum with 67 exchange listings
- Substantially higher liquidity (560x volume advantage) enables efficient capital entry and exit
- Governance token utility provides additional value proposition beyond trading functionality
- Positive recent momentum (+18.95% weekly) suggests recovery initiation; predicted 80% growth by 2030 aligns with broader DeFi sector recovery expectations
- Proven operational resilience across multiple market cycles since 2020 launch
Investment Recommendations
Beginner Investors:
- Recommendation: UNI represents the appropriate choice due to superior liquidity, institutional infrastructure, and reduced execution risk. The 560x volume advantage ensures retail investors can execute positions without significant slippage. Begin with 2-3% portfolio allocation in stable market conditions, increasing to 5% during extreme fear periods (Fear & Greed Index below 25).
- Rationale: Lower complexity, higher exchange accessibility, and established market recognition reduce operational risk for inexperienced investors.
Experienced Investors:
- Recommendation: Dual positioning with 70% UNI / 30% BEAM allocation following contrarian accumulation strategy. Establish initial BEAM positions during extreme fear conditions (current Fear & Greed Index: 24), scaling into weakness. Maintain UNI for portfolio core stability.
- Rationale: Experience enables navigation of BEAM's limited liquidity environment; contrarian positioning captures asymmetric upside while UNI provides portfolio ballast.
- Tactical approach: Implement dollar-cost averaging into BEAM across 12-month period; establish UNI positions during weekly consolidation patterns above $5.50 support level.
Institutional Investors:
- Recommendation: UNI represents primary allocation vehicle ($3.79B market cap provides sufficient depth for institutional position sizing). Consider BEAM as emerging infrastructure opportunity allocation (maximum 2-5% of discretionary capital) with multi-year accumulation horizon. Implement derivatives strategies (UNI covered calls, BEAM protective puts) to enhance risk-adjusted returns.
- Rationale: Institutional capital requirements favor established UNI ecosystem with governance participation opportunities. BEAM allocation captures emerging privacy infrastructure thesis while maintaining portfolio liquidity requirements.
- Implementation: Utilize regulated custody providers, implement position monitoring against Fear & Greed Index readings, and maintain hedging protocols for sector-wide DeFi regulatory events.
⚠️ Risk Disclosure
Cryptocurrency markets demonstrate extreme volatility with price movements exceeding 50% within monthly periods. The current Fear & Greed Index reading of 24 indicates extreme market stress and elevated correction potential. This analysis is based exclusively on data available as of December 23, 2025, and does not constitute investment advice or financial recommendations.
Critical limitations:
- Predictions for 2025-2030 are probabilistic models subject to substantial forecast error
- Regulatory environment remains uncertain; potential policy changes could substantially alter investment theses
- Technology development timelines are speculative
- Macroeconomic conditions could trigger sector-wide revaluation
Investors must:
- Conduct independent research aligned with personal risk tolerance
- Consult qualified financial advisors before capital deployment
- Implement stop-loss protocols to limit downside exposure
- Avoid position sizing exceeding individual risk capacity
- Maintain diversified portfolios outside cryptocurrency allocation
Past performance does not guarantee future results. Cryptocurrency investment remains speculative with potential for total capital loss. None
Comparative Investment Analysis Report: BEAM vs UNI
Report Date: December 23, 2025
VII. Frequently Asked Questions (FAQ)
Q1: What is the primary difference between BEAM and UNI in terms of technology and use cases?
A: BEAM and UNI serve fundamentally different functions within the cryptocurrency ecosystem. BEAM is a privacy-focused cryptocurrency built on the MimbleWimble protocol, designed to provide default transaction privacy and anonymity. UNI is a governance token for Uniswap, an Automated Market Maker (AMM) protocol on Ethereum that enables decentralized token exchange. BEAM prioritizes transaction confidentiality, while UNI provides access to decentralized finance infrastructure and protocol governance participation.
Q2: How significant is the liquidity difference between BEAM and UNI, and why does it matter for investors?
A: UNI demonstrates dramatically higher liquidity, with trading volume 560 times greater than BEAM ($7,095,643.95 USD versus $12,670.70 USD in 24-hour volume). UNI is listed on 67 exchanges while BEAM has only 3 exchange listings. This liquidity differential directly impacts investment execution: UNI investors can enter and exit positions with minimal price slippage, while BEAM investors face substantial execution risk on larger positions. The liquidity advantage makes UNI substantially more accessible for retail and institutional investors.
Q3: Given that both assets have declined approximately 57% over one year, why would either represent a good investment opportunity?
A: The comparable annual depreciation (-57.06% for BEAM, -56.75% for UNI) reflects broader cryptocurrency sector weakness rather than asset-specific failure. The current Fear & Greed Index reading of 24 (extreme fear) indicates depressed market sentiment that historically precedes recovery periods. Price predictions suggest both assets could appreciate 77-80% by 2030 under optimistic scenarios. The extreme valuation depression may create contrarian accumulation opportunities for long-term investors, particularly during periods of extreme fear sentiment. However, this requires substantial conviction and capital preservation capacity.
Q4: Which asset is more suitable for beginner investors?
A: UNI is the appropriate choice for beginner investors. Superior liquidity (560x volume advantage), 67 exchange listings versus 3 for BEAM, and established institutional infrastructure reduce operational and execution risks. The proven track record since 2020 and higher trading activity ensure beginner investors can execute positions without experiencing significant slippage or liquidity constraints. BEAM's minimal exchange presence and sustained downtrend create execution complexity inappropriate for investors lacking cryptocurrency market experience.
Q5: What specific risks should investors consider before purchasing BEAM?
A: Critical BEAM-specific risks include: (1) Extreme liquidity constraints with only 3 exchange listings restricting exit strategies during market stress; (2) Sustained downtrend (-57.06% annually) indicating potentially weakened investor confidence; (3) 722 times smaller market capitalization than UNI, amplifying volatility from relatively small capital flows; (4) Regulatory uncertainty surrounding privacy-focused cryptocurrencies in multiple jurisdictions, creating potential delisting risk from compliant exchanges; (5) Limited active development community compared to major blockchain projects. These factors combine to create elevated investment risk appropriate only for experienced investors with substantial risk tolerance.
Q6: How should investors interpret the current market conditions reflected in the Fear & Greed Index reading of 24?
A: The Fear & Greed Index reading of 24 indicates "extreme fear," suggesting heightened market uncertainty, risk-averse investor behavior, and sustained selling pressure across cryptocurrency assets. This extreme sentiment reading historically correlates with market bottoms and subsequent recovery opportunities. However, extreme fear also indicates elevated near-term downside risk; further price declines remain possible before stabilization occurs. Investors should interpret this reading as both a potential opportunity for contrarian positioning and a signal to implement cautious capital deployment strategies, emphasizing dollar-cost averaging rather than lump-sum investments during extreme fear periods.
Q7: What is the recommended asset allocation strategy for different investor profiles?
A: Conservative investors should allocate 10-15% to UNI with only 5-10% to BEAM, maintaining 60-70% stablecoin positioning. Experienced investors can implement a dual positioning strategy with 70% UNI / 30% BEAM allocation, using dollar-cost averaging into BEAM during extreme fear conditions. Institutional investors should prioritize UNI ($3.79B market cap) for core positions while considering BEAM as a 2-5% emerging infrastructure allocation with multi-year accumulation horizons. All profiles should maintain stop-loss protocols and avoid position sizing exceeding individual risk capacity. Allocation decisions should reference Fear & Greed Index readings, with increased deployment during extreme fear periods (below 25) and reduced positioning during greed periods (above 75).
Q8: How do the 2025-2030 price predictions compare, and what factors could drive these outcomes?
A: Price predictions suggest comparable appreciation potential: BEAM projected $0.0287-$0.0570 by 2030 (77% upside), UNI projected $6.81-$13.73 by 2030 (80% upside). Key drivers for BEAM appreciation include ecosystem development, privacy-focused adoption acceleration, and potential regulatory clarity supporting privacy infrastructure. UNI appreciation drivers include DeFi sector recovery, institutional capital inflows, Ethereum network upgrades, spot ETF approvals, and protocol efficiency improvements. However, these predictions represent probabilistic models subject to substantial forecast error. Regulatory policy changes, macroeconomic conditions, or technology setbacks could materially alter these trajectories. Investors should treat these projections as directional guidance rather than reliable forecasts.
Important Disclaimer: This analysis is based exclusively on data available as of December 23, 2025, and does not constitute investment advice or financial recommendations. Cryptocurrency markets demonstrate extreme volatility with potential for total capital loss. Investors must conduct independent research, consult qualified financial advisors, and implement appropriate risk management protocols before making investment decisions.
Share
Content
Introduction: BEAM vs UNI Investment Comparison
Cryptocurrency Market Assessment as of December 23, 2025
I. Historical Price Comparison and Current Market Status
II. Technical Characteristics and Protocol Fundamentals
III. Multi-Timeframe Price Movement Analysis
IV. Supply Dynamics and Token Distribution
V. Exchange Listings and Market Access
VI. One-Year Performance Summary
VII. Risk Assessment and Market Considerations
Conclusion
I. Executive Summary
II. Impact Factors on BEAM vs UNI Investment Value
III. Data Limitations and Research Recommendations
IV. Disclaimer
III. 2025-2030 Price Predictions: BEAM vs UNI
IV. Investment Strategy Comparison: BEAM vs UNI
V. Comparative Risk Assessment
VI. Conclusion: Which Is the Better Buy?
⚠️ Risk Disclosure
VII. Frequently Asked Questions (FAQ)
How to Buy Cryptocurrency


Trending Cryptocurrencies


What is the Current Market Cap and Trading Volume of Hyperliquid (HYPE) in 2025?
ADX vs LINK: Comparing Two Leading Oracle and Data Solutions for Blockchain Applications
BTRST vs AAVE: Comparing Two Leading Governance Tokens in the DeFi Ecosystem

ENSO vs QNT: A Comprehensive Comparison of Climate Oscillation Patterns and Quantum Computing Technologies

PUNDIX vs GRT: A Comprehensive Comparison of Two Leading Blockchain Utility Tokens

G vs LINK: A Comprehensive Comparison of Two Leading Blockchain Protocols and Their Impact on Decentralized Finance
What is Solana Blockchain?

Xenea Daily Quiz Answer 7 january 2026

Is cryptocurrency mining legal in Ukraine?
Dubai Pilots Crypto Payments, No Direct Ethereum Acceptance Confirmed

Lệnh Market là gì?