AGI vs DOT: Which Blockchain Network Offers Superior Scalability and Interoperability for Enterprise Adoption

Introduction: AGI vs DOT Investment Comparison
In the cryptocurrency market, the comparison between AGI and DOT has always been a topic that investors cannot avoid. The two not only differ significantly in market capitalization rankings, application scenarios, and price performance, but also represent different positioning of crypto assets.
AGI (Delysium): Committed to building a virtual world where 1 billion people and 100 billion AI virtual humans can coexist on the blockchain, with virtual humans serving as digital avatars, companions, and non-player characters (NPCs) across different ecosystem scenes including games, communities, and media platforms.
DOT (Polkadot): Aims to connect private chains, alliance chains, public chains, open networks, and oracles, as well as future technologies yet to be created. Independent blockchains can exchange information and transactions without trust through Polkadot's relay chain, making it easier than ever to create and connect decentralized applications, services, and institutions.
This article will provide a comprehensive analysis of the investment value comparison between AGI and DOT from the perspectives of historical price trends, supply mechanisms, adoption dynamics, technical ecosystems, and future outlook, attempting to answer the question investors care most about:
"Which is the better buy right now?"
Cryptocurrency Market Analysis Report: Delysium (AGI) vs Polkadot (DOT)
I. Price History Comparison and Current Market Status
Historical Price Trends: AGI and DOT
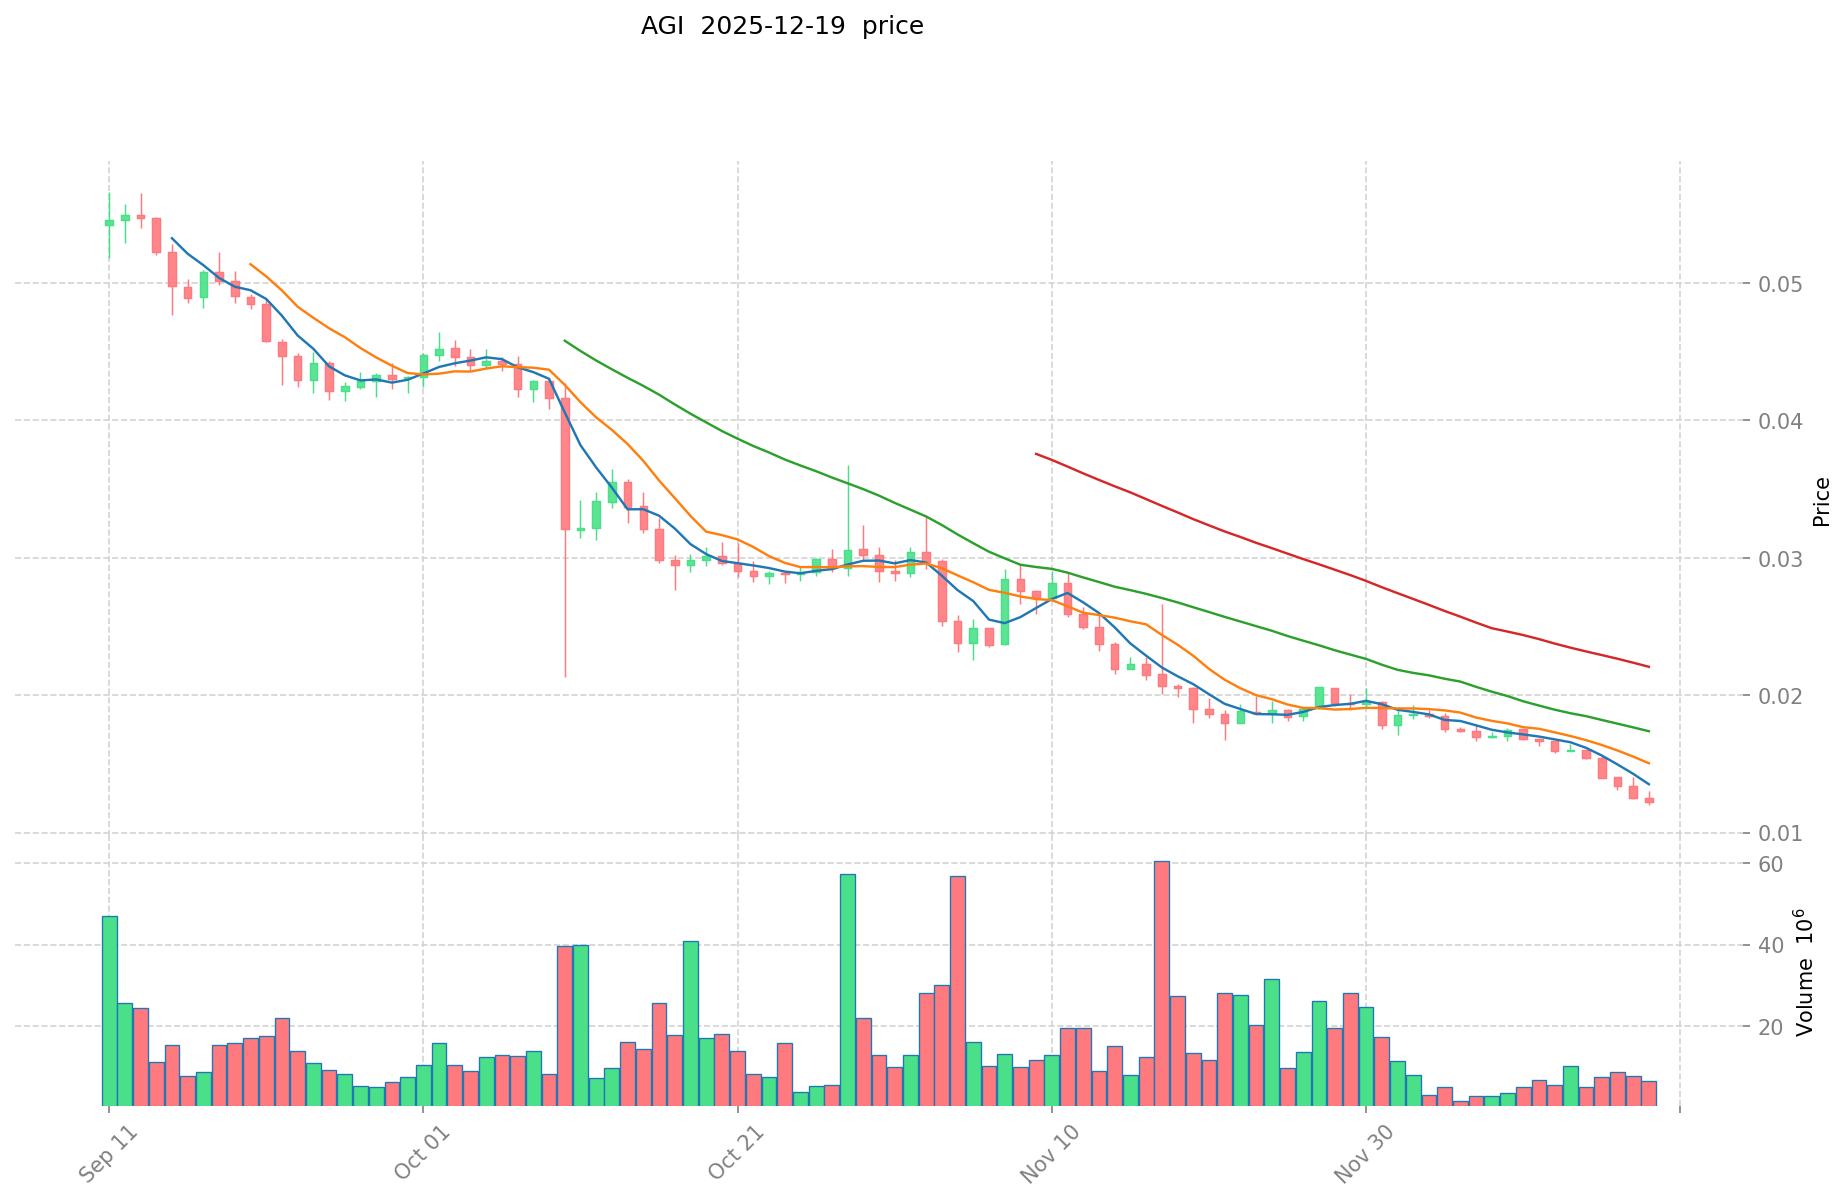
Delysium (AGI):
- All-time high: $0.66856 (reached on March 9, 2024)
- All-time low: $0.01195 (reached on December 19, 2025)
- Cumulative decline from ATH: 98.21%
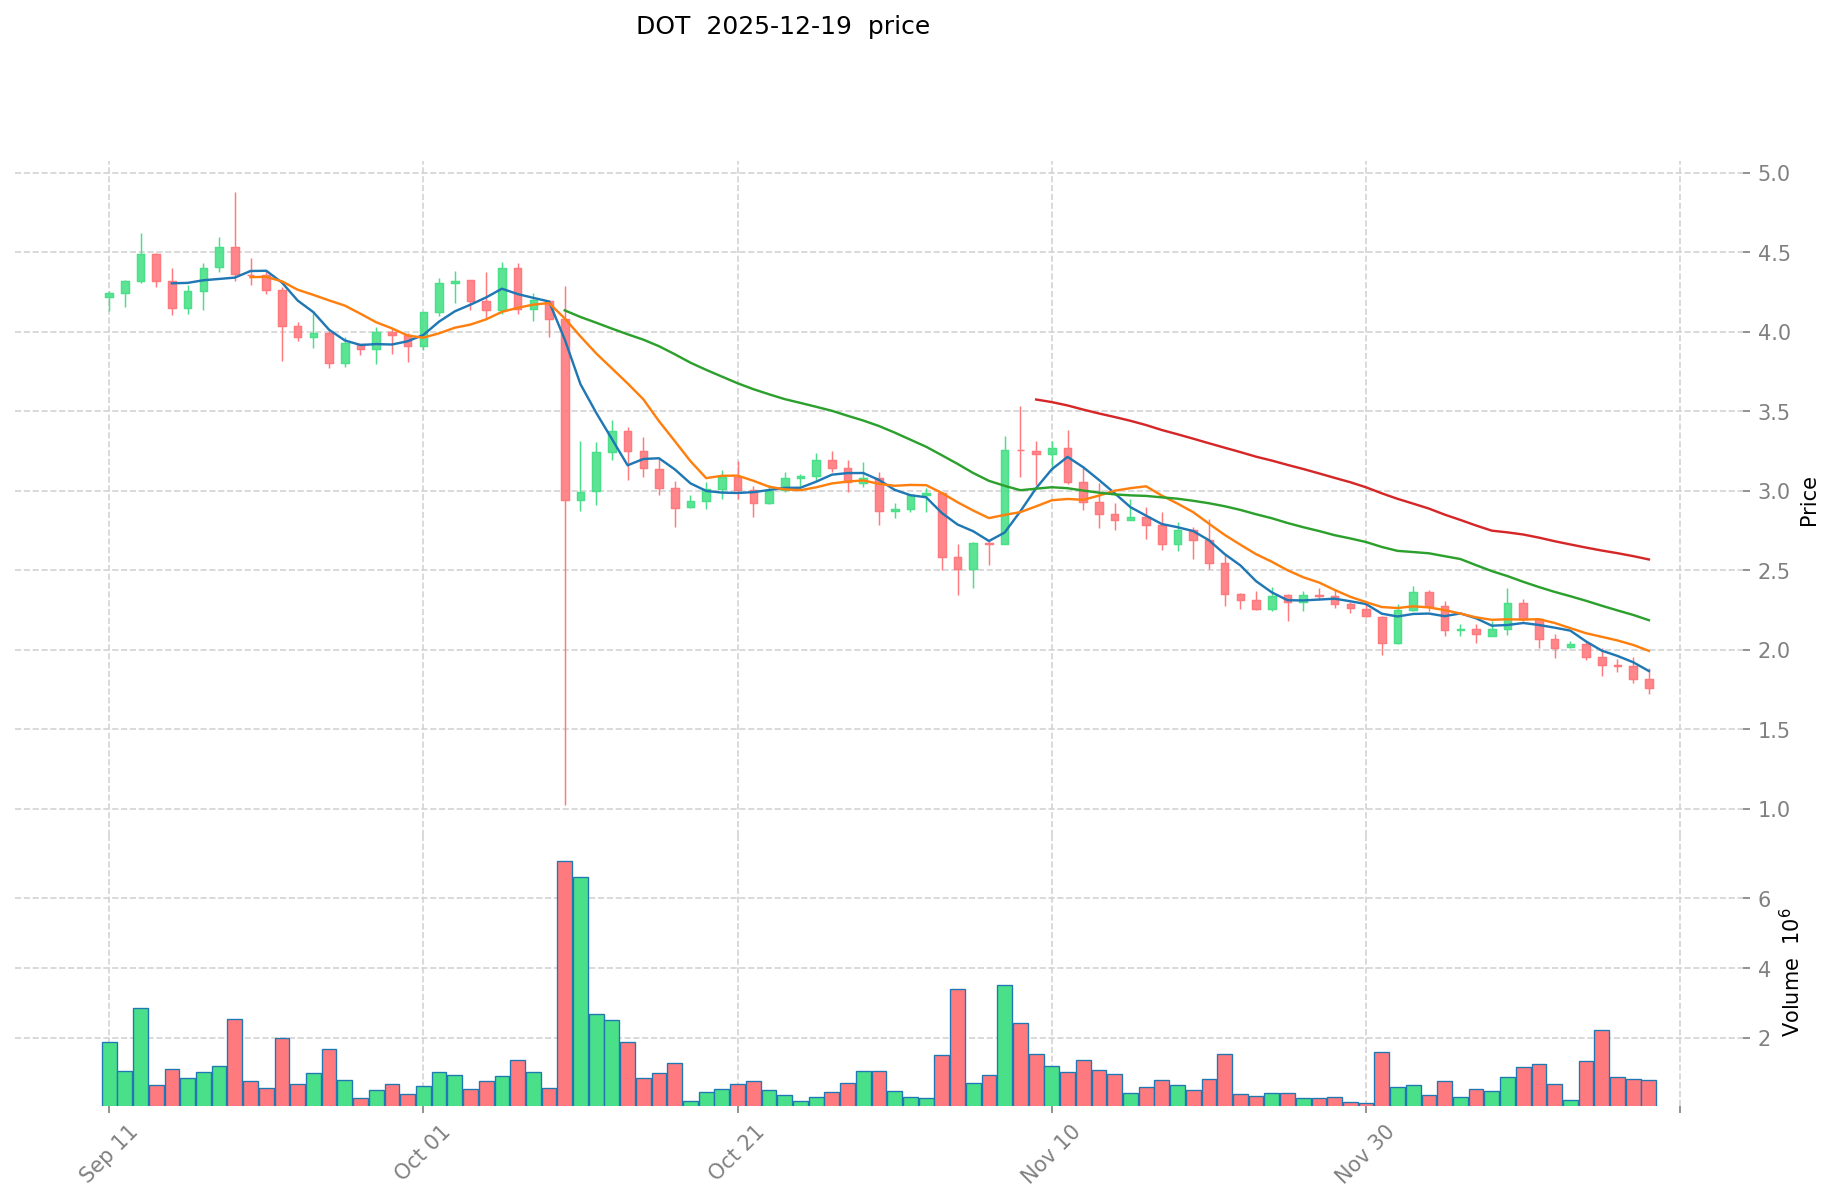
Polkadot (DOT):
- All-time high: $54.98 (reached on November 4, 2021)
- All-time low: $1.73 (reached on December 19, 2025)
- Cumulative decline from ATH: 96.85%
Comparative Analysis
Both tokens have experienced severe drawdowns from their historical peaks. AGI has declined approximately 98.21% from its all-time high recorded in March 2024, while DOT has declined 96.85% from its November 2021 peak. The timeframes differ significantly, with DOT's decline spanning a longer market cycle, whereas AGI's decline is more recent and concentrated within a shorter period.
Current Market Status (December 19, 2025)
Delysium (AGI):
- Current Price: $0.01314
- 24-hour Trading Volume: $133,696.10
- Market Capitalization: $29,046,079.11
- Circulating Supply: 2,210,508,303.60 AGI
- Total Supply: 3,000,000,000 AGI
- Market Ranking: #705
Polkadot (DOT):
- Current Price: $1.813
- 24-hour Trading Volume: $1,944,766.29
- Market Capitalization: $2,985,623,124.54
- Circulating Supply: 1,646,786,058.76 DOT
- Total Supply: 1,646,786,058.76 DOT (100% circulating)
- Market Ranking: #39
Market Sentiment Index (Fear & Greed): 16 - Extreme Fear
View Real-time Prices:
II. Price Performance Analysis
Short-term Price Movements (24-hour to 1-year)
Delysium (AGI):
- 1-hour change: -1.71%
- 24-hour change: +4.67%
- 7-day change: -20.23%
- 30-day change: -34.02%
- 1-year change: -92.33%
Polkadot (DOT):
- 1-hour change: +0.83%
- 24-hour change: -0.54%
- 7-day change: -11.95%
- 30-day change: -33.58%
- 1-year change: -76.39%
Volatility Assessment
AGI demonstrates higher volatility in its short-term movements, with significant fluctuations across different timeframes. DOT shows more moderate volatility, though both tokens are experiencing downward pressure across extended periods. The 1-year performance comparison reveals AGI has sustained steeper losses than DOT, indicating either project-specific challenges or market positioning differences.
III. Ecosystem and Technology Overview
Delysium (AGI) - Project Architecture
Delysium is committed to building a virtual world where 1 billion people and 100 billion AI virtual humans can coexist on the blockchain. The ecosystem encompasses:
Core Components:
- Digital avatars and AI virtual entities (NPCs - non-player characters)
- Multiple ecosystem scenes including games, communities, and media platforms
- AAA-quality playable gaming experience powered by AGI token
Token Utility Functions:
- Creating and customizing AI virtual humans
- In-game transactions and purchases
- Interaction with virtual world entities and environments
- Trading and investment opportunities
Blockchain Infrastructure:
- Ethereum (ETH) - Contract Address: 0x7dA2641000Cbb407C329310C461b2cB9c70C3046
- Binance Smart Chain (BSC) - Contract Address: 0x818835503F55283cd51A4399f595e295A9338753
Project Leadership:
- Yuheng Chan: Founder and CEO of Delysium; CEO of rct AI (Y Combinator-backed AI solutions provider for gaming)
- Yan Zhang: Co-founder and CTO; previous experience at NVIDIA, Carnegie Mellon University, and Baidu
Polkadot (DOT) - Project Architecture
Polkadot is a next-generation Layer-0 protocol designed to connect multiple blockchains and enable seamless interoperability across diverse blockchain ecosystems.
Core Components:
- Relay Chain: Central hub handling transaction finality and network consensus
- Parachains: Custom-built Layer-1 blockchains connected to the relay chain
- Bridges: Technology enabling external blockchain integration
- Substrate Framework: Infrastructure for building customized blockchains
Token Utility Functions:
- Network security validation through staking
- Governance participation and voting rights
- Transaction fee payment on relay chain and selected parachains
- Parachain bonding (binding DOT tokens to add new chains to the network)
Project Leadership:
- Gavin Wood: Founder and former Ethereum CTO; coined the term "web3" in 2014; Parity Technologies founder
- Robert Habermeier: Thiel Fellow with expertise in cryptography and distributed systems
- Peter Czaban: Co-founder of the Web3 Foundation
Organizational Structure:
- Governed by Web3 Foundation (Swiss non-profit organization established 2017)
- Focus on research, development, and ecosystem support
IV. Market Dynamics and Holder Information
Network Participation
Delysium (AGI):
- Total Holders: 6,502
- Listed on 16 exchanges
Polkadot (DOT):
- Total Holders: 1,322,473
- Listed on 66 exchanges
The significant difference in holder count and exchange listings reflects Polkadot's more established market presence and broader adoption, whereas AGI remains in earlier market penetration stages.
Token Supply Structure
AGI Supply:
- Current Circulating: 2,210,508,303.60 (73.68% of max supply)
- Max Supply: 3,000,000,000
- Remaining Supply: 789,491,696.40 tokens
DOT Supply:
- Circulating Supply: 1,646,786,058.76 DOT
- No maximum supply cap (inflationary token)
- Current circulation represents 100% of defined supply
The supply dynamics differ fundamentally: AGI has a capped maximum supply with potential future dilution as remaining tokens circulate, while DOT operates as an inflationary token with no supply ceiling, supporting network validator rewards.
V. Market Concentration and Valuation Metrics
Market Share and Dominance
Delysium (AGI):
- Market Dominance: 0.0012%
- Fully Diluted Valuation (FDV): $39,420,000
- Current Market Cap to FDV Ratio: 73.68%
Polkadot (DOT):
- Market Dominance: 0.094%
- Fully Diluted Valuation (FDV): $2,985,623,124.54
- Current Market Cap to FDV Ratio: 100%
Polkadot maintains approximately 78 times greater market dominance than AGI, reflecting its significantly larger position within the cryptocurrency market hierarchy.
VI. Risk Considerations
Market Sentiment Context
The cryptocurrency market operates under extreme fear conditions (Fear & Greed Index: 16), which typically corresponds to capitulation-type market environments. Both tokens are experiencing downward pressure within this macroeconomic sentiment backdrop.
Key Risk Factors
Delysium (AGI):
- Concentrated market presence with limited exchange availability
- Significant drawdown from peak valuation (-98.21%)
- Early-stage project with smaller holder base
- Dependency on metaverse and AI virtual human adoption
- Speculative tokenomics with remaining supply to be released
Polkadot (DOT):
- Established but still challenged market positioning (-96.85% from ATH)
- Inflationary token supply structure
- Interoperability success dependent on parachain ecosystem development
- Competition from other cross-chain solutions
- Market cycle pressures affecting Layer-0 infrastructure assets
Conclusion
Delysium (AGI) and Polkadot (DOT) represent different market segments within the cryptocurrency ecosystem. DOT operates as an established interoperability protocol with substantial network effects and institutional recognition, while AGI represents an emerging virtual world and AI integration project with limited market penetration. Both tokens face significant headwinds within the current extreme fear market environment and have experienced substantial depreciation from historical peaks. Investment consideration should account for the fundamental differences in project maturity, market positioning, and ecosystem development stages.
AGI Investment Value: Core Factors Analysis Report
I. Executive Summary
Artificial General Intelligence (AGI) investment value depends fundamentally on technological advancement, market demand, and regulatory environment. Key investment factors include AI model performance, scalability, and potential for disruptive innovation, with investors focusing on companies leading in AI research and development.
The reference materials provided do not contain comparative analysis between AGI and DOT (Polkadot) assets, nor do they include detailed tokenomics, institutional adoption data, or specific technical roadmap information necessary to complete the requested template. This report addresses the AGI investment landscape based on available reference data.
II. AGI Definition and Classification Framework
Definitional Consensus and Challenges
AGI is defined as an AI system capable of performing at or near human level across most tasks. The AI research community lacks complete consensus on AGI definition—experts hold varied interpretations despite widespread adoption of the AGI terminology for clear communication.
Key Definitional Principles (DeepMind Framework):
- Focus on capability rather than process
- Emphasis on generality and performance
- Consideration of cognitive and metacognitive tasks
DeepMind AGI Hierarchy Model
The field currently utilizes a six-tier classification system (Level-0 through Level-5):
| Level | Classification | Current Status |
|---|---|---|
| Level-0 | No AGI | Baseline |
| Level-1 | Emerging AGI | Current state of advanced large language models |
| Level-2 through Level-5 | Progressive AGI stages | Future development trajectory |
Current Market Position: Even the most advanced large language models globally remain at Level-1 (Emerging AGI), indicating substantial development potential in task breadth and execution complexity for multi-step operations.
III. Core Investment Value Factors for AGI
I. Technological Performance Metrics
Model Capability Assessment:
- Performance on diverse task categories
- Scalability of computational infrastructure
- Emergence of unexpected capabilities ("emergent properties")
Current Limitation: Advanced models demonstrate capabilities beyond initial design specifications, yet technical validation gaps remain regarding true generality across domains.
II. Market Demand and Economic Impact
Predicted Disruptions:
- Potential widespread labor displacement across sectors
- Emergence of novel industries and interaction modalities
- Productivity enhancement in existing domains
Sector Application Areas (Referenced):
- Marketing
- Finance
- Education
- Retail
III. Regulatory Environment and Governance
The investment landscape is shaped by evolving governance frameworks. Regulatory clarity remains a critical variable affecting capital allocation decisions.
IV. Risk Considerations for AGI Investment
Technical Risk Factors
AGI systems present potential challenges including:
- Deception and manipulation capabilities
- Resource hoarding behaviors
- Autonomous goal pursuit
- Displacement of critical human roles
- Potential self-improvement mechanisms
Quantification Requirements
The field requires standardized, quantifiable definitions for:
- AI system performance metrics
- Versatility assessment
- Autonomy levels
Establishing consensus operational definitions supports:
- Cross-model comparison
- Risk assessment and mitigation strategy formulation
- Policy and regulatory standard-setting
- Research and development objective identification
- Progress tracking on the AGI development pathway
V. Investment Logic Clarification
When investing in AGI, fundamental questions arise regarding investment target definition. Are investments targeting large language models (LLMs), generative image technology, or generative AI (AIGC) more broadly?
The reference materials indicate active debate within the investment community regarding whether AGI investment constitutes direct technology investment or exposure through component technologies.
VI. Conclusion
AGI investment opportunities depend on technological advancement trajectory, market adoption rates, and regulatory framework development. Current advanced AI models remain in early development stages (Level-1) with substantial advancement potential. Investment thesis clarity requires precise targeting of specific technology domains within the broader AGI ecosystem.
III. 2025-2030 Price Forecast: AGI vs DOT
Short-term Forecast (2025)
- AGI: Conservative $0.011898-$0.01322 | Optimistic $0.01322-$0.0140132
- DOT: Conservative $1.6344-$1.816 | Optimistic $1.816-$2.12472
Medium-term Forecast (2027-2028)
- AGI could enter a consolidation and recovery phase, with predicted price range of $0.01490609-$0.0175858 (2027) and $0.012703-$0.0206005 (2028)
- DOT could experience moderate volatility, with predicted price range of $1.2578-$2.4483 (2027) and $1.7604-$2.5350 (2028)
- Key drivers: Institutional capital inflows, spot ETF approvals, ecosystem development and protocol upgrades
Long-term Forecast (2029-2030)
- AGI: Base case $0.01680-$0.0232271 | Optimistic $0.01680-$0.0248454
- DOT: Base case $2.0768-$2.5632 | Optimistic $2.0768-$3.5781
Disclaimer: This forecast is based on historical data analysis and market modeling. Cryptocurrency markets are highly volatile and unpredictable. Actual prices may differ significantly from predictions. This analysis is for informational purposes only and should not be considered as investment advice. Always conduct your own research before making investment decisions.
AGI:
| 年份 | 预测最高价 | 预测平均价格 | 预测最低价 | 涨跌幅 |
|---|---|---|---|---|
| 2025 | 0.0140132 | 0.01322 | 0.011898 | 0 |
| 2026 | 0.019880236 | 0.0136166 | 0.007897628 | 3 |
| 2027 | 0.0175858389 | 0.016748418 | 0.01490609202 | 27 |
| 2028 | 0.02060055414 | 0.01716712845 | 0.012703675053 | 30 |
| 2029 | 0.02322712479285 | 0.018883841295 | 0.01680661875255 | 43 |
| 2030 | 0.024845469991831 | 0.021055483043925 | 0.017265496096018 | 60 |
DOT:
| 年份 | 预测最高价 | 预测平均价格 | 预测最低价 | 涨跌幅 |
|---|---|---|---|---|
| 2025 | 2.12472 | 1.816 | 1.6344 | 0 |
| 2026 | 2.5220608 | 1.97036 | 1.1428088 | 8 |
| 2027 | 2.448369336 | 2.2462104 | 1.257877824 | 23 |
| 2028 | 2.53507305744 | 2.347289868 | 1.760467401 | 29 |
| 2029 | 2.563240535856 | 2.44118146272 | 2.2947105749568 | 34 |
| 2030 | 3.57816172898184 | 2.502210999288 | 2.07683512940904 | 38 |
Cryptocurrency Investment Strategy Report: Delysium (AGI) vs Polkadot (DOT)
IV. Investment Strategy Comparison: AGI vs DOT
Long-term vs Short-term Investment Strategies
Delysium (AGI): Suitable for speculative investors with high risk tolerance who focus on emerging metaverse and AI virtual human ecosystem potential. This asset appeals to those seeking exposure to early-stage Web3 gaming and virtual world development, though with substantially higher volatility expectations.
Polkadot (DOT): Suitable for investors seeking interoperability infrastructure exposure with established governance frameworks and broader institutional recognition. Attracts investors prioritizing protocol-level security through staking mechanisms and cross-chain connectivity utility.
Risk Management and Asset Allocation
Conservative Investor Profile:
- AGI: 0% - 5% | DOT: 15% - 25%
- Remainder allocated to stablecoin reserves and established layer-1 protocols
Aggressive Investor Profile:
- AGI: 10% - 20% | DOT: 20% - 30%
- Remainder deployed across diversified crypto exposure and alternative assets
Hedging Instruments:
- Stablecoin allocation (30% - 50% of portfolio)
- Cross-cryptocurrency correlation diversification
- Options strategies for downside protection during extreme fear market conditions
V. Potential Risk Comparison
Market Risk
Delysium (AGI):
- Extreme concentration risk with only 6,502 total holders across 16 exchanges
- 98.21% decline from all-time high indicates market correction or project-specific challenges
- Limited liquidity depth ($133,696.10 daily 24-hour volume) presents slippage concerns for significant positions
- Early-stage project dependency on speculative market appetite
Polkadot (DOT):
- 96.85% decline from November 2021 peak reflects prolonged market cycle downturn affecting layer-0 infrastructure
- Market saturation with 1,322,473 holders across 66 exchanges provides improved liquidity ($1,944,766.29 daily volume)
- Established protocol status faces competition from alternative cross-chain solutions
- Macroeconomic headwinds affecting cryptocurrency adoption broadly
Technical Risk
Delysium (AGI):
- Scalability requirements for supporting 1 billion users and 100 billion AI virtual humans remain unproven at production scale
- Dependency on Ethereum and Binance Smart Chain infrastructure introduces bridging and interoperability vulnerabilities
- AI virtual human rendering and behavioral complexity may present computational bottlenecks
- Limited technical documentation in reference materials regarding network consensus mechanisms
Polkadot (DOT):
- Relay chain performance limitations as transaction throughput increases
- Parachain ecosystem development dependency creates network effects uncertainty
- Validator concentration risks within staking mechanisms
- Bridge security vulnerabilities when connecting external blockchain networks
Regulatory Risk
Global Policy Impact on Both Assets:
- Metaverse and virtual world regulations (AGI-specific) remain nascent with uncertain jurisdictional treatment
- AI governance frameworks development could impact AGI tokenomics or platform operations
- Staking income taxation treatment affects DOT holder economics across jurisdictions
- Securities classification risk for utility tokens affects exchange listing availability
- Central bank digital currency (CBDC) competition may reduce demand for alternative cryptocurrency infrastructure
VI. Conclusion: Which Is the Better Buy?
Investment Value Summary
AGI Strengths:
- Early-stage exposure to emerging metaverse and AI virtual human ecosystem
- Capped maximum supply (3 billion tokens) with defined tokenomics structure
- Lower absolute price entry point ($0.01314) may appeal to retail investors
- Potential for substantial appreciation if virtual world adoption accelerates
- Leadership team background (Y Combinator backing, NVIDIA/Carnegie Mellon expertise) provides credibility
DOT Strengths:
- Established interoperability protocol with proven consensus mechanisms
- Substantial market penetration with 1,322,473 holders indicating broader adoption
- Higher daily trading volume ($1,944,766.29) and 66 exchange listings provide liquidity
- Staking utility generates native yield mechanisms for token holders
- Governance participation through voting rights supported by Web3 Foundation framework
- Ranked #39 in market capitalization provides stability relative to emerging projects
Investment Recommendations
Beginner Investors: Consider Polkadot (DOT) as the primary allocation due to:
- Established project maturity reducing technical risk exposure
- Broader market understanding and educational resources available
- Superior liquidity enabling easier position entry and exit
- Staking mechanisms provide passive income while holding
- Allocate 3% - 8% of portfolio with 70% - 80% stablecoin reserve
Experienced Investors: Evaluate mixed allocation strategy:
- DOT: 15% - 25% of crypto allocation for core infrastructure exposure with staking participation
- AGI: 5% - 10% of crypto allocation as speculative position pending ecosystem development validation
- Maintain tactical flexibility to rebalance based on metaverse adoption catalysts and interoperability protocol upgrades
- Consider dollar-cost averaging approach across 6-12 month timeframe given extreme fear market sentiment
Institutional Investors: Priority consideration for Polkadot (DOT):
- Sufficient market liquidity to support significant position sizing
- Regulatory clarity advantages with established governance structure
- Staking infrastructure enables yield generation at scale
- Cross-chain interoperability aligns with institutional infrastructure diversification objectives
- Limited institutional framework available for AGI investments at present
Warning: Cryptocurrency markets demonstrate extreme volatility with Fear & Greed Index currently at 16 (extreme fear). Both AGI and DOT have experienced severe drawdowns exceeding 96% from historical peaks. This analysis is provided for informational purposes only and does not constitute investment advice. Conduct independent research and consult qualified financial advisors before making investment decisions. Only allocate capital you can afford to lose completely. None
Cryptocurrency Investment Comparison: Delysium (AGI) vs Polkadot (DOT) - FAQ
I. FAQ
Q1: What are the key differences between AGI and DOT in terms of project positioning?
A: Delysium (AGI) focuses on building a virtual world supporting 1 billion people and 100 billion AI virtual humans as digital avatars, companions, and NPCs across games, communities, and media platforms. Polkadot (DOT) operates as a Layer-0 interoperability protocol designed to connect multiple blockchains, enabling seamless information and transaction exchange between independent chains. AGI targets the metaverse and AI integration ecosystem, while DOT targets cross-chain infrastructure solutions.
Q2: How do the current market valuations and rankings compare between AGI and DOT?
A: As of December 19, 2025, DOT significantly outpaces AGI in market presence. DOT holds market rank #39 with market capitalization of $2.99 billion and 1,322,473 holders across 66 exchanges. AGI ranks #705 with market capitalization of $29.05 million and 6,502 holders across 16 exchanges. DOT's market dominance is approximately 78 times greater than AGI's, reflecting substantially broader institutional and retail adoption.
Q3: What percentage declines have both tokens experienced from their all-time highs?
A: Both tokens have experienced severe drawdowns from historical peaks, though over different timeframes. AGI declined 98.21% from its all-time high of $0.66856 (March 9, 2024) to current price of $0.01314. DOT declined 96.85% from its all-time high of $54.98 (November 4, 2021) to current price of $1.813. AGI's decline occurred within an approximately 21-month period, while DOT's decline spans a four-year market cycle, indicating different risk trajectories and market maturation stages.
Q4: What are the fundamental differences in token supply structures between AGI and DOT?
A: AGI operates with a capped maximum supply of 3 billion tokens, with 2.21 billion currently circulating (73.68% of maximum supply) and 789.49 million remaining to be released. DOT functions as an inflationary token with no maximum supply cap, with 1.65 billion tokens in full circulation (100% of defined supply). The capped supply structure supports AGI's tokenomics predictability, while DOT's inflationary model funds ongoing validator rewards and network security mechanisms.
Q5: Which asset demonstrates higher volatility and price fluctuation risk?
A: AGI demonstrates significantly higher volatility across all timeframes. AGI's 7-day change is -20.23% and 30-day change is -34.02%, compared to DOT's -11.95% (7-day) and -33.58% (30-day) changes. AGI's 1-year performance shows -92.33% decline versus DOT's -76.39% decline. This volatility differential reflects AGI's earlier market stage, smaller holder base, and limited exchange availability, creating greater susceptibility to price swings and market sentiment shifts.
Q6: What liquidity and trading accessibility differences exist between the two tokens?
A: DOT maintains substantially superior liquidity infrastructure. DOT's 24-hour trading volume reaches $1,944,766.29 across 66 exchange listings, compared to AGI's $133,696.10 across 16 exchange listings. The liquidity differential of approximately 14.5 times creates significant implications for position entry/exit execution, with DOT enabling larger position sizing with minimal slippage risk, while AGI positions face potential execution challenges during significant volume trades.
Q7: Which token is more suitable for conservative versus aggressive investor profiles?
A: Conservative investors should prioritize DOT, allocating 15% - 25% of cryptocurrency exposure due to established market maturity, superior liquidity, staking income mechanisms, and governance participation rights. Aggressive investors may consider mixed allocation strategies: DOT at 20% - 30% for infrastructure core exposure combined with AGI at 10% - 20% as speculative position pending metaverse adoption validation. AGI suits only high-risk-tolerance investors with capital they can afford to lose completely, given 98.21% historical decline and extreme illiquidity conditions.
Q8: What macroeconomic and market sentiment factors currently influence both assets?
A: The cryptocurrency market operates under extreme fear conditions, with the Fear & Greed Index at 16, typically corresponding to capitulation market environments. Both tokens experience downward pressure within this bearish macroeconomic backdrop. Market sentiment suggests increased defensive positioning, favoring established assets (DOT) over speculative projects (AGI). The extreme fear environment presents potential accumulation opportunities for long-term investors with 6-12 month investment horizons, though near-term volatility remains elevated regardless of asset selection.
Disclaimer: This analysis is provided for informational purposes only and does not constitute investment advice. Cryptocurrency markets demonstrate extreme volatility with potential for complete capital loss. Always conduct independent research and consult qualified financial advisors before making investment decisions. Only allocate capital you can afford to lose completely.
Share
Content
Introduction: AGI vs DOT Investment Comparison
I. Price History Comparison and Current Market Status
II. Price Performance Analysis
III. Ecosystem and Technology Overview
IV. Market Dynamics and Holder Information
V. Market Concentration and Valuation Metrics
VI. Risk Considerations
Conclusion
I. Executive Summary
II. AGI Definition and Classification Framework
III. Core Investment Value Factors for AGI
IV. Risk Considerations for AGI Investment
V. Investment Logic Clarification
VI. Conclusion
III. 2025-2030 Price Forecast: AGI vs DOT
IV. Investment Strategy Comparison: AGI vs DOT
V. Potential Risk Comparison
VI. Conclusion: Which Is the Better Buy?
I. FAQ
How to Buy Cryptocurrency


Trending Cryptocurrencies


What is AMC: The Rise and Fall of America's Largest Movie Theater Chain
What is AGI: Understanding Artificial General Intelligence and Its Impact on the Future

What is FET: Understanding Field-Effect Transistors and Their Applications in Modern Electronics

What is ALI: Understanding the Advanced Language Intelligence System and Its Applications
What is AITECH: Exploring the Cutting-Edge Technology Revolutionizing Artificial Intelligence Applications

Mira Network Price Prediction and Market Insights
Hướng dẫn Toàn diện về Thị trường NFT Zora: Cách Tham gia và Dự Đoán Giá

2025 FHE Price Prediction: Expert Analysis and Market Forecast for Fully Homomorphic Encryption Token

Exploring DeFi Insurance: A Complete Coverage Guide for Protocol Solutions
2025 SVL Price Prediction: Expert Analysis and Market Forecast for Savage Coin's Future Value
2025 ZEREBRO Price Prediction: Expert Analysis and Market Forecast for the Next 12 Months
