AAVE vs TRX: A Comparative Analysis of Two Leading DeFi Protocols
Introduction: AAVE vs TRX Investment Comparison
In the cryptocurrency market, the comparison between AAVE and TRX has always been an unavoidable topic for investors. The two not only have significant differences in market cap ranking, application scenarios, and price performance, but also represent different positioning in crypto assets.
AAVE (AAVE): Since its launch in 2020, it has gained market recognition for its decentralized lending protocol.
TRON (TRX): Introduced in 2017, it has been hailed as a decentralized entertainment content sharing platform and is one of the cryptocurrencies with the highest global trading volume and market capitalization.
This article will comprehensively analyze the investment value comparison between AAVE and TRX, focusing on historical price trends, supply mechanisms, institutional adoption, technological ecosystems, and future predictions, attempting to answer the question that investors care about most:
"Which is the better buy right now?"
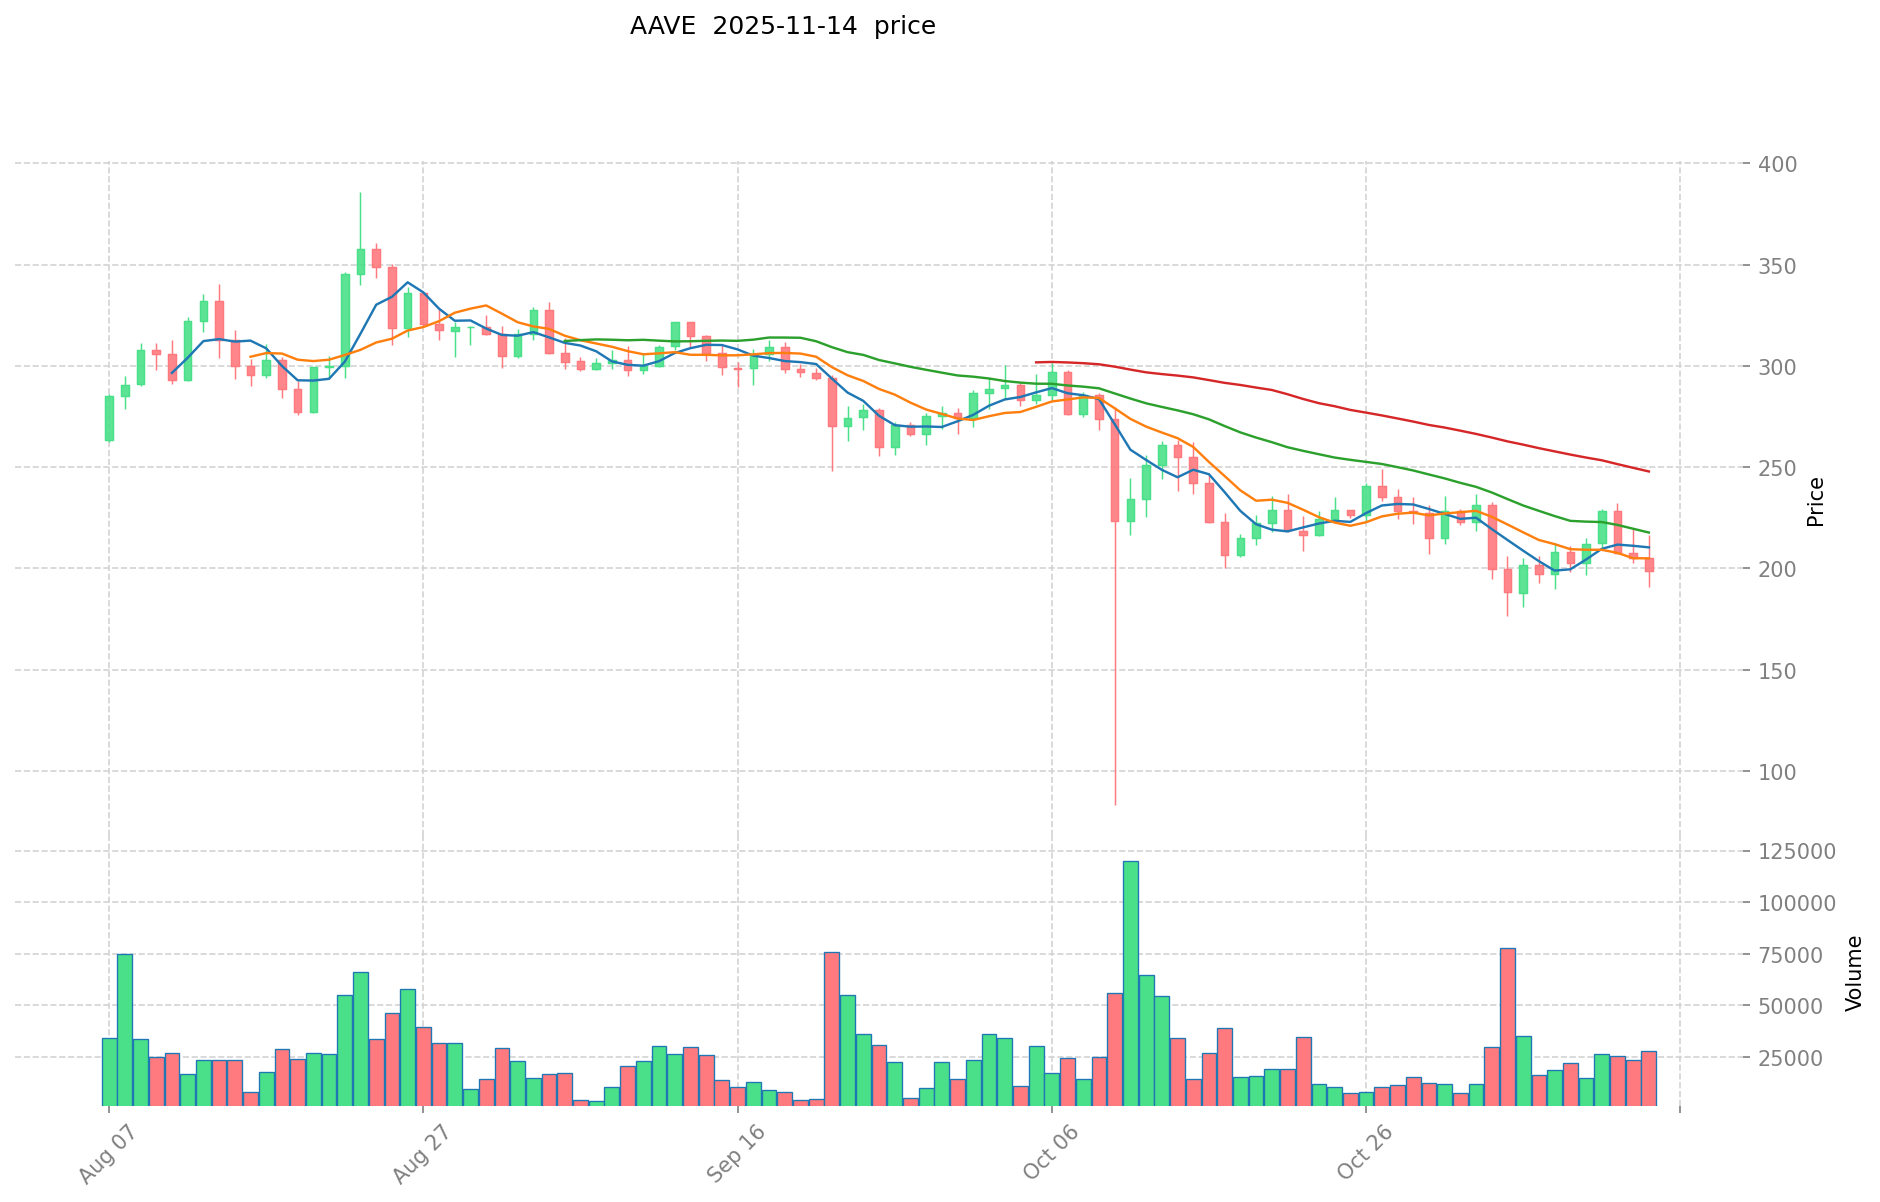
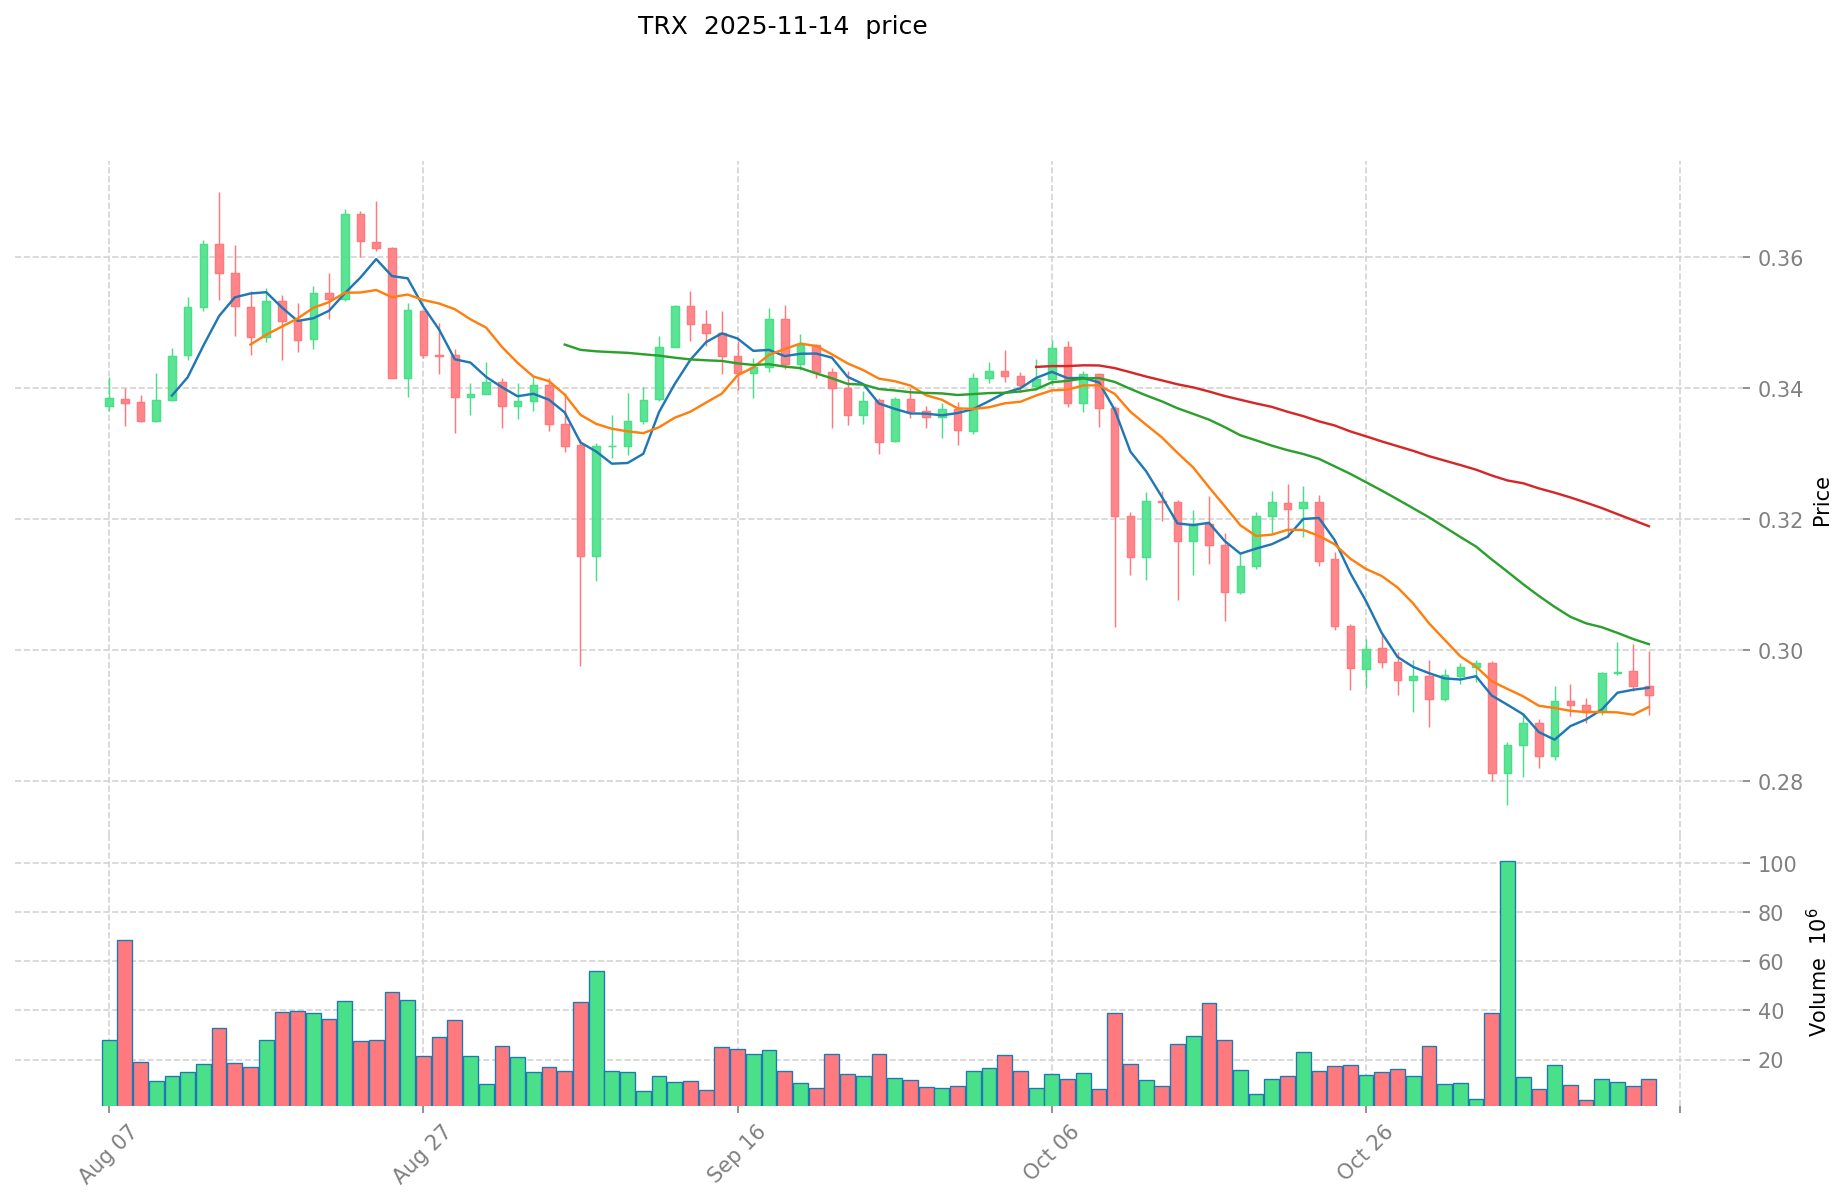
I. Price History Comparison and Current Market Status
AAVE and TRX Historical Price Trends
- 2020: AAVE launched through the improvement proposal (AIP1), converting LEND to AAVE at a 100:1 ratio.
- 2022: TRX announced the launch of decentralized ultra-collateralized stablecoin USDD, marking its entry into the decentralized stablecoin era.
- Comparative analysis: AAVE reached an all-time high of $661.69 on 2021-05-19 and an all-time low of $26.02 on 2020-11-05. TRX reached an all-time high of $0.431288 on 2024-12-04 and an all-time low of $0.00180434 on 2017-11-12.
Current Market Situation (2025-11-14)
- AAVE current price: $176.85
- TRX current price: $0.29182
- 24-hour trading volume: AAVE $8,615,293.06 vs TRX $10,712,409.70
- Market Sentiment Index (Fear & Greed Index): 16 (Extreme Fear)
Click to view real-time prices:
- View AAVE current price Market Price
- View TRX current price Market Price
II. Core Factors Affecting AAVE vs TRX Investment Value
Supply Mechanisms Comparison (Tokenomics)
-
AAVE: Fixed supply of 16 million tokens with deflationary mechanism through token burns from protocol fees
-
TRX: Inflationary model with approximately 101.7 billion total supply and annual inflation through block rewards
-
📌 Historical Pattern: AAVE's deflationary model has historically supported price stability during market downturns, while TRX's inflation rate has sometimes put downward pressure on price during extended bear markets.
Institutional Adoption and Market Applications
- Institutional Holdings: AAVE has attracted more institutional interest through its DeFi lending protocols and governance structure, particularly from crypto-focused funds
- Enterprise Adoption: AAVE leads in institutional DeFi lending applications, while TRX focuses more on consumer applications and entertainment industry partnerships
- Regulatory Attitudes: AAVE faces scrutiny as part of broader DeFi regulatory concerns, while TRX has encountered more significant regulatory challenges in certain jurisdictions due to its centralization concerns
Technical Development and Ecosystem Building
- AAVE Technical Upgrades: Implementation of V3 protocol with improved capital efficiency, isolation mode, and cross-chain functionality
- TRX Technical Development: Focus on high throughput and low fees through delegated proof-of-stake consensus mechanism
- Ecosystem Comparison: AAVE has deeper integration in the DeFi lending space across multiple blockchains, while TRX has stronger presence in entertainment and gaming applications with more centralized partnerships
Macroeconomic Factors and Market Cycles
- Performance in Inflationary Environments: AAVE has demonstrated better resilience during high inflation periods due to its deflationary tokenomics
- Macroeconomic Monetary Policy: Both tokens show sensitivity to interest rate changes, with AAVE typically more correlated to broader crypto market movements
- Geopolitical Factors: TRX has stronger presence in Asian markets, while AAVE has more balanced global distribution
III. 2025-2030 Price Prediction: AAVE vs TRX
Short-term Prediction (2025)
- AAVE: Conservative $121.233 - $175.7 | Optimistic $175.7 - $231.924
- TRX: Conservative $0.204246 - $0.29178 | Optimistic $0.29178 - $0.306369
Mid-term Prediction (2027)
- AAVE may enter a growth phase, with prices expected between $214.614036 - $293.3058492
- TRX may enter a growth phase, with prices expected between $0.2408147874 - $0.5400089172
- Key drivers: Institutional capital inflow, ETF, ecosystem development
Long-term Prediction (2030)
- AAVE: Base scenario $190.895977734462 - $312.9442257942 | Optimistic scenario $312.9442257942 - $328.59143708391
- TRX: Base scenario $0.566887970514897 - $0.62987552279433 | Optimistic scenario $0.62987552279433 - $0.724356851213479
Disclaimer: This analysis is based on historical data and projections. Cryptocurrency markets are highly volatile and unpredictable. This information should not be considered as financial advice. Always conduct your own research before making investment decisions.
AAVE:
| 年份 | 预测最高价 | 预测平均价格 | 预测最低价 | 涨跌幅 |
|---|---|---|---|---|
| 2025 | 231.924 | 175.7 | 121.233 | 0 |
| 2026 | 273.10808 | 203.812 | 163.0496 | 15 |
| 2027 | 293.3058492 | 238.46004 | 214.614036 | 34 |
| 2028 | 319.05953352 | 265.8829446 | 220.682844018 | 50 |
| 2029 | 333.4172125284 | 292.47123906 | 149.1603319206 | 65 |
| 2030 | 328.59143708391 | 312.9442257942 | 190.895977734462 | 76 |
TRX:
| 年份 | 预测最高价 | 预测平均价格 | 预测最低价 | 涨跌幅 |
|---|---|---|---|---|
| 2025 | 0.306369 | 0.29178 | 0.204246 | 0 |
| 2026 | 0.43066728 | 0.2990745 | 0.28113003 | 2 |
| 2027 | 0.5400089172 | 0.36487089 | 0.2408147874 | 25 |
| 2028 | 0.601745071788 | 0.4524399036 | 0.348378725772 | 55 |
| 2029 | 0.73265855789466 | 0.527092487694 | 0.45857046429378 | 80 |
| 2030 | 0.724356851213479 | 0.62987552279433 | 0.566887970514897 | 115 |
IV. Investment Strategy Comparison: AAVE vs TRX
Long-term vs Short-term Investment Strategies
- AAVE: Suitable for investors focused on DeFi lending and governance potential
- TRX: Suitable for investors interested in high-throughput blockchain and entertainment applications
Risk Management and Asset Allocation
- Conservative investors: AAVE: 60% vs TRX: 40%
- Aggressive investors: AAVE: 70% vs TRX: 30%
- Hedging tools: Stablecoin allocation, options, cross-currency combinations
V. Potential Risk Comparison
Market Risks
- AAVE: Vulnerability to DeFi market sentiment and regulatory changes
- TRX: Susceptibility to entertainment industry trends and centralization concerns
Technical Risks
- AAVE: Scalability, network stability
- TRX: Validator concentration, security vulnerabilities
Regulatory Risks
- Global regulatory policies may have differing impacts on both tokens, with AAVE potentially facing scrutiny in DeFi regulations and TRX encountering challenges due to centralization concerns
VI. Conclusion: Which Is the Better Buy?
📌 Investment Value Summary:
- AAVE advantages: Strong position in DeFi lending, deflationary tokenomics, institutional adoption
- TRX advantages: High transaction throughput, established entertainment partnerships, large user base
✅ Investment Advice:
- New investors: Consider a balanced approach with a slight preference for AAVE due to its established DeFi presence
- Experienced investors: Explore opportunities in both tokens based on individual risk tolerance and market analysis
- Institutional investors: AAVE may be more attractive due to its institutional-grade DeFi protocols and governance structure
⚠️ Risk Warning: The cryptocurrency market is highly volatile. This article does not constitute investment advice. None
VII. FAQ
Q1: What are the main differences between AAVE and TRX in terms of their tokenomics? A: AAVE has a fixed supply of 16 million tokens with a deflationary mechanism through token burns, while TRX has an inflationary model with approximately 101.7 billion total supply and annual inflation through block rewards.
Q2: Which token has shown better performance during inflationary environments? A: AAVE has demonstrated better resilience during high inflation periods due to its deflationary tokenomics.
Q3: How do AAVE and TRX differ in terms of institutional adoption? A: AAVE has attracted more institutional interest through its DeFi lending protocols and governance structure, particularly from crypto-focused funds. TRX, on the other hand, focuses more on consumer applications and entertainment industry partnerships.
Q4: What are the key technical developments for each token? A: AAVE has implemented V3 protocol with improved capital efficiency, isolation mode, and cross-chain functionality. TRX focuses on high throughput and low fees through a delegated proof-of-stake consensus mechanism.
Q5: How do the long-term price predictions for AAVE and TRX compare? A: For 2030, AAVE's base scenario predicts a range of $190.895977734462 - $312.9442257942, with an optimistic scenario of $312.9442257942 - $328.59143708391. TRX's base scenario for 2030 predicts a range of $0.566887970514897 - $0.62987552279433, with an optimistic scenario of $0.62987552279433 - $0.724356851213479.
Q6: What are the main risks associated with investing in AAVE and TRX? A: AAVE faces risks related to DeFi market sentiment, regulatory changes, scalability, and network stability. TRX is susceptible to entertainment industry trends, centralization concerns, validator concentration, and potential security vulnerabilities.
Q7: How might conservative and aggressive investors allocate their investments between AAVE and TRX? A: Conservative investors might consider allocating 60% to AAVE and 40% to TRX, while aggressive investors might allocate 70% to AAVE and 30% to TRX.
Share
Content
Introduction: AAVE vs TRX Investment Comparison
I. Price History Comparison and Current Market Status
II. Core Factors Affecting AAVE vs TRX Investment Value
III. 2025-2030 Price Prediction: AAVE vs TRX
IV. Investment Strategy Comparison: AAVE vs TRX
V. Potential Risk Comparison
VI. Conclusion: Which Is the Better Buy?
VII. FAQ

