2025 XEM Price Prediction: Expert Analysis and Market Outlook for NEM's Native Token

Introduction: Market Position and Investment Value of XEM
NEM (XEM), a digital asset management platform, has established itself as a foundational blockchain project since its inception in 2015. Over the past decade, NEM has developed into a comprehensive ecosystem supporting financial technology systems, logistics tracking, tokenization, notarization, and decentralized identity verification. As of December 2025, XEM has achieved a market capitalization of approximately $11.04 million USD with a circulating supply of 8.99 billion tokens, currently trading at around $0.0012 USD per token. This decentralized blockchain infrastructure continues to play an increasingly vital role in enabling instant payments and transfers across the globe, while supporting developers in building diverse applications on the NEM network.
This article provides a comprehensive analysis of XEM's price trends from 2025 through 2030, incorporating historical patterns, market supply-demand dynamics, ecosystem development, and macroeconomic factors. By synthesizing these key variables, this analysis delivers professional price forecasts and actionable investment strategies tailored for both novice and experienced investors seeking to understand XEM's market trajectory and investment potential in the coming years.
I. XEM Price History Review and Current Market Status
XEM Historical Price Trajectory
-
2015: NEM blockchain project was founded. XEM was launched as the native token of the NEM network with an initial price of $0.0004.
-
2018 January: XEM reached its all-time high (ATH) of $1.87, representing a significant appreciation from its launch price and marking the peak of the project's early market cycle.
-
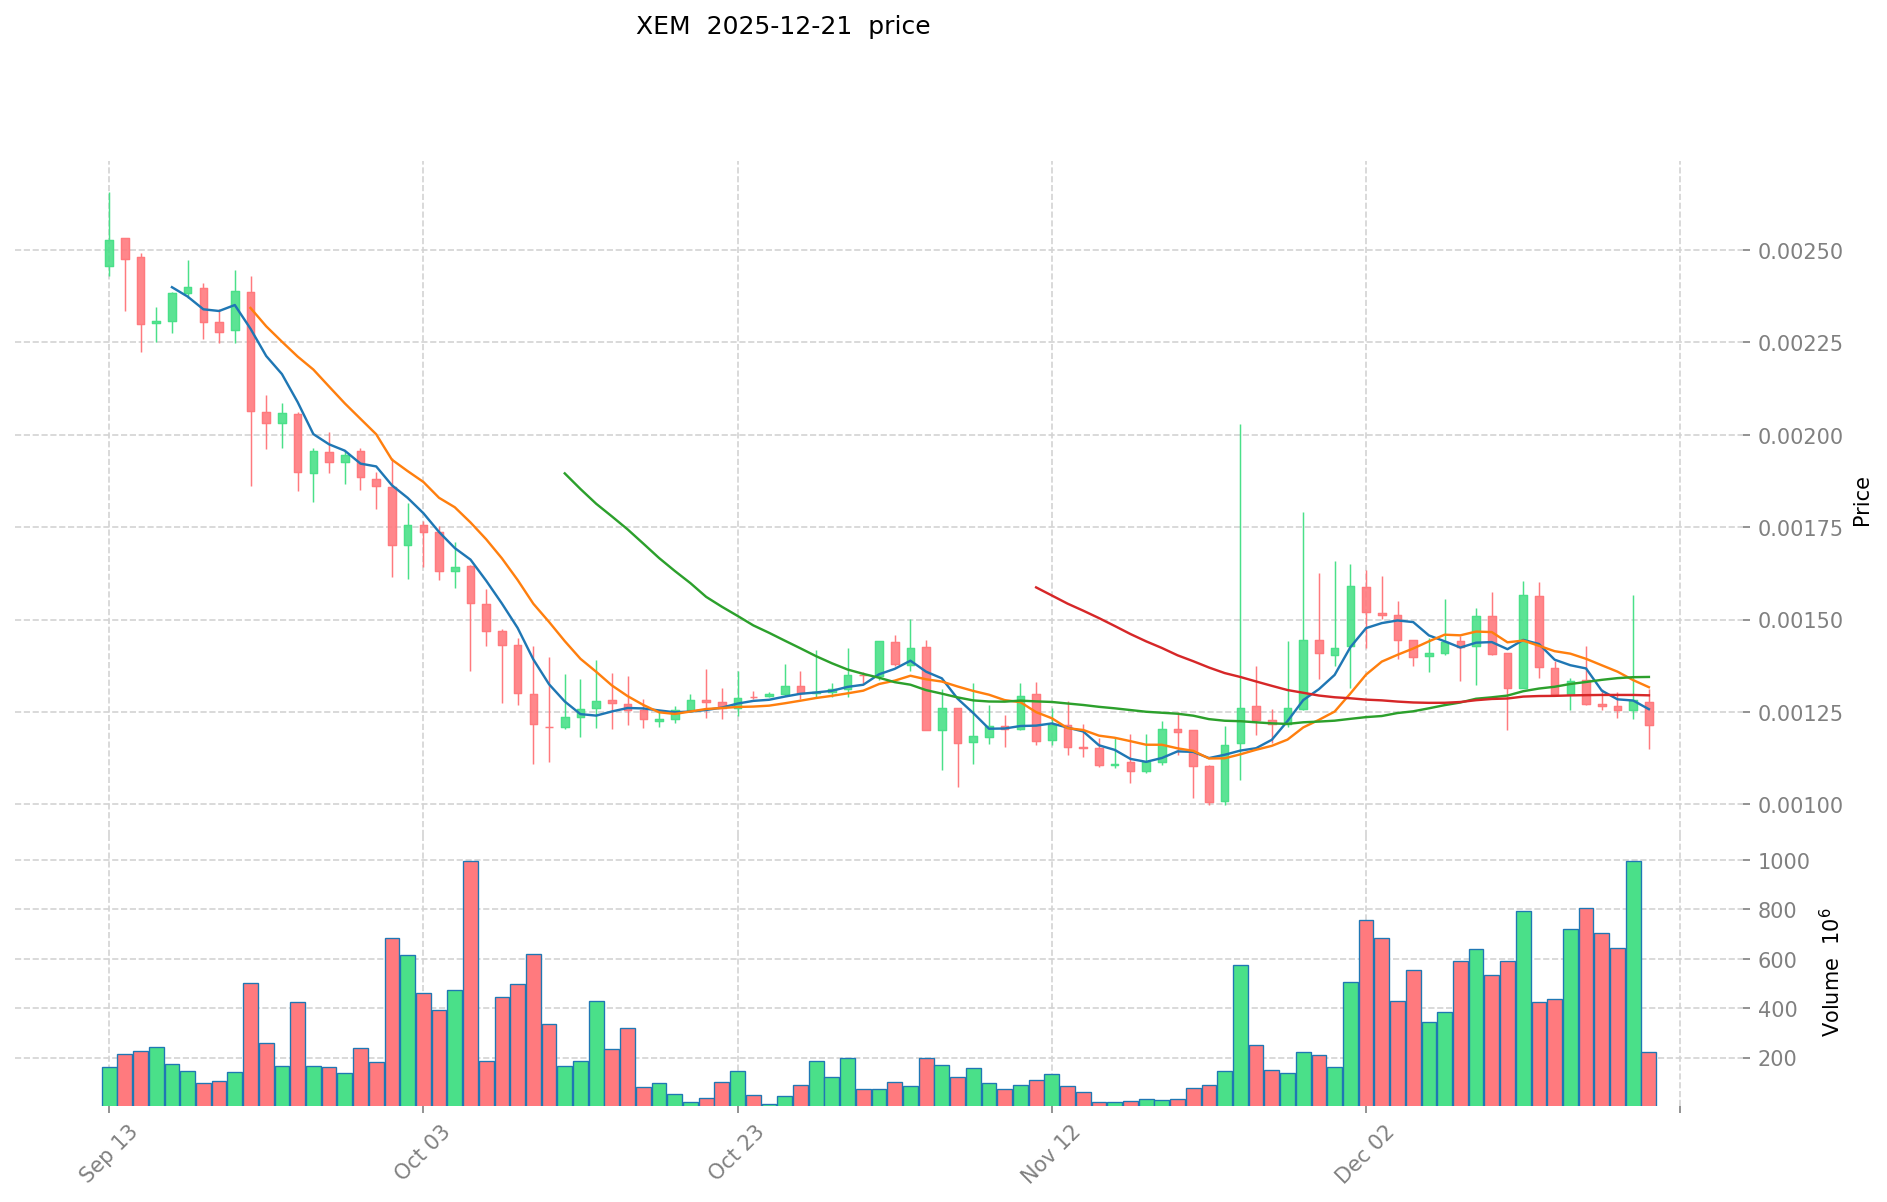
2025 December: XEM is currently trading at $0.0012263, reflecting a substantial decline of 95.11% over the past year from previous levels.
XEM Current Market Status
As of December 22, 2025, XEM is trading at $0.0012263 with a market capitalization of $11,036,699.99. The token is ranked #1123 by market cap with a market dominance of 0.00034%.
In the past 24 hours, XEM has shown positive momentum with a price increase of 3.88% (up $0.0000458). The hourly performance is also positive at +1.6%. However, the weekly performance shows weakness with a -8.77% decline over the past 7 days. On a longer-term basis, the 30-day performance is positive at +13.91%, while the annual performance remains severely negative at -95.11%, indicating substantial long-term value erosion.
The 24-hour trading volume stands at $501,660.49, with XEM trading between a low of $0.0011612 and a high of $0.001282. The circulating supply comprises the entire total supply of 8,999,999,999 XEM tokens, representing 100% circulation ratio.
Click to view current XEM market price
XEM Market Sentiment Index
2025-12-21 Fear and Greed Index: 20 (Extreme Fear)
Click to view current Fear & Greed Index
The crypto market is currently experiencing extreme fear with an index reading of 20. This exceptionally low sentiment indicates widespread panic among investors, suggesting potential capitulation. Such extreme fear often precedes significant market opportunities, as pessimism reaches unsustainable levels. Experienced traders frequently view these conditions as potential entry points. However, market volatility remains high during such periods. Consider your risk tolerance carefully and diversify your portfolio. Monitor major support levels and consider dollar-cost averaging strategies to navigate this challenging sentiment environment on Gate.com.

XEM Address Holdings Distribution
The address holdings distribution map illustrates the concentration of XEM tokens across the network's top holders, providing critical insights into the asset's decentralization level and potential market structure vulnerabilities. By analyzing the proportion of tokens held by the largest addresses relative to the total supply, this metric reveals whether ownership is dispersed across numerous participants or concentrated among a limited number of holders.
Current data demonstrates moderate concentration characteristics in XEM's holder structure. The top five addresses collectively control approximately 48.78% of circulating tokens, with the largest holder (NCHEST...SD6JAK) commanding 17.54% alone. While this concentration is noteworthy, the distribution does not indicate extreme centralization, as more than half of all tokens (51.22%) remain distributed among the broader holder base. However, the top address's significant stake warrants monitoring, as individual holders of this magnitude possess the capacity to influence short-term price dynamics and market sentiment.
The current distribution pattern suggests a moderately healthy ecosystem structure with reasonable decentralization, though not entirely fragmented. The substantial holdings by the top five addresses could introduce volatility risks during periods of large liquidations or portfolio rebalancing. Investors should note that while the majority stake remains distributed among smaller holders, the concentration among the top tier creates potential for coordinated market movements, though the absence of extreme monopolization indicates the network maintains sufficient resilience against unilateral manipulation. This balance reflects a maturing asset structure typical of established blockchain projects.
Click to view current XEM address holdings distribution
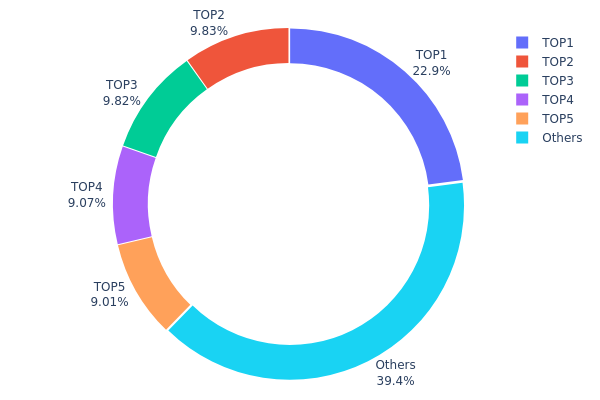
| Top | Address | Holding Qty | Holding (%) |
|---|---|---|---|
| 1 | NCHEST...SD6JAK | 1830610.95K | 17.54% |
| 2 | NA2P5F...PFEH3V | 785471.72K | 7.54% |
| 3 | NDEE6P...VBOJMP | 784588.95K | 8.45% |
| 4 | NANEPS...D4FGSV | 724395.34K | 6.96% |
| 5 | NAXB67...MJRER7 | 719684.59K | 8.29% |
| - | Others | 3144293.18K | 51.22% |
II. Core Factors Affecting XEM's Future Price
Macroeconomic Environment
-
Market Sentiment Impact: Market sentiment represents a major factor influencing XEM's price and market performance. Global economic conditions and fluctuations in market sentiment directly affect cryptocurrency valuations, with recent data showing XEM experienced a 0.22% decline over the past seven days, reflecting broader shifts in investor sentiment and potential market headwinds.
-
Regulatory Developments: Price movements may reflect broader macroeconomic trends or regulatory developments impacting the cryptocurrency market, which can cause significant volatility in XEM and similar digital assets.
Technical Development and Ecosystem Building
- Innovative Consensus Mechanism: NEM's Proof of Importance (PoI) algorithm and multifunctional platform provide differentiated value propositions in the cryptocurrency market. The PoI mechanism encourages network participation and represents a significant technical advancement compared to traditional proof-of-work or proof-of-stake systems.
III. 2025-2030 XEM Price Forecast
2025 Outlook
- Conservative Forecast: $0.00097-$0.00123
- Neutral Forecast: $0.00123
- Bullish Forecast: $0.00164 (requires sustained market momentum and positive ecosystem developments)
2026-2027 Mid-term Outlook
- Market Phase Expectations: Gradual accumulation phase with incremental growth trajectory, characterized by stabilization and modest appreciation potential
- Price Range Predictions:
- 2026: $0.00112-$0.00159 (16% upside potential)
- 2027: $0.00123-$0.00169 (23% upside potential)
- Key Catalysts: Enhanced blockchain utility adoption, ecosystem expansion initiatives, and favorable market sentiment cycles
2028-2030 Long-term Outlook
- Base Case Scenario: $0.00130-$0.00237 (assumes steady development progress and moderate market expansion)
- Bullish Scenario: $0.00206-$0.00280 (assumes accelerated adoption rates and strengthened network fundamentals by 2029)
- Transformational Scenario: $0.00280-$0.00343 (assumes breakthrough technological implementations and mainstream institutional participation by 2030)
- 2030-12-22: XEM $0.00343 (representing 95% cumulative gains from baseline projections through the forecast period)
| 年份 | 预测最高价 | 预测平均价格 | 预测最低价 | 涨跌幅 |
|---|---|---|---|---|
| 2025 | 0.00164 | 0.00123 | 0.00097 | 0 |
| 2026 | 0.00159 | 0.00143 | 0.00112 | 16 |
| 2027 | 0.00169 | 0.00151 | 0.00123 | 23 |
| 2028 | 0.00237 | 0.0016 | 0.0013 | 30 |
| 2029 | 0.0028 | 0.00199 | 0.00189 | 62 |
| 2030 | 0.00343 | 0.0024 | 0.00206 | 95 |
NEM (XEM) Professional Investment Report
IV. XEM Professional Investment Strategy and Risk Management
XEM Investment Methodology
(1) Long-term Holding Strategy
- Suitable for investors: Those with medium to long-term investment horizons seeking exposure to blockchain-based digital asset management platforms
- Operational recommendations:
- Establish a core position during market consolidation phases and maintain through market cycles
- Dollar-cost averaging (DCA) approach to reduce entry price volatility and timing risk
- Store holdings securely through Gate.com's custodial services for institutional-grade protection
(2) Active Trading Strategy
- Technical analysis tools:
- Relative Strength Index (RSI): Monitor overbought (>70) and oversold (<30) conditions for entry/exit signals
- Moving Average Convergence Divergence (MACD): Identify momentum shifts and trend reversals across multiple timeframes
- Wave operation key points:
- Identify support levels around historical consolidation zones for entry opportunities
- Set profit targets at technical resistance levels and establish stop-losses 5-8% below entry points
XEM Risk Management Framework
(1) Asset Allocation Principles
- Conservative investors: 1-3% of total portfolio allocation
- Active investors: 3-7% of total portfolio allocation
- Professional investors: 5-10% of total portfolio allocation
(2) Risk Hedging Solutions
- Portfolio diversification: Combine XEM holdings with established cryptocurrency assets and traditional investments to reduce concentration risk
- Volatility management: Use tranche-based purchasing strategies to mitigate impact of significant price fluctuations
(3) Secure Storage Solutions
- Hot wallet approach: Gate.com Web3 Wallet for frequent trading and liquidity requirements
- Cold storage strategy: Utilize offline hardware solutions for long-term holdings exceeding 90 days
- Security considerations: Enable two-factor authentication, use complex passwords, regularly backup private keys, and never share sensitive information
V. XEM Potential Risks and Challenges
XEM Market Risks
- Price volatility: XEM has experienced significant historical price swings, including a 95.11% decline over the past year, presenting substantial downside risk
- Liquidity constraints: Limited daily trading volume of approximately $501,660 may result in wider bid-ask spreads and slippage on larger trades
- Market sentiment sensitivity: As a lower-ranked asset by market capitalization, XEM is highly susceptible to broader cryptocurrency market sentiment shifts
XEM Regulatory Risks
- Evolving regulatory landscape: Global regulatory frameworks for digital assets remain in flux, creating uncertainty around XEM's legal status in different jurisdictions
- Compliance requirements: Future regulatory changes could impose operational constraints or compliance costs on NEM ecosystem participants
- Institutional adoption barriers: Regulatory hesitation may limit institutional capital inflows and mainstream adoption potential
XEM Technical Risks
- Network adoption challenges: Competition from more established blockchain platforms with stronger developer ecosystems and network effects
- Protocol obsolescence: Technological advancements in competing platforms could render NEM's current architecture less competitive
- Development velocity: Maintaining pace with rapid innovation in the blockchain space requires sustained technical development and community engagement
VI. Conclusion and Action Recommendations
XEM Investment Value Assessment
XEM represents a digital asset within the blockchain ecosystem that serves specific use cases in the NEM network's financial technology, logistics, and identity verification applications. However, the token's market position reflects significant challenges, with a 95.11% one-year price decline and relatively low market capitalization ranking (1,123rd). Investors should recognize that XEM carries elevated risk characteristics typical of smaller-cap cryptocurrency assets. The investment case depends on the NEM project's ability to execute technological upgrades, expand developer adoption, and demonstrate real-world utility in its target applications.
XEM Investment Recommendations
✅ Beginners: Start with minimal position sizing (0.5-1% of portfolio) through dollar-cost averaging on Gate.com, prioritizing education on NEM's use cases and blockchain fundamentals before expanding exposure
✅ Experienced investors: Employ tactical entry strategies during identified technical support levels, maintain disciplined stop-loss protocols, and consider XEM as a small speculative allocation rather than a core holding
✅ Institutional investors: Conduct comprehensive due diligence on NEM ecosystem development metrics, evaluate tokenomics against competing platforms, and consider exposure through diversified digital asset portfolios only after detailed fundamental analysis
XEM Trading Participation Methods
- Spot trading on Gate.com: Direct purchase and sale of XEM at market prices with immediate settlement
- Limit order strategies: Place conditional buy orders at predetermined price levels to optimize entry points
- Portfolio tracking: Monitor XEM holdings through Gate.com's analytics dashboard to assess allocation performance
Cryptocurrency investment carries extreme risk. This report does not constitute investment advice. Investors should make decisions based on their individual risk tolerance and financial situation. Consult with qualified financial advisors before investing. Never invest more than you can afford to lose.
FAQ
Does XEM have a future?
Yes, XEM has a promising future. With growing adoption, technological improvements, and increasing market interest in NEM's ecosystem, XEM is positioned for potential growth. Long-term prospects remain strong as the blockchain sector expands and XEM's utility strengthens.
What is the XEM coin about?
XEM is a cryptocurrency built on the Solana blockchain, designed for fast and low-cost transactions in Web3 applications. It is associated with the NEM network and enables efficient decentralized operations.
What factors influence XEM price movements?
XEM price movements are influenced by market sentiment, regulatory developments, cryptocurrency market trends, trading volume, and network adoption. Bitcoin's price direction also significantly impacts XEM as an altcoin.
How has XEM performed compared to other cryptocurrencies?
XEM has maintained steady market presence with moderate volatility. While smaller than major cryptocurrencies, it demonstrates consistent utility in its niche sector. Performance remains competitive within mid-tier tokens, with periodic fluctuations reflecting broader market trends.
What are the risks of investing in XEM?
XEM investment carries risks including high market volatility, potential price swings, and cryptocurrency market uncertainty. These factors may result in significant financial losses for investors.
Share
Content
Introduction: Market Position and Investment Value of XEM
I. XEM Price History Review and Current Market Status
II. Core Factors Affecting XEM's Future Price
III. 2025-2030 XEM Price Forecast
IV. XEM Professional Investment Strategy and Risk Management
V. XEM Potential Risks and Challenges
VI. Conclusion and Action Recommendations
FAQ
How to Buy Cryptocurrency


Trending Cryptocurrencies


Crypto Crash or Just a Correction?

Pi to PHP: Current Exchange Rate and Conversion Guide (2025)

2025 KSM Price Prediction: Analyzing Market Trends and Future Growth Potential of Kusama Network

2025 DCR Price Prediction: Analyzing Decred's Future Potential Amid Evolving Market Dynamics

EXT Price Meaning: What It Is and How to Understand It

2025 MAG7SSI Price Prediction: Analyzing Market Trends and Future Valuation Prospects for Magnificent Seven Semiconductor Index

Understanding Ye Coin: A Guide to Investment and Blockchain Insights

Understanding HEHE Coin: A Detailed Overview of HEHE Token and its Role in Web3
Global Leaders in Bitcoin Usage: Top 10 Countries

Ultimate Guide to Safeguarding Your Web3 Assets with a Multi-Chain Wallet

The Ultimate Guide to Understanding PeiPei Coin in the Web3 Ecosystem