2025 IN Price Prediction: Expert Analysis and Market Forecast for the Upcoming Year


Introduction: IN's Market Position and Investment Value
INFINIT (IN) is an AI-powered DeFi intelligence protocol that enables anyone to discover, evaluate, and execute DeFi opportunities through intelligent agents and natural language interfaces. As a transformative asset in the decentralized finance ecosystem, IN has quickly established itself as a key player in democratizing DeFi access. As of December 2025, IN boasts a market capitalization of approximately $79.6 million, with a circulating supply of 228.33 million tokens, currently trading at $0.0796. This innovative protocol, recognized for its "Agentic DeFi Economy" infrastructure, is playing an increasingly vital role in simplifying complex DeFi strategies for mainstream users.
The project has garnered substantial backing from leading investment institutions including Electric Capital, Mirana Ventures, Hashed, and Lightspeed Faction, validating its technological innovation and market potential.
This article provides a comprehensive analysis of IN's price dynamics and market trends as of December 21, 2025. By examining historical price patterns, market supply and demand dynamics, ecosystem development, and broader macroeconomic factors, this guide aims to equip investors with professional price forecasts and actionable investment strategies for informed decision-making in the evolving DeFi landscape.
I. IN Price History Review and Current Market Status
IN Historical Price Movement Trajectory
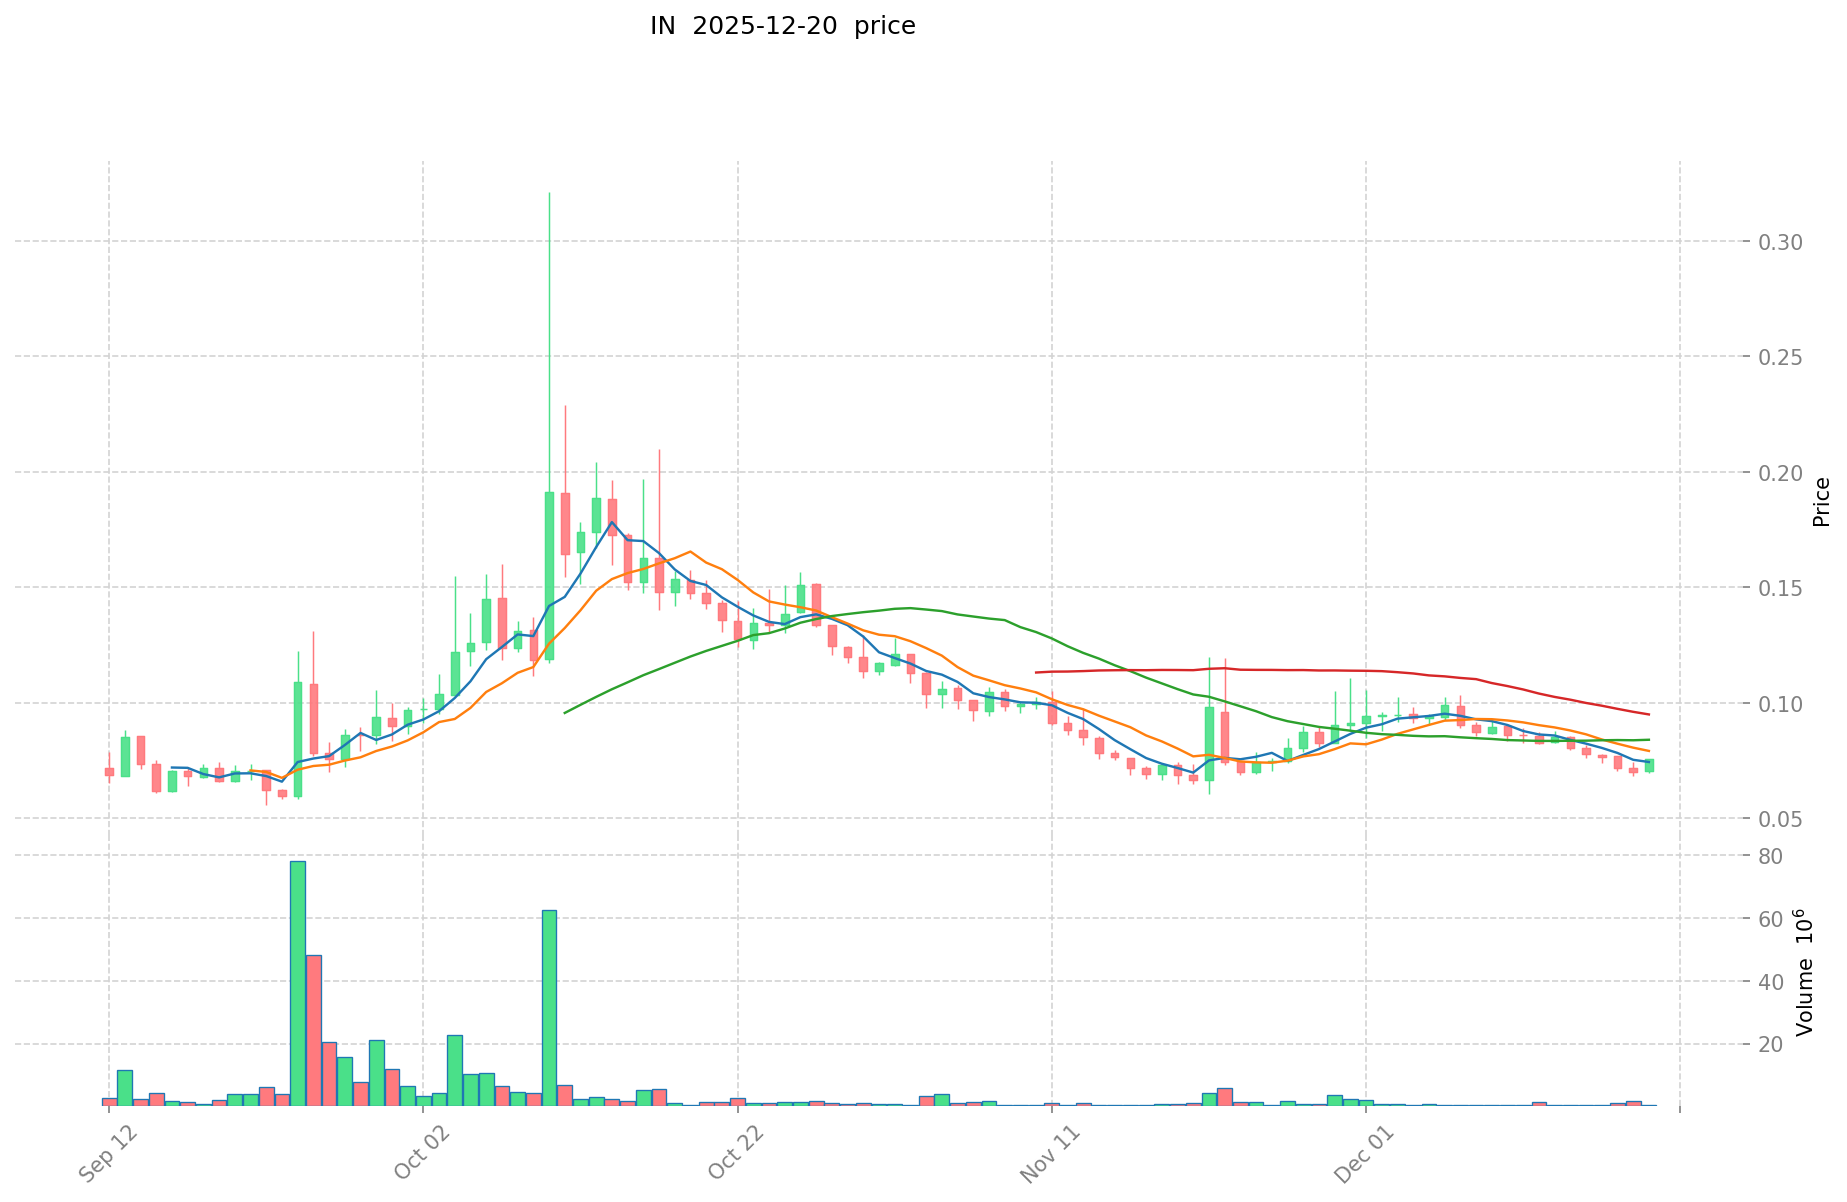
Based on available data, INFINIT (IN) demonstrated significant price volatility since its public listing on December 4, 2025:
- October 10, 2025: All-Time High (ATH) of $0.32118 was reached, marking the peak of investor enthusiasm during the early trading period.
- September 5, 2025: All-Time Low (ATL) of $0.05379 was recorded, representing the lowest valuation point in the token's trading history.
- December 21, 2025: Current trading price stands at $0.0796, reflecting a consolidation phase after recent market movements.
IN Current Market Status
As of December 21, 2025, INFINIT is trading at $0.0796 with a 24-hour trading volume of $56,062.07. The token has experienced a notable 9.96% gain over the past 24 hours, rebounding from the $0.07209 daily low to test higher levels. However, the 7-day performance shows a -6.17% decline, while the 30-day perspective remains positive with a +13.19% gain, indicating a recovery trend from mid-November levels.
The total market capitalization stands at $79.6 million with a fully diluted valuation (FDV), based on a total supply of 1 billion tokens. Currently, 228.33 million IN tokens are in circulation, representing 22.83% of the total supply. The token maintains a market dominance of 0.0024%, ranking 910th among all digital assets, with 623 token holders demonstrating early-stage adoption.
From a technical perspective, the 1-hour timeframe shows a slight -0.43% pullback, suggesting some consolidation within the current trading session. Market sentiment indicators reflect extreme fear conditions (VIX reading: 20), which often precedes buying opportunities in contrarian trading strategies.
Click to view current IN market price
IN Market Sentiment Index
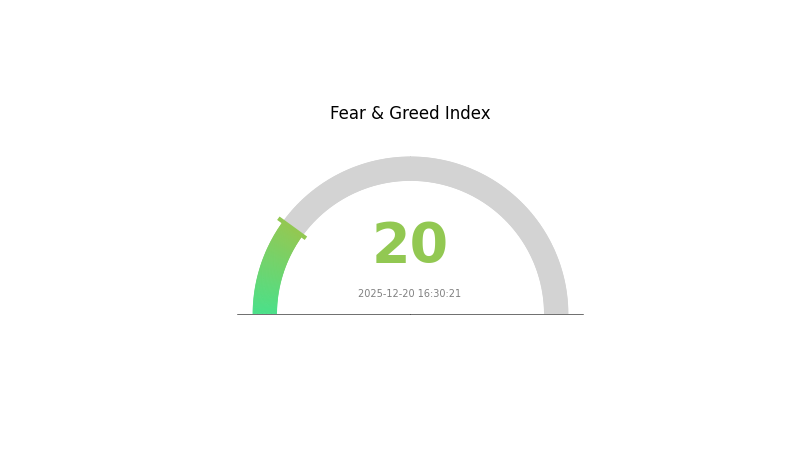
2025-12-20 Fear and Greed Index: 20 (Extreme Fear)
Click to view the current Fear & Greed Index
The crypto market is experiencing extreme fear with an index reading of 20. This level indicates intense market pessimism and heightened risk aversion among investors. During such periods, assets are typically undervalued, creating potential buying opportunities for contrarian traders. However, extreme fear also signals elevated volatility and downside risk. It's advisable to maintain cautious positioning while monitoring market developments closely on Gate.com for real-time data and analysis.
IN Holding Distribution
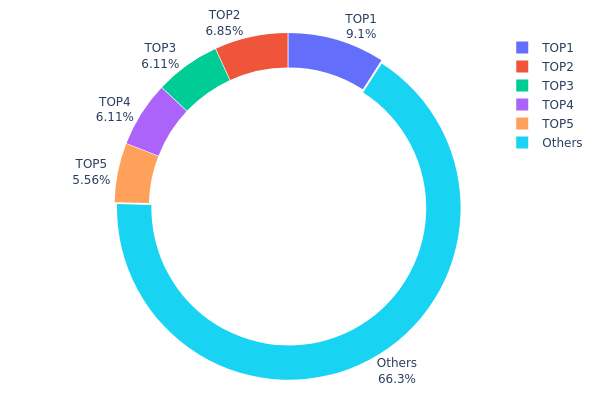
The address holding distribution chart reveals the concentration of token ownership across the network by tracking the top holders and their respective percentages of total supply. This metric serves as a critical indicator for assessing network decentralization, identifying potential concentration risks, and understanding the structural stability of the asset's holder base.
Current analysis of IN's top five addresses demonstrates moderate concentration characteristics. The largest holder controls 9.09% of the circulating supply, while the top two addresses combined represent 15.94% of total holdings. The top five addresses collectively account for 33.71% of IN tokens, with the remaining 66.29% distributed among other holders. This distribution pattern suggests that while significant holdings are concentrated among a limited number of addresses, the majority of the token supply remains relatively dispersed, indicating a degree of decentralization at the broader holder level.
From a market structure perspective, this concentration profile presents a balanced risk profile. The absence of any single address exceeding 10% of total supply mitigates extreme concentration risk, though the top five holders retain sufficient capital to potentially influence price movements during periods of low liquidity. The substantial proportion of tokens held by dispersed addresses (66.29%) strengthens network resilience and reduces susceptibility to coordinated manipulation. The current distribution reflects a maturing market structure where institutional and significant individual holders coexist with a diverse retail base, supporting both stability and potential volatility depending on aggregate holder behavior.
Click to view current IN Holding Distribution
| Top | Address | Holding Qty | Holding (%) |
|---|---|---|---|
| 1 | 0xab0a...486fce | 81837.56K | 9.09% |
| 2 | 0xbe83...daea8a | 61678.46K | 6.85% |
| 3 | 0x6e64...f15f40 | 55000.00K | 6.11% |
| 4 | 0xaa2d...f0899a | 55000.00K | 6.11% |
| 5 | 0x69ad...0d8897 | 50000.00K | 5.55% |
| - | Others | 596256.19K | 66.29% |
Core Factors Affecting IN Future Price Movement
Macroeconomic Environment
Monetary Policy Impact
-
Federal Reserve Rate Policy: The Federal Reserve's interest rate decisions serve as a core variable influencing commodity price trends. Market participants are closely monitoring the Fed's policy direction to accurately capture price movements in commodity markets. Traders anticipated a near 90% probability of Fed rate cuts in October and approximately 65% probability in December.
-
Global Liquidity Conditions: Overall market liquidity levels, reflected in interest rate benchmarks, significantly impact asset prices. Lower interest rates increase asset valuations, while higher rates compress them. Abundant liquidity typically drives broad-based asset appreciation across multiple classes.
Inflation Hedge Characteristics
- Inflationary Environment Performance: During periods of persistent inflation, certain assets demonstrate protective qualities. The ability to hedge against inflation becomes increasingly important as central banks navigate price stability challenges and economic uncertainty.
Geopolitical Factors
-
International Political Risk: Geopolitical tensions and international conflicts directly influence commodity prices through their effects on supply chains, trade flows, and risk sentiment. Market participants adjust positioning based on escalating or de-escalating geopolitical situations.
-
International Trade Dynamics: Exchange rate fluctuations, cross-border trade patterns, and international market price movements transmit through global supply chains, affecting domestic commodity valuations and price expectations.
Supply and Demand Dynamics
Core Supply-Demand Relationship
-
Market Equilibrium: The fundamental relationship between supply and demand determines price direction. When supply exceeds demand, prices tend to decline; when demand exceeds supply, prices typically rise. Balanced supply-demand relationships produce trading ranges and consolidation patterns.
-
Supply Chain Disruptions: Any interruptions in production capacity, inventory levels, or distribution networks directly impact price formation. Supply constraints combined with sustained demand create upward price pressure.
-
Demand Evolution: Changes in consumption patterns, export volumes, and industrial usage directly influence pricing dynamics. Growing or contracting demand signals future price trajectories.
Three、2025-2030 IN Price Forecast
2025 Outlook
- Conservative Forecast: $0.0729 - $0.0793
- Neutral Forecast: $0.0793 - $0.1007
- Optimistic Forecast: $0.0929 - $0.1007 (requires sustained market momentum and increased adoption)
2026-2028 Medium-term Outlook
- Market Phase Expectations: Consolidation with gradual upward trajectory, characterized by increased volatility and market maturation
- Price Range Predictions:
- 2026: $0.0540 - $0.1322
- 2027: $0.1044 - $0.1611
- 2028: $0.0817 - $0.1552
- Key Catalysts: Ecosystem development, institutional adoption, technological upgrades, and regulatory clarity
2029-2030 Long-term Outlook
- Base Case: $0.0845 - $0.1748 (assuming moderate market growth and steady adoption trajectory)
- Optimistic Case: $0.1456 - $0.2275 (assuming accelerated mainstream adoption and positive macroeconomic conditions)
- Transformative Case: $0.2275+ (extreme favorable conditions including major institutional partnerships and breakthrough technological implementations)
- 2030-12-31: IN reaching $0.2275 (highest projected price point, representing 101% potential gain from current levels)
| 年份 | 预测最高价 | 预测平均价格 | 预测最低价 | 涨跌幅 |
|---|---|---|---|---|
| 2025 | 0.10066 | 0.07926 | 0.07292 | 0 |
| 2026 | 0.13224 | 0.08996 | 0.05398 | 13 |
| 2027 | 0.1611 | 0.1111 | 0.10443 | 39 |
| 2028 | 0.15515 | 0.1361 | 0.08166 | 70 |
| 2029 | 0.17475 | 0.14563 | 0.08446 | 82 |
| 2030 | 0.22747 | 0.16019 | 0.15058 | 101 |
INFINIT (IN) Professional Investment Strategy and Risk Management Report
IV. IN Investment Methodology and Risk Management
IN Investment Approaches
(1) Long-term Holding Strategy
- Target Investors: Institutional investors, long-term believers in AI-powered DeFi infrastructure, and retail investors with multi-year investment horizons
- Operational Recommendations:
- Accumulate IN tokens during market corrections below $0.08, as the token shows strong fundamentals with backing from leading venture capital firms including Electric Capital, Mirana Ventures, Hashed, and Lightspeed Faction
- Dollar-cost averaging (DCA) approach to mitigate volatility and reduce timing risk
- Store tokens securely in Gate Web3 Wallet or hardware storage solutions for extended holding periods
(2) Active Trading Strategy
-
Technical Analysis Tools:
- Relative Strength Index (RSI): Monitor overbought (>70) and oversold (<30) conditions; current 24-hour performance of +9.96% suggests potential retracement opportunities
- Moving Average Convergence Divergence (MACD): Track momentum shifts particularly given the 7-day decline of -6.17%
-
Range Trading Considerations:
- Support level: $0.07209 (24-hour low)
- Resistance level: $0.08534 (24-hour high)
- Current price: $0.0796 offers potential swing trading opportunities within the identified range
IN Risk Management Framework
(1) Asset Allocation Principles
- Conservative Investors: 2-3% portfolio allocation maximum
- Aggressive Investors: 5-8% portfolio allocation
- Professional Investors: Up to 10-15% allocation with diversified hedging strategies
(2) Risk Hedging Solutions
- Volatility Hedging: Consider stablecoin pairs on Gate.com to execute rapid exits if price approaches support levels
- Portfolio Diversification: Balance IN holdings with established DeFi protocols and blue-chip cryptocurrencies to reduce concentration risk
(3) Secure Storage Solutions
- Web3 Wallet Recommendation: Gate Web3 Wallet for active trading and medium-term holding with convenient interface and direct integration with Gate.com
- Cold Storage Approach: Transfer to hardware wallets for long-term storage beyond 6 months
- Security Best Practices:
- Never share private keys or seed phrases
- Enable multi-signature authentication where available
- Verify contract address (0x61fac5f038515572d6f42d4bcb6b581642753d50) on Etherscan before transactions
V. Potential Risks and Challenges for IN
Market Risk
- Liquidity Risk: 24-hour trading volume of $56,062.07 indicates relatively modest liquidity; large trades could experience significant slippage
- Market Sentiment Risk: With only 623 token holders currently, concentration risk exists; whale movements could trigger sharp price swings
- Valuation Sustainability Risk: The 22.83% ratio between market cap ($18.18M) and fully diluted valuation ($79.6M) suggests significant dilution potential as additional tokens enter circulation
Regulatory Risk
- DeFi Protocol Compliance: Evolving regulatory frameworks for AI-driven DeFi protocols and automated investment strategies could impose restrictions on protocol operations
- Smart Contract Regulation: Classification of AI agents as autonomous investment advisors may trigger securities regulatory scrutiny
- Cross-border Operational Constraints: Regulatory actions in major markets could limit user accessibility
Technology Risk
- Smart Contract Vulnerability: AI-driven protocols operate on complex algorithms; vulnerabilities in agent logic or execution functions could result in user losses
- Model Reliability Risk: Dependency on AI agents for strategy generation introduces risks if model outputs contain errors or unexpected behaviors under extreme market conditions
- Integration Risk: Interconnection with multiple DeFi protocols increases exposure to cascading failures if partner protocols experience security incidents
VI. Conclusion and Action Recommendations
IN Investment Value Assessment
INFINIT represents an innovative convergence of artificial intelligence and decentralized finance, positioning itself at the intersection of two major growth trends. The project's backing by prominent venture capital firms validates its foundational concept. However, early-stage characteristics including modest trading volume, concentrated holder distribution, and nascent technology introduce substantial risk factors. The token's 30-day gain of 13.19% contrasts with recent 7-day decline of -6.17%, reflecting typical early-stage volatility patterns.
The project's core value proposition—democratizing DeFi access through AI agents and natural language interfaces—addresses real market friction. However, execution risks, regulatory uncertainty, and competitive dynamics remain significant considerations for investors.
IN Investment Recommendations
✅ For Beginners: Start with small position sizing (0.5-1% of portfolio) through Gate.com; use Dollar-Cost Averaging over 3-6 months to understand price dynamics; avoid leverage or complex trading strategies
✅ For Experienced Investors: Implement technical analysis-based range trading between $0.072-$0.085 support/resistance levels; maintain 3-5% portfolio allocation with stop-loss orders at $0.070; actively monitor project development updates and partnership announcements
✅ For Institutional Investors: Conduct comprehensive due diligence on AI agent reliability and smart contract audits; establish positions in tranches aligned with milestone achievements; consider participating in strategic rounds if available
Methods for Trading IN
- Centralized Exchange: Trade IN on Gate.com with direct fiat on-ramp capabilities, multiple trading pairs, and access to professional trading tools
- Decentralized Trading: Utilize Ethereum-based protocols for direct peer-to-peer transactions with full custody control
- Direct Holdings: Acquire and hold IN in Gate Web3 Wallet for participation in governance and future protocol features
Disclaimer: Cryptocurrency investments carry extreme risk. This report does not constitute investment advice. Investors must conduct independent research and consult with professional financial advisors before making investment decisions. Never invest funds you cannot afford to lose completely. Past performance does not guarantee future results. The volatility and nascent nature of AI-driven DeFi protocols introduce unpredictable risks.
FAQ
Is pi going to be worth anything?
Yes, Pi has significant potential value. With growing user adoption, mainnet progress, and increasing ecosystem development, Pi is positioned to gain substantial worth as adoption expands and utility increases across the network.
What is the PI price prediction for 2025?
PI is currently trading at $0.2018. Price forecasts for 2025 range from $0.27 to $0.42, with some analysts predicting an average of $0.40. However, bearish outlooks suggest potential declines to $0.0395. The price outlook remains highly uncertain due to volatile market conditions.
What factors influence PI coin's price movements?
Pi Coin's price is influenced by market sentiment, cryptocurrency market trends, trading volume, development team updates, and regulatory changes. Network adoption and ecosystem growth also impact its value significantly.
How does PI compare to other cryptocurrencies in terms of price potential?
PI offers unique potential with its massive active user base and innovative mobile-first approach. Its staged mainnet rollout and community-driven model position it competitively. Early adoption and network effects suggest strong long-term appreciation prospects compared to traditional cryptocurrencies.
What are the risks of investing in PI based on price predictions?
Price predictions carry market volatility risks. PI prices can fluctuate significantly based on market sentiment, adoption rates, and regulatory changes. Investors may experience substantial losses if predictions prove inaccurate. Rely on thorough research and risk assessment before investing.
Share
Content
Introduction: IN's Market Position and Investment Value
I. IN Price History Review and Current Market Status
Macroeconomic Environment
Supply and Demand Dynamics
Three、2025-2030 IN Price Forecast
IV. IN Investment Methodology and Risk Management
V. Potential Risks and Challenges for IN
VI. Conclusion and Action Recommendations
FAQ
How to Buy Cryptocurrency


Trending Cryptocurrencies


Is Hey Anon (ANON) a Good Investment?: Analyzing the Potential Returns and Risks of This Emerging Cryptocurrency

Is Hive AI (BUZZ) a good investment?: Analyzing the Potential and Risks of this Emerging Cryptocurrency

2025 GIZA Price Prediction: Analyzing Market Trends and Potential Growth Factors in the Cryptocurrency Landscape
2025 ALCH Price Prediction: Bullish Outlook as DeFi Adoption Surges

Is Velvet (VELVET) a good investment? : Analyzing the potential and risks of this new cryptocurrency

2025 UNO Price Prediction: Analyzing Market Trends and Potential Growth Factors

Crypto Token Generation Event: A Comprehensive Guide for Investors

Blum Launch Schedule Explained

2025 GRIFFAIN Price Prediction: Expert Analysis and Market Forecast for the Next Generation Digital Asset

2025 ALICE Price Prediction: Expert Analysis and Market Forecast for the Coming Year

AI Innovations in Digital Art Copyright Protection on Blockchain